

Open any marketing dashboard right now, and you’ll see a wall of numbers. Impressions, reach, sessions, bounce rate, likes, followers, click-through rate- fifteen different charts all glowing green. Looks great. Feels productive. And yet, ask the person staring at that dashboard one simple question, “is this working?” and watch them stall.
That’s the actual state of marketing measurement at most companies. Not a lack of data. A flood of it. The problem isn’t visibility; it’s relevance. Most of what gets tracked doesn’t tell you anything about whether the business is making money, growing, or wasting its budget. A spike in impressions feels like progress until someone asks how many of those impressions turned into a customer, and the room goes quiet.
This is where vanity metrics and real KPIs split apart. Vanity metrics are the numbers that go up and to the right and make everyone feel good in a meeting. Real digital marketing KPIs are the numbers tied to something the business actually needs: revenue, retention, qualified leads, cost efficiency. They’re not always the prettiest numbers on the slide. Sometimes they go down before they go up. But they’re the ones worth paying attention to.
This piece walks through what actually counts as a KPI versus what’s just noise, how to pick the right ones for your specific business instead of copying a template, and then breaks it down channel by channel: SEO, paid media, content, email, social, all the way through to the revenue numbers that tie everything together. Along the way, there’s a section on attribution, because honestly, most KPI reporting is built on a broken foundation and nobody talks about it enough. And at the end, a practical look at building a dashboard people will actually open instead of ignoring.
No fluff, no fifty-metric checklist you’ll never use. Just the stuff that actually moves the needle.
What Actually Makes a Metric a Digital Marketing KPIs
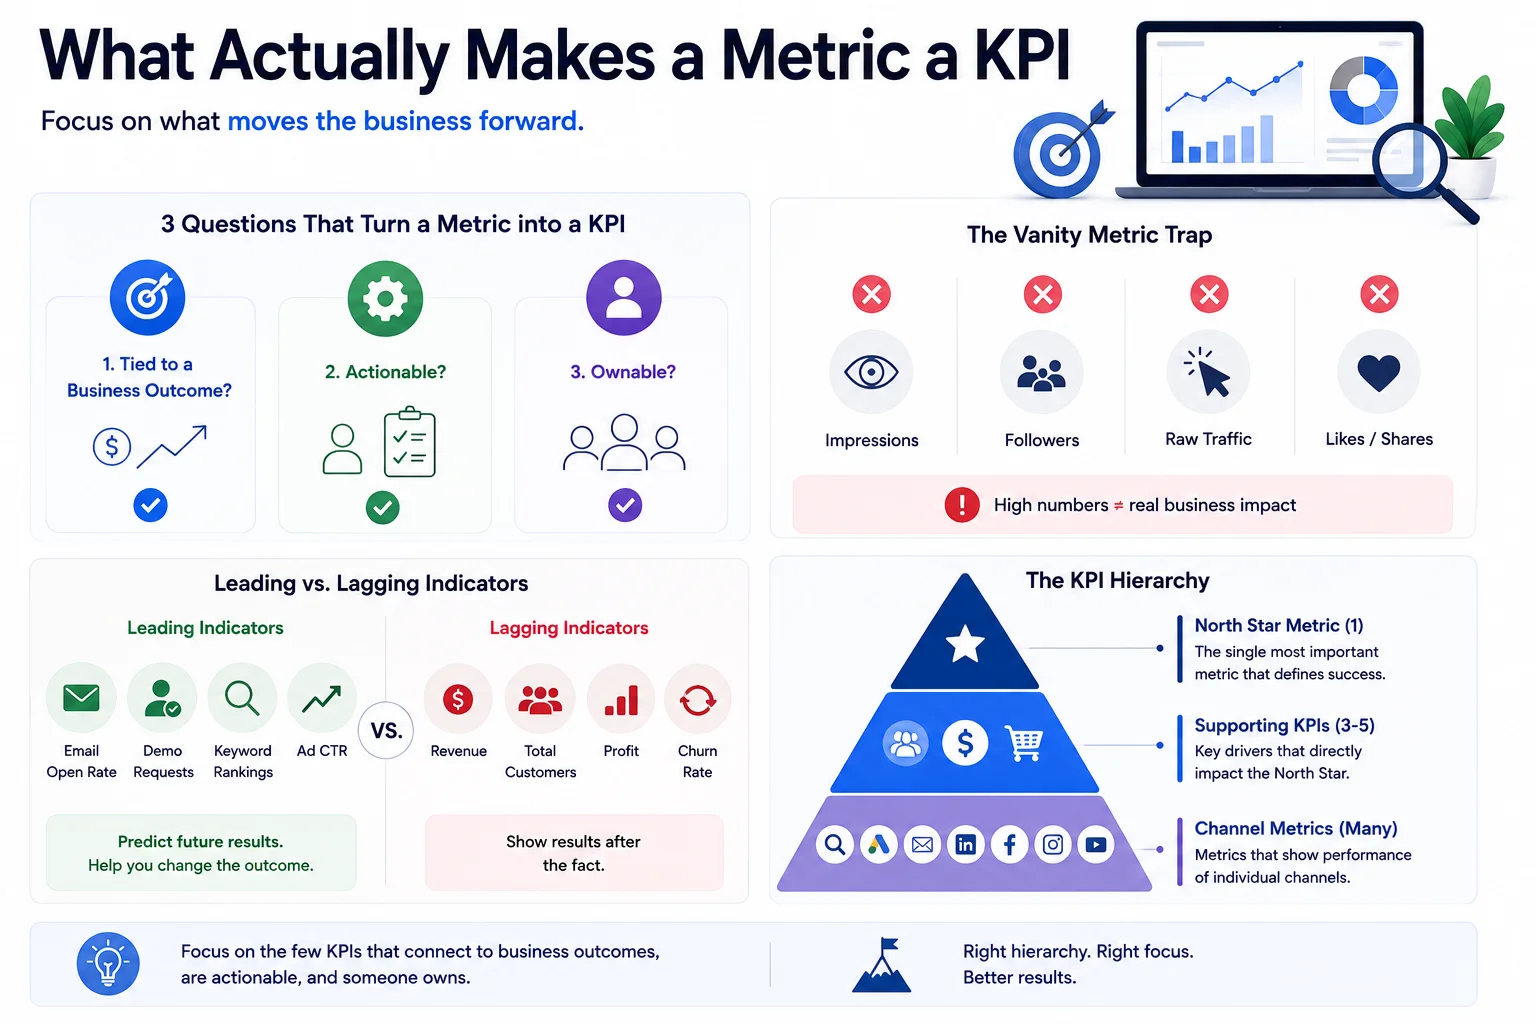
Here’s something that gets mixed up constantly: not every metric is a KPI. A metric is just a number you can measure. Page views, time on site, number of tweets sent, all metrics. A KPI, key performance indicator, is a metric that’s been deliberately chosen because it tells you something about whether you’re hitting a goal that matters to the business.
So how do you tell the difference? Run it through three questions.
- Is it tied to a business outcome? Not “did engagement go up” but “did this lead to revenue, retention, or some other thing the company cares about.” If a number moving up or down doesn’t change a business decision, it’s not a KPI, it’s trivia.
- Is it actionable? Can someone look at this number and actually do something differently because of it? If the answer is a shrug, that’s a red flag.
- Can someone own it? A real KPI has a name attached to it. Someone is responsible for moving that number. If no one owns it, no one’s accountable for it either.
Now, the vanity metric trap. Everyone falls into this one at some point, usually because vanity metrics are easy to report and they almost always look good. Take impressions. A campaign generates two million impressions, sounds massive, except impressions don’t tell you if anyone actually saw the ad, clicked it, or cared. Followers are another one. A brand with 100,000 Instagram followers and 40 likes per post has a problem, not a flex. And raw traffic, the classic. Traffic without context is meaningless. 50,000 visits a month sounds like growth until you realize none of them convert and half are bots or bounce in three seconds.
There’s also a difference between leading and lagging indicators, and a pillar strategy needs both. Lagging indicators are outcomes, revenue, total customers, churn. They tell you what already happened. Leading indicators are the early signals that predict those outcomes, things like email open rate, demo requests, or organic keyword rankings climbing. Lagging metrics confirm the story. Leading metrics let you change the story before it’s too late.
A simple way to think about the hierarchy: at the top sits one North Star metric, the single number that best represents whether the business is winning, think monthly recurring revenue for a SaaS company or repeat purchase rate for an e-commerce brand. Below that sit a handful of supporting KPIs that feed into the North Star, like qualified leads or customer acquisition cost. And below those sit channel-level metrics, the SEO numbers, the paid ad numbers, the email numbers, that explain how each individual effort contributes upward. Get this hierarchy wrong, and teams end up optimizing channel metrics that have nothing to do with what the business needs.
How to Choose the Right Digital Marketing KPIs for Your Business
There’s no universal list of “the 10 KPIs every business must track.” Anyone selling you that list is selling you a template, not a strategy. The starting point has to be your business goals, not the channels you happen to be running.
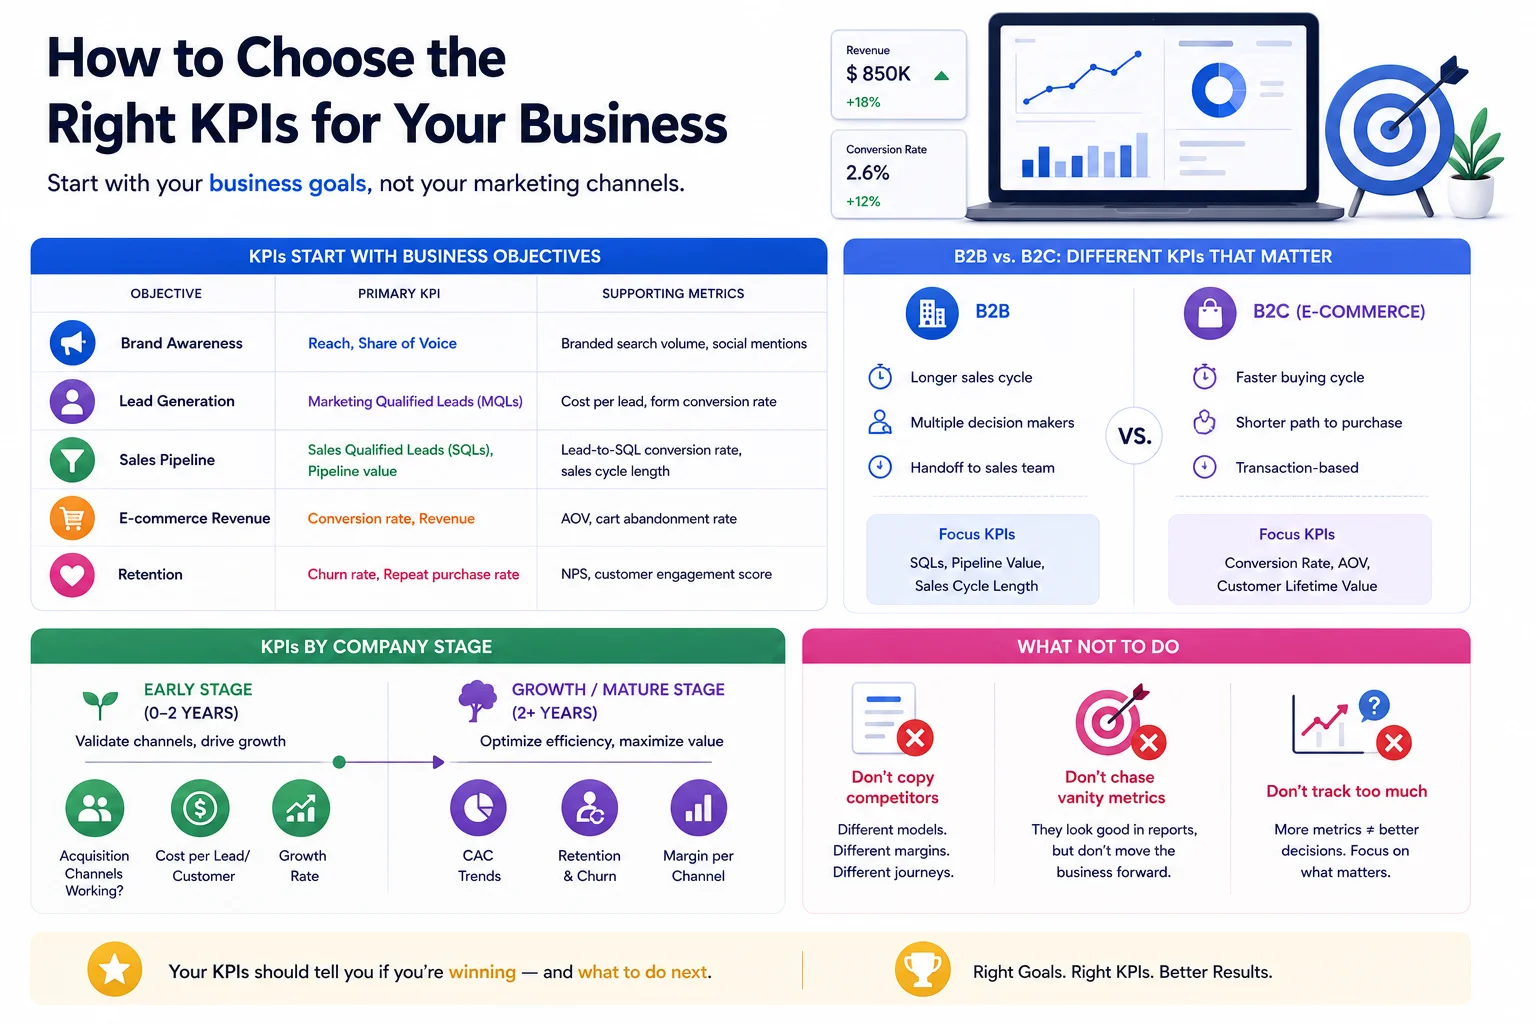
Start with what the business is actually trying to do. Is it brand awareness because you’re a new company nobody’s heard of? Is it lead generation because you’re B2B and sales needs a pipeline? Is it retention because acquisition is already expensive and churn is bleeding revenue? Or is it straight revenue growth because the board wants numbers next quarter? Each of these points to a different set of primary KPIs.
| Objective | Primary KPI | Supporting Metrics |
|---|---|---|
| Brand Awareness | Reach, Share of Voice | Branded search volume, social mentions |
| Lead Generation | Marketing Qualified Leads (MQLs) | Cost per lead, form conversion rate |
| Sales Pipeline | Sales Qualified Leads (SQLs), Pipeline value | Lead-to-SQL conversion rate, sales cycle length |
| E-commerce Revenue | Conversion rate, Revenue | AOV, cart abandonment rate |
| Retention | Churn rate, Repeat purchase rate | NPS, customer engagement score |
B2B and B2C businesses don’t measure success the same way, and treating them like they do is one of the more common mistakes out there. B2B marketing usually has a longer sales cycle, multiple decision makers, and a handoff to a sales team, so the KPIs that matter most are things like SQLs, pipeline value, and sales cycle length. A B2B marketer obsessing over Instagram engagement rate is probably looking at the wrong dashboard. B2C, especially e-commerce, moves faster and the path from ad to purchase can happen in minutes, so conversion rate, average order value, and customer lifetime value carry more weight day to day.
Company stage matters too. A startup six months old with limited budget needs to know if its acquisition channels are even working before it worries about lifetime value curves. A company that’s been around for years and has a stable customer base should be watching efficiency metrics, CAC trends, retention curves, margin per channel, because at that stage, growth at any cost stops being the priority.
And one more thing worth saying plainly: don’t copy a competitor’s KPI list just because it sounds smart in a deck. Their business model, their margins, their customer journey, none of that matches yours exactly. Borrow frameworks, not numbers.
SEO & Organic KPIs
SEO has more vanity metric traps than almost any other channel because the numbers that look the most impressive, raw traffic and keyword rankings, are often the least useful on their own.
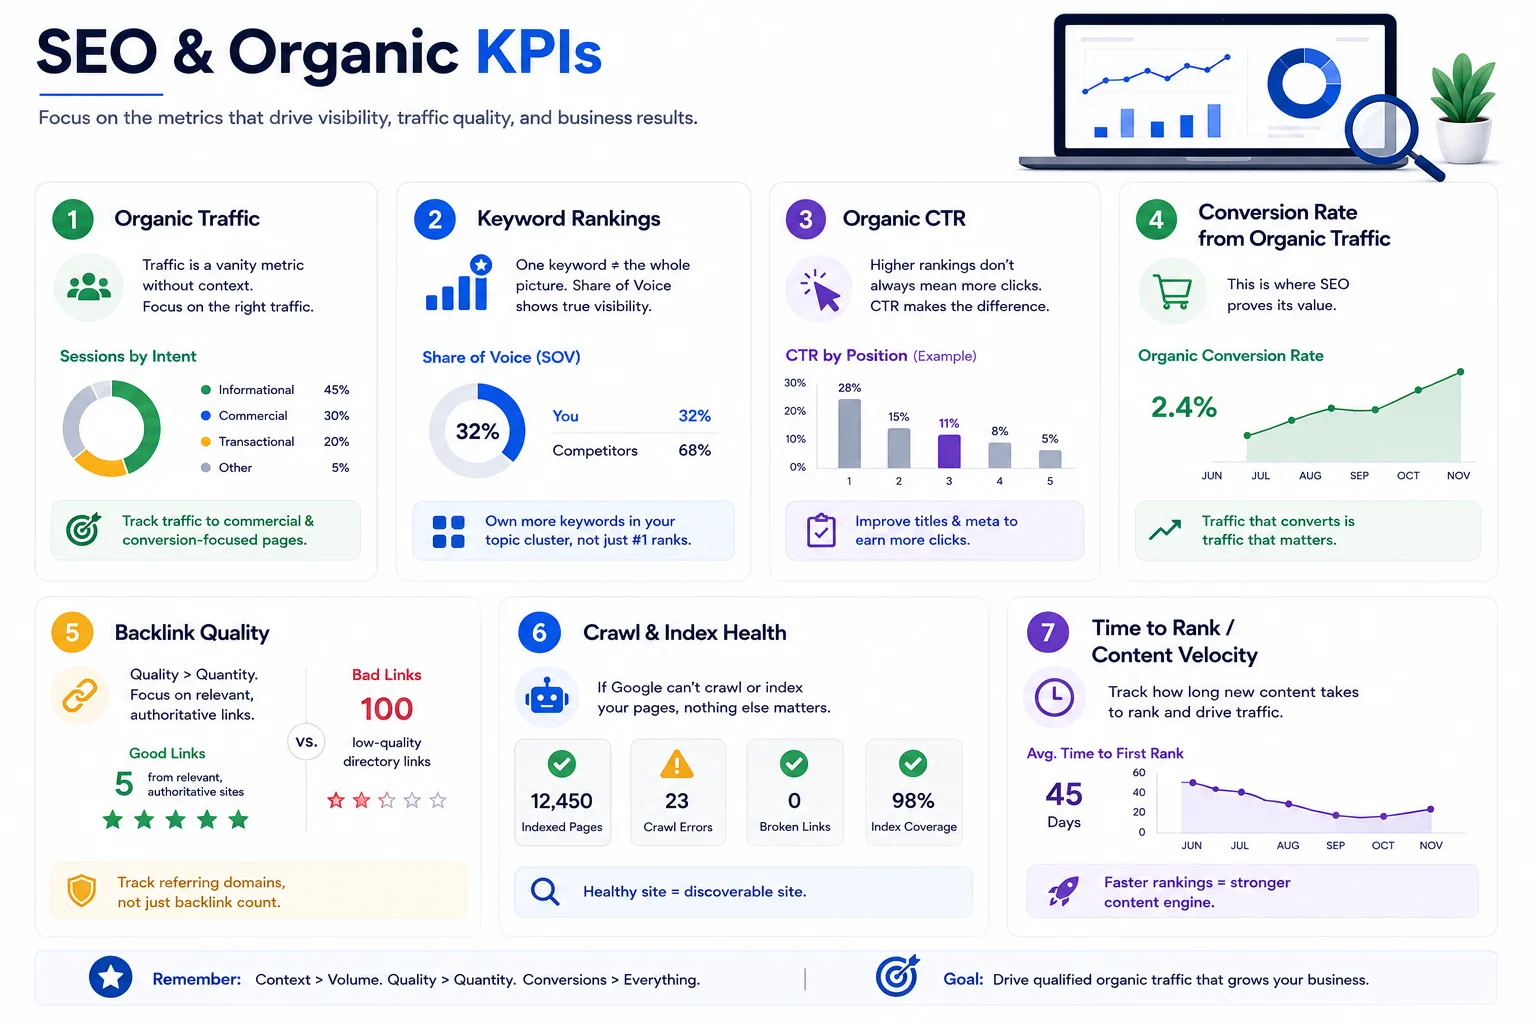
- Organic traffic. This one needs a caveat right up front: traffic without context isn’t a KPI, it’s a vanity number wearing a KPI costume. A jump in organic sessions means nothing if those sessions are landing on the wrong pages, coming from irrelevant queries, or bouncing immediately. The useful version of this metric is traffic segmented by intent, traffic to commercial or conversion-focused pages, not just total site visits.
- Keyword rankings. Position tracking still matters, but obsessing over rank #1 for a single keyword misses the bigger picture. Share of voice, how much of the total search visibility for your target topic cluster you actually own across dozens of related keywords, tells a more complete story than any single ranking ever will. A site ranking #3 for fifty relevant terms is in better shape than a site ranking #1 for one term and nowhere for the rest.
- Organic CTR. Ranking high doesn’t guarantee clicks. A page sitting at position 3 with a weak meta description can get outclicked by a page at position 5 with a sharper title tag. CTR by position varies a lot depending on the query and whether there are featured snippets or ads crowding the results page, so treat published “average CTR by position” numbers as a rough guide, not gospel, and compare your own pages against their own historical performance instead.
- Conversion rate from organic traffic. This is where SEO earns its keep. If organic traffic is climbing but conversions from that traffic aren’t, something’s broken, wrong intent targeting, weak landing pages, or content that ranks for queries that were never going to convert in the first place.
- Backlink quality. Referring domains matter more than raw backlink count. A hundred low-quality directory links won’t do what five links from genuinely relevant, authoritative sites will. Chasing link volume instead of link relevance is a classic rookie mistake, and domain authority scores from third-party tools should be treated as directional, not definitive, since they’re proprietary estimates, not something Google publishes.
- Crawl and index health. This isn’t a growth metric, it’s a diagnostic one. Indexed page count, crawl errors, broken internal links, these tell you if Google can even see your content properly. Ignore this and you can do everything else right and still underperform because half your pages aren’t indexed.
- Time to rank / content velocity. For pillar content strategies specifically, tracking how long it takes new content to start ranking and gaining traffic gives a sense of whether the content engine is actually working or just adding pages to a pile.
Paid Media (PPC/Paid Social) KPIs
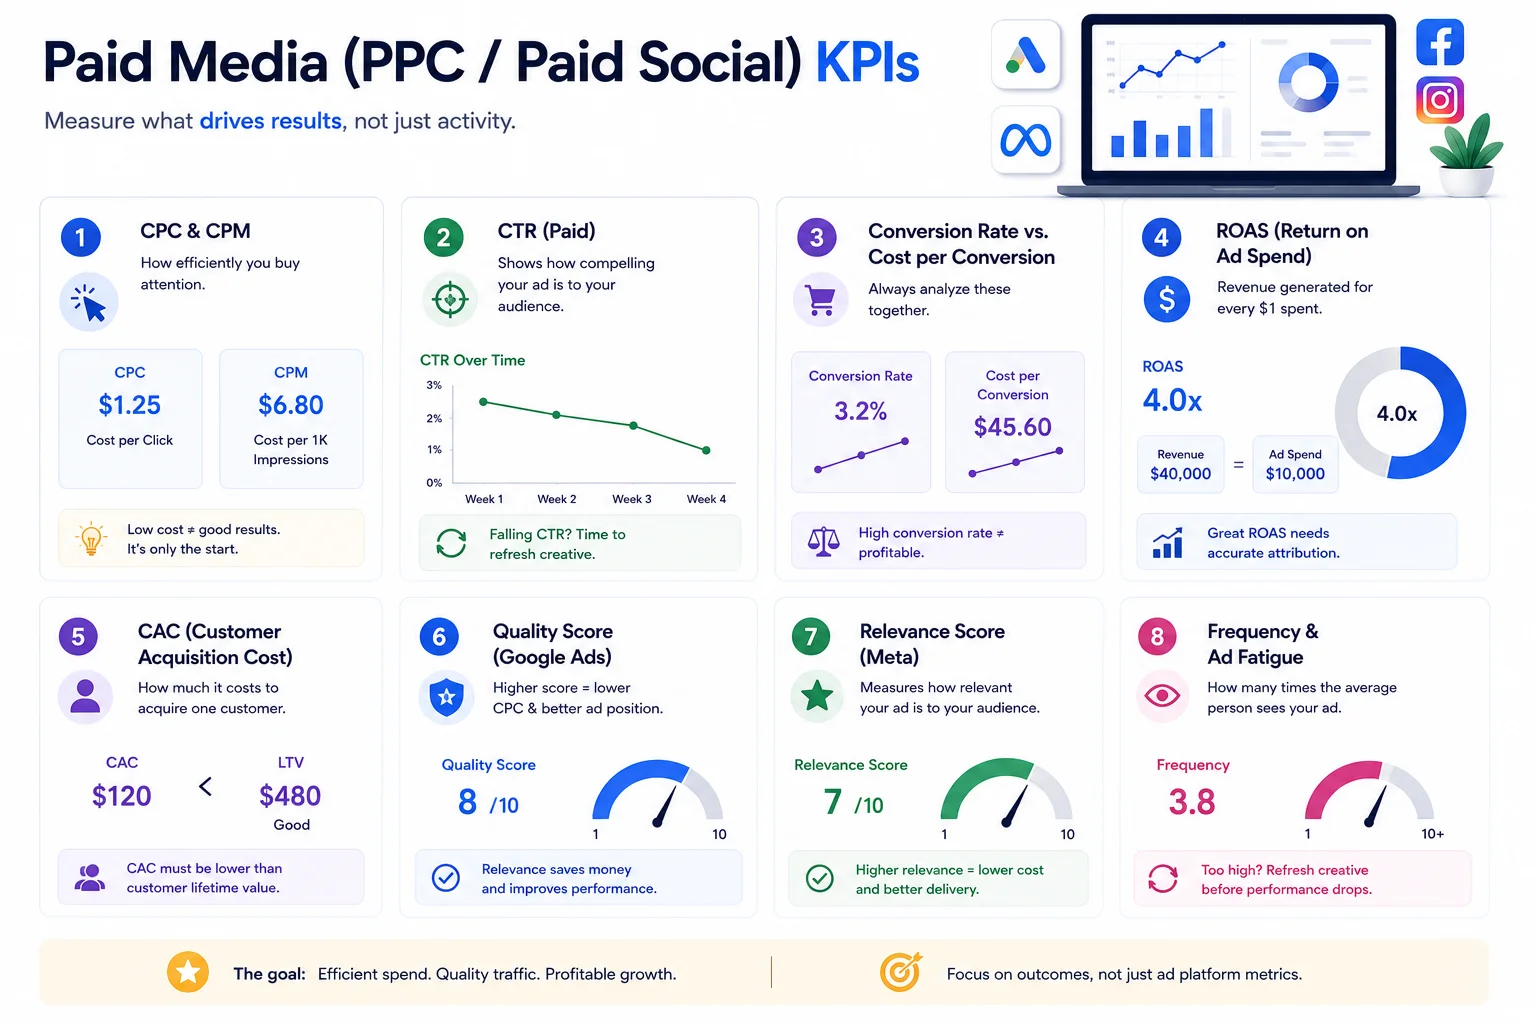
Paid media gives instant feedback, which is both its biggest strength and the reason it’s so easy to misread.
- CPC (cost per click) and CPM (cost per thousand impressions). These tell you how efficiently you’re buying attention, nothing more. A low CPC feels good but means nothing if those clicks don’t convert. CPM matters more for awareness-focused campaigns where the goal is simply getting seen by a lot of people cheaply.
- CTR for paid. Paid CTR benchmarks run differently than organic ones because paid placements compete directly against other ads and organic results on the same page, and ad fatigue sets in faster since the same audience sees the same creative repeatedly. A dropping CTR over time on a stagnant ad set is usually a signal to refresh creative, not necessarily to increase the budget.
- Conversion rate vs. cost per conversion. These two need to be read together. A high conversion rate with a sky-high cost per conversion can still be a losing campaign if the cost outweighs the value of the conversion itself.
- ROAS (return on ad spend). Formula: revenue generated from ads divided by amount spent on ads. A campaign with $10,000 in ad spend generating $40,000 in revenue has a 4x ROAS. The most common miscalculation happens when teams attribute all revenue to the last channel touched, ignoring that the customer may have interacted with five other touchpoints before that final ad click. ROAS without solid attribution underneath it can look great and still be lying to you.
- CAC (customer acquisition cost). This connects directly to lifetime value, covered in more depth later in the revenue section, but the short version, a great ROAS on a single channel doesn’t matter if your blended CAC across all channels is higher than what a customer is worth to the business over time.
- Quality Score (Google Ads) and Relevance Score (Meta). These platform-specific scores function as efficiency levers. A higher quality score on Google Ads generally means lower CPCs for the same ad position, because the platform rewards relevance between the ad, the keyword, and the landing page. Ignore this score and you end up paying more for the exact same results.
- Frequency and ad fatigue. Specific to paid social. Frequency measures how many times the average person has seen your ad. Once that number climbs too high without a creative refresh, performance drops even if the targeting stays exactly the same. This metric alone explains a lot of “why did this campaign suddenly stop working” conversations.
Content Marketing KPIs
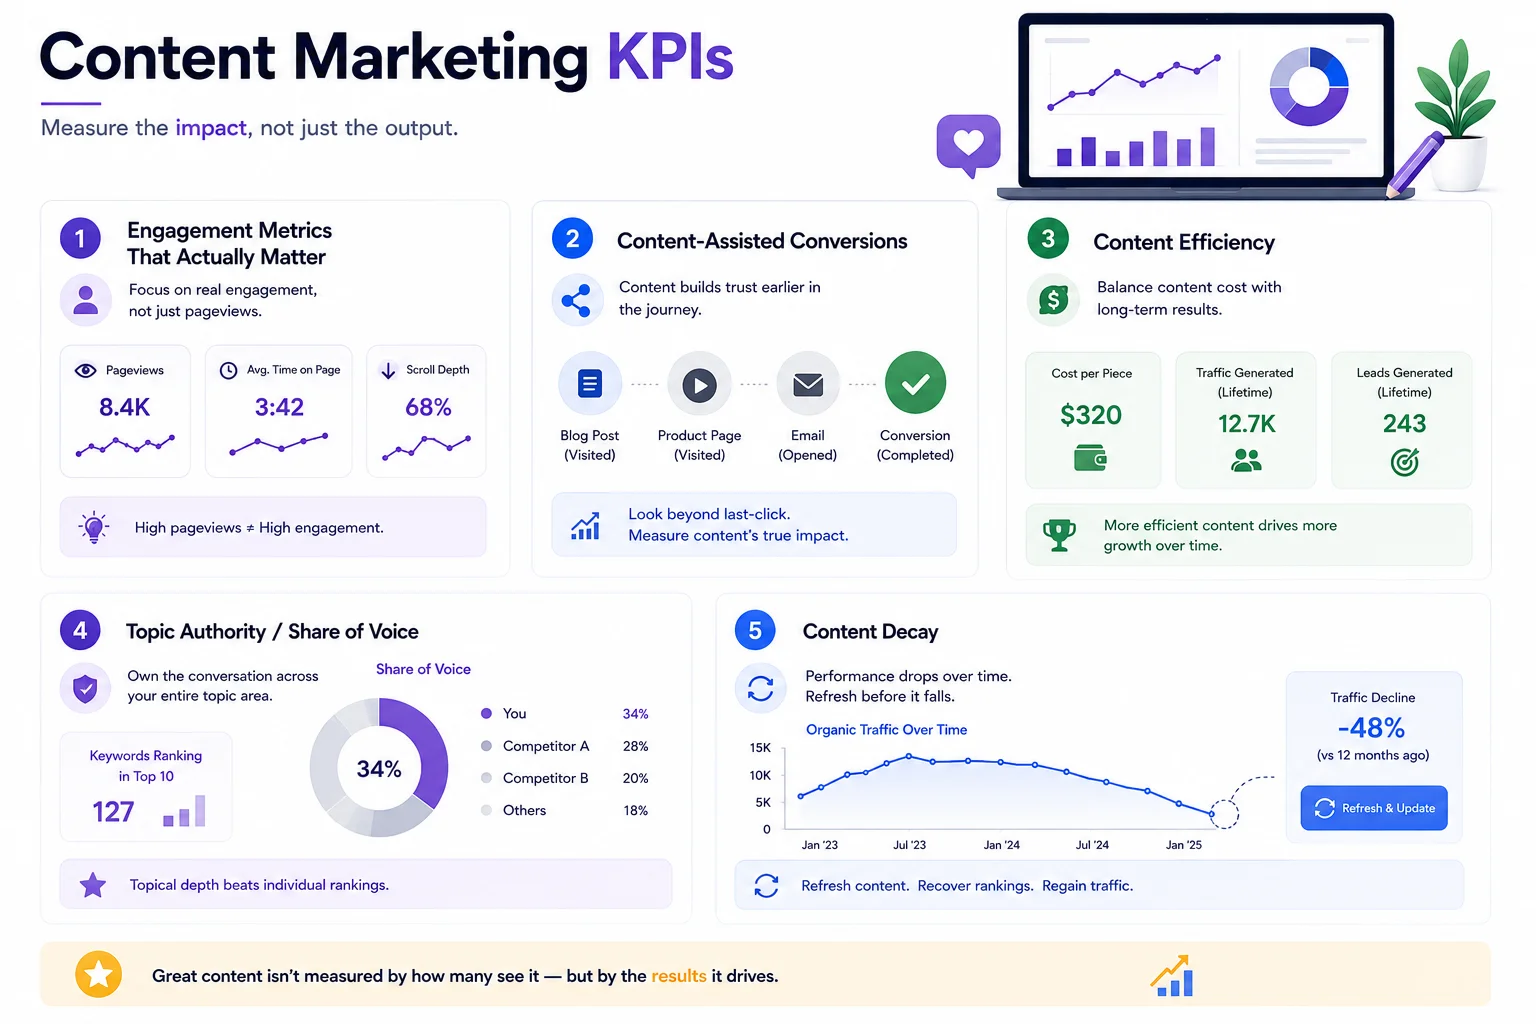
Content marketing measurement gets messy fast because the value of content often shows up somewhere other than where it was published.
- Engagement metrics that actually matter. Average time on page and scroll depth tell you whether people are genuinely reading or just landing and leaving. Pure pageviews tell you almost nothing on their own, a piece can get 10,000 views and zero real engagement if it’s ranking for the wrong query or the headline overpromises what the content delivers.
- Content-assisted conversions. This requires looking beyond last-click attribution, since a blog post is rarely the final touchpoint before a purchase or signup. It’s usually the thing that built trust three weeks earlier. This connects directly into the attribution section further down.
- Content efficiency. Cost per piece of content versus the traffic or leads it generates over its lifetime. A $200 blog post that brings in steady organic traffic for two years is more efficient than a $2,000 piece that spikes for a week and disappears.
- Topic authority / share of voice. How much visibility a site owns across an entire topic cluster rather than a single keyword. This is a longer-term signal but a more durable one, since it reflects whether the content strategy is building real topical depth or just publishing scattered, disconnected posts.
- Content decay. Most teams never track this, which is exactly why it’s worth mentioning. Content that ranked well a year ago can quietly lose traffic as competitors publish fresher material or search intent shifts. Tracking decay means catching pages before they fall off a cliff and refreshing them instead of letting performance erode silently.
Email Marketing KPIs
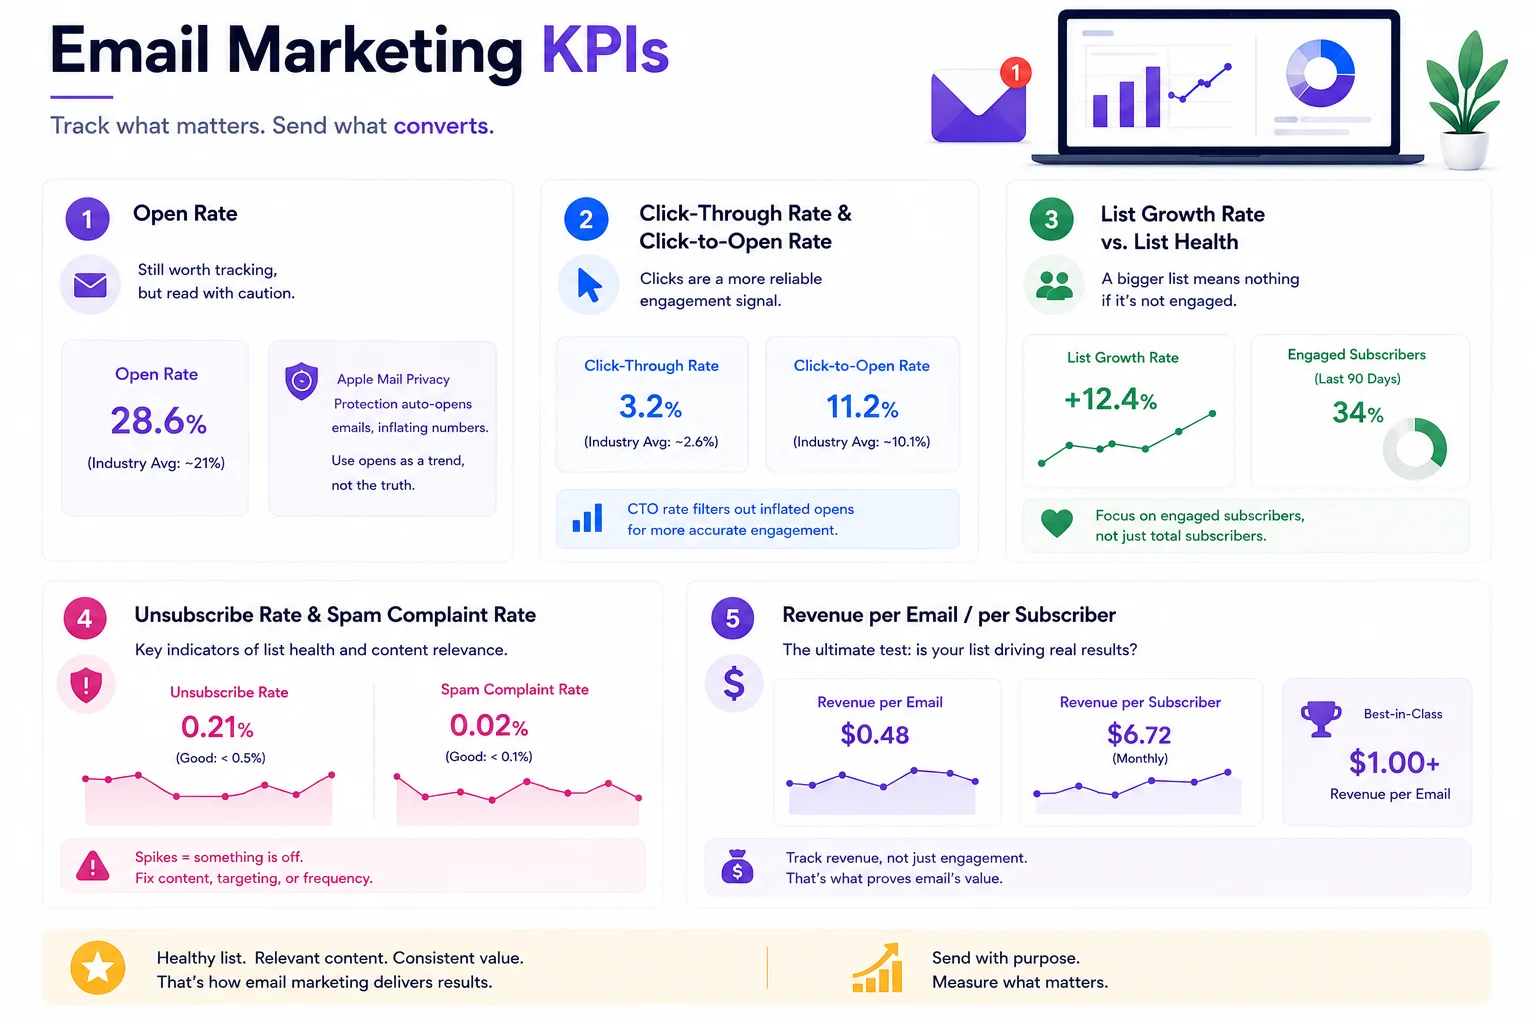
Email marketing still works, but the metrics around it changed significantly after Apple introduced Mail Privacy Protection, and a lot of reporting hasn’t caught up.
- Open rate. Worth tracking, but with a real caveat, Apple’s Mail Privacy Protection auto-opens emails for a large share of iOS users regardless of whether a human actually read them, which inflates open rate numbers and makes them less reliable than they used to be.
- Click-through rate and click-to-open rate. Because of the open rate issue above, click-to-open rate has become the more trustworthy engagement signal, since it measures clicks against actual opens rather than against total emails sent, filtering out some of that inflated noise.
- List growth rate vs. list health. A growing list looks good on paper, but a list full of disengaged subscribers drags down deliverability and inflates costs on most email platforms that charge by list size. Tracking the percentage of genuinely engaged subscribers, people opening or clicking within the last 90 days, matters more than total subscriber count.
- Unsubscribe and spam complaint rate. These are health checks. A sudden spike means something in the recent send, frequency, content, or targeting, went wrong, and ignoring it risks deliverability across the entire domain.
- Revenue per email / per subscriber. For e-commerce or lead-gen businesses, this ties email activity directly to outcomes. It answers the only question that really matters, is this list worth the time spent maintaining it.
Social Media KPIs
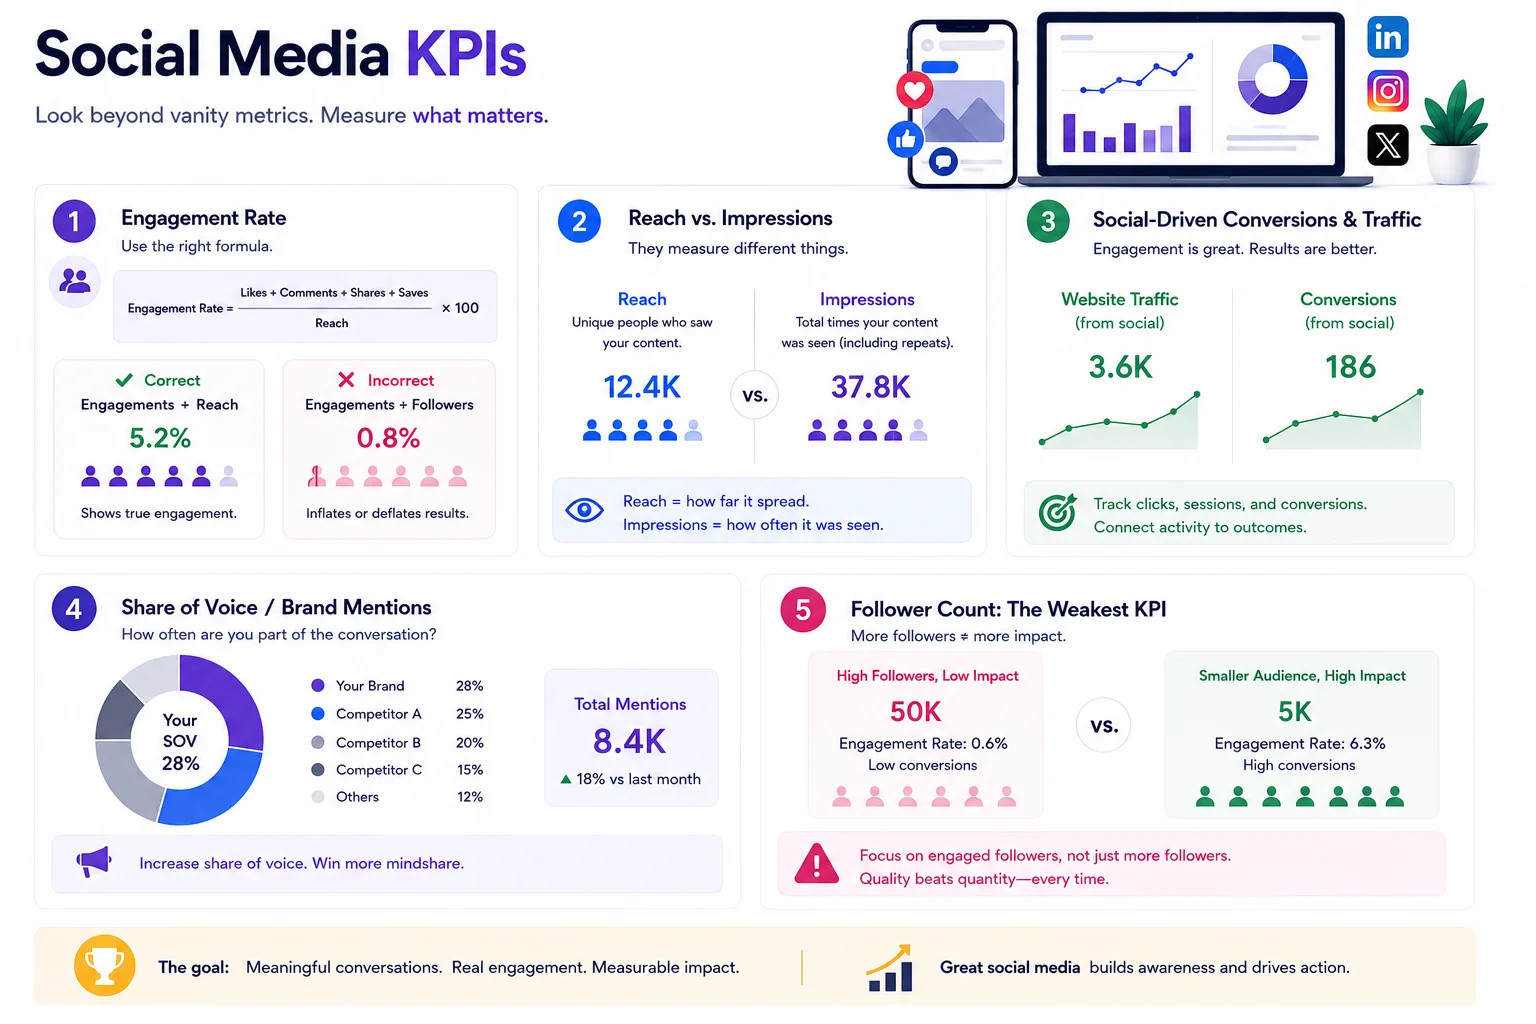
Social is probably the channel with the biggest gap between what gets celebrated internally and what actually matters.
- Engagement rate. Defined properly, this is engagements divided by reach, not engagements divided by follower count. The follower-count version inflates numbers for accounts that haven’t posted in a while or have a stale audience, and makes smaller, more active accounts look artificially weaker than they are.
- Reach vs. impressions. Reach counts unique people who saw a post, impressions count total views including repeats. Reach is more useful for measuring how far content actually spread, impressions matter more when frequency and repetition are part of the strategy.
- Social-driven conversions and traffic. On-platform engagement, likes, comments, shares, feels good but doesn’t pay bills directly. Tracking how much actual website traffic or conversions come from social links closes the loop between activity and outcome.
- Share of voice / brand mention tracking. How often the brand gets mentioned relative to competitors across social platforms. Useful for awareness-stage businesses trying to understand whether they’re gaining or losing ground in the conversation.
- Follower count. This is the weakest KPI on the entire list, and it’s worth saying directly. Follower count can be bought, inflated by giveaways, or grown through bots, and it correlates poorly with actual business outcomes. An account with 5,000 highly engaged followers in a specific niche will outperform one with 50,000 disengaged followers nearly every time when it comes to driving real action.
Conversion & Revenue KPIs
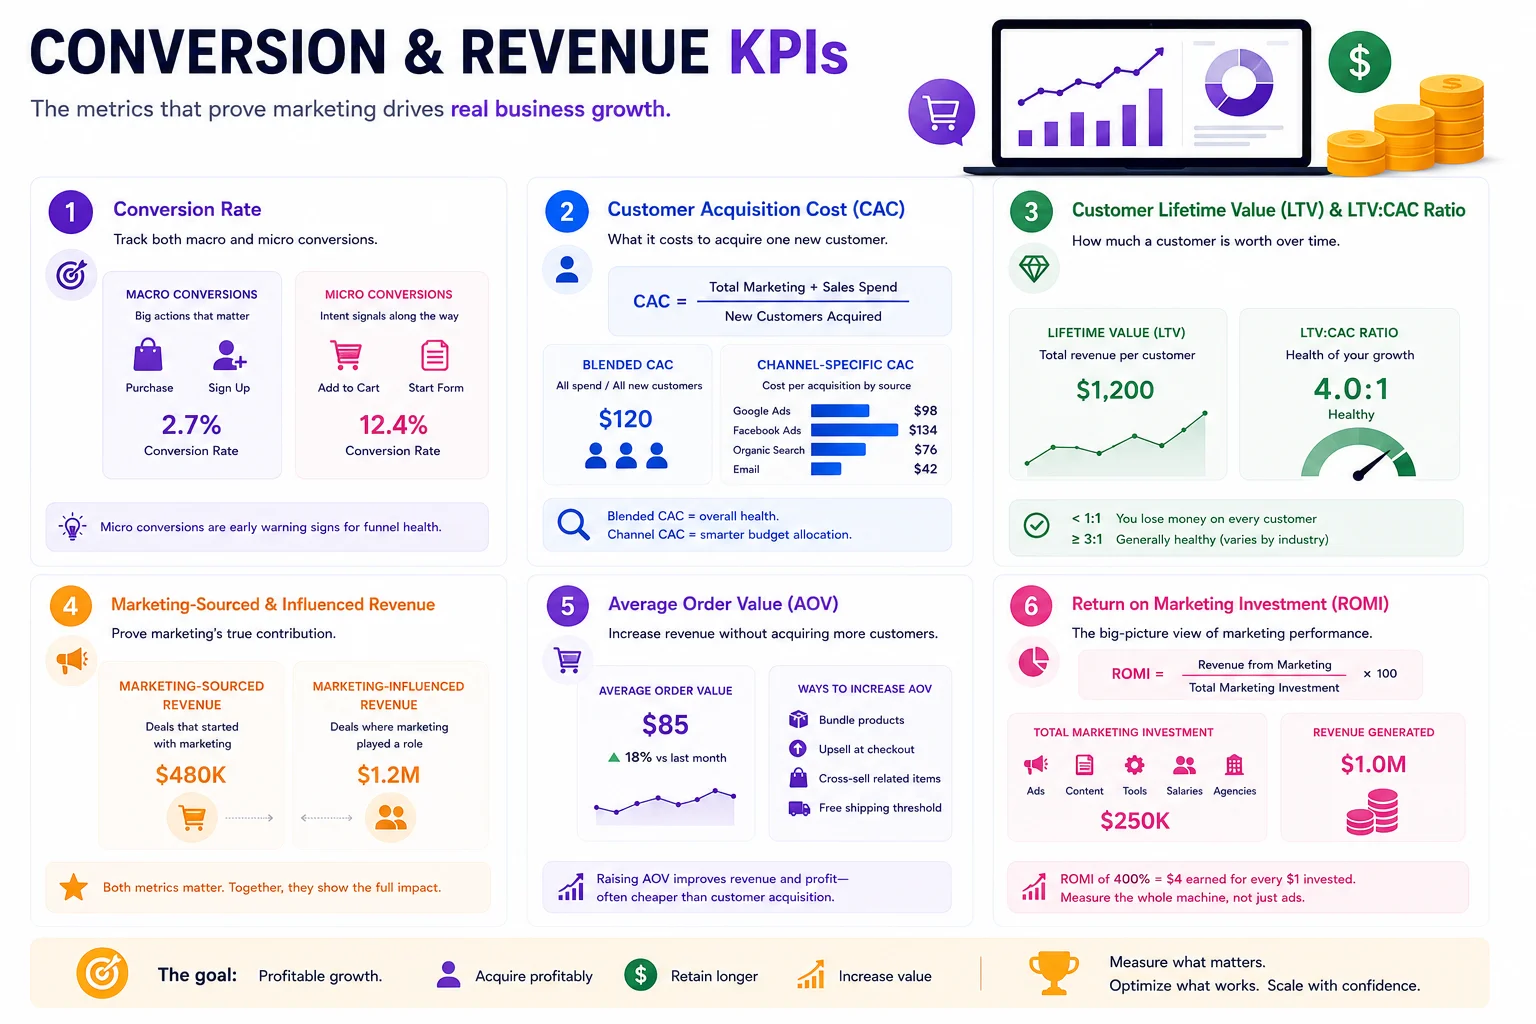
This is the section where everything from above either proves its worth or gets exposed as noise.
- Conversion rate. Split this into macro conversions, the big ones like a purchase or signup, and micro conversions, smaller actions like adding to cart or starting a form, that signal intent along the way. Tracking only the macro conversion misses early warning signs when something in the funnel breaks.
- Customer Acquisition Cost (CAC). Formula: total marketing and sales spend divided by number of new customers acquired in that period. Blended CAC looks at the whole marketing budget against total new customers, channel-specific CAC breaks it down per source. Both numbers matter, blended CAC for overall business health, channel-specific CAC for deciding where to put the next dollar.
- Customer Lifetime Value (LTV) and the LTV:CAC ratio. LTV estimates total revenue a customer generates over their relationship with the business. The LTV:CAC ratio is one of the most telling health checks a company can run, a ratio under 1:1 means the business loses money on every customer acquired, and a ratio around 3:1 or higher is generally considered healthy, though the right number varies a lot by industry and margin structure.
- Marketing-sourced and marketing-influenced revenue. Sourced revenue tracks deals that started with a marketing touchpoint, influenced revenue tracks deals where marketing played a role somewhere along the way even if it wasn’t the origin. Both numbers matter for proving marketing’s actual contribution, especially in B2B where sales teams sometimes claim full credit for deals marketing nurtured for months.
- Average Order Value (AOV). Particularly relevant for e-commerce. Raising AOV through bundling or upsells can improve revenue without needing to acquire a single new customer, which is often cheaper than chasing acquisition growth.
- Return on Marketing Investment (ROMI). Different from ROAS in scope, ROAS typically measures ad spend specifically, ROMI looks at total marketing investment, including content, tools, salaries, and agency costs, against the revenue generated. It’s a broader and more honest picture of whether the marketing function as a whole is paying for itself.
KPI Quick Reference Table
| Channel | Key KPI | What It Tells You |
|---|---|---|
| SEO | Organic conversion rate | Whether ranking traffic is actually worth anything |
| SEO | Share of voice | How much visibility you own across a topic, not just one keyword |
| Paid Media | ROAS | Revenue generated for every dollar spent on ads |
| Paid Media | Cost per conversion | The real cost of each action, not just each click |
| Content | Content-assisted conversions | Whether content is contributing to deals, even when it isn’t the final touch |
| Content | Content decay | Whether older pages are quietly losing traffic and need a refresh |
| Click-to-open rate | A more reliable engagement signal post-Apple Mail Privacy changes | |
| Revenue per subscriber | Whether the list is actually worth maintaining | |
| Social | Engagement rate (vs. reach) | Real audience interaction, not inflated by a stale follower count |
| Social | Social-driven conversions | Whether social activity turns into actual website action |
| Revenue | CAC | What it costs to acquire one customer, blended or by channel |
| Revenue | LTV:CAC ratio | Whether the business is profitable per customer over time |
| Revenue | ROMI | Whether total marketing investment, not just ad spend, is paying off |
Attribution: Why Most KPI Reporting Is Wrong
Here’s the part most articles on this topic skip entirely, and it’s probably the most important section in the whole piece. Most of the KPIs discussed above get distorted by bad attribution before they ever reach a dashboard.
Last-click attribution gives 100% of the credit for a conversion to the final touchpoint before it happened. Someone sees a brand on Instagram, reads a blog post two weeks later, gets a retargeting ad, then clicks a Google search ad and converts. Last-click attribution says Google Ads gets all the credit. The Instagram post and the blog content that actually built the trust get zero. That’s not just inaccurate, it actively misleads budget decisions, since teams end up pouring more money into the channel that happened to close the deal while starving the channels that opened it.
| Attribution Model | What It Credits | Where It Falls Short |
|---|---|---|
| Last-click | The final touchpoint before conversion | Ignores everything earlier in the journey |
| First-touch | The very first interaction | Ignores everything after the initial discovery |
| Linear | Equal credit across every touchpoint | Treats a casual browse and a deep engagement the same |
| Data-driven | Algorithmically weighted based on actual impact | Requires significant data volume to be reliable |
First-touch attribution flips the problem, giving all the credit to the very first interaction, which overvalues awareness channels and undervalues whatever closed the deal. Linear attribution spreads credit evenly across every touchpoint in the journey, which is more balanced but treats a five-second scroll past an ad the same as a ten-minute read of a detailed blog post, which isn’t really fair either. Data-driven attribution, where available, uses actual conversion data to weight touchpoints based on their real impact, but it needs a decent volume of conversions to work properly, which smaller businesses often don’t have yet.
The practical recommendation here depends on size and budget. Smaller businesses without enough conversion volume for data-driven models are usually better off with a simple linear or position-based model and accepting its imperfections, while larger companies with enough data should push toward data-driven attribution through their ad platforms or analytics tools. Either way, the real takeaway is this, no attribution model is perfect, but using one consistently and understanding its blind spots beats blindly trusting last-click numbers and wondering why the budget allocation never seems to add up.
Building a KPI Dashboard That People Actually Use
A dashboard with forty metrics on it doesn’t get read. It gets glanced at once and ignored forever after. The goal isn’t to show everything, it’s to show what matters.
A good rule of thumb, somewhere around five to seven KPIs on an executive-level dashboard, no more. Anything beyond that and the signal gets buried under noise, and the people who need to make decisions stop opening the dashboard at all.
Cadence matters just as much as content. Weekly reviews work for fast-moving channel-level metrics like ad spend efficiency or email performance, where quick course corrections matter. Monthly reviews suit broader KPIs like lead volume or conversion rate trends. Quarterly reviews fit the bigger-picture numbers, LTV:CAC ratio, overall ROMI, retention trends, things that need more data to mean anything and shouldn’t be reacted to on a weekly basis anyway.
Tooling is worth a quick mention without turning this into a product review. Most teams end up pulling from GA4 for site and conversion data, native reporting inside each ad platform for channel-specific performance, and CRM-level reporting for anything tied to actual pipeline and revenue. The specific tools matter less than making sure the numbers from each source actually agree with each other, which is its own ongoing headache in most marketing teams.
The most common dashboard mistakes are simple but persistent. Mixing leading and lagging indicators on the same view without labeling which is which, so people react to early signals as if they’re confirmed outcomes. And showing raw numbers without any goal or benchmark next to them, a CAC of $120 means nothing on its own, it only becomes useful next to the number it’s being compared against.
Conclusion
Marketing measurement isn’t about collecting every number a platform happens to offer. It’s about figuring out which handful of numbers actually reflect whether the business is moving forward, and having the discipline to ignore the rest, even when the rest looks impressive on a slide.
The framework holds up across pretty much any business, start with the objective, pick the KPI that reflects it, then track the channel-level metrics that explain how you got there. What counted as success at launch won’t be the same thing that counts as success once the business matures, acquisition-focused metrics give way to efficiency and retention metrics as a company grows, and the dashboard should evolve right alongside it. The teams that get this right aren’t the ones with the most data. They’re the ones willing to throw out the numbers that don’t matter and stay focused on the ones that do.
That’s really the whole game. Not more dashboards, not more tracking pixels, just a sharper sense of which numbers deserve your attention this week and which ones are just there to make a Monday meeting feel productive.
Frequently Asked Questions
What’s the difference between a metric and a KPI?
A metric is anything you can measure: page views, likes, time on site. A KPI is a metric that’s been deliberately chosen because it ties back to a real business outcome and someone is actually accountable for moving it. Every KPI is a metric, but most metrics never earn the right to be called a KPI.
How many KPIs should a business actually track?
For an executive-level view, five to seven is the sweet spot. Channel teams can track more underneath that, the SEO team watching keyword movement, the paid team watching CPC, but the top-level dashboard that leadership actually opens needs to stay lean or it stops getting used.
Why does last-click attribution give the wrong picture?
Because it hands 100% of the credit to whatever channel happened to be touched right before a conversion, even if four other touchpoints did the work of building trust earlier in the journey. A blog post that warmed someone up three weeks ago gets zero credit while the branded search ad that closed the deal gets all of it. That’s not accuracy, that’s just convenience.
Is follower count a KPI?
Not really, no. It can be inflated, bought, or padded with inactive accounts, and it correlates poorly with anything the business actually needs, revenue, leads, retention. Engagement rate and social-driven conversions tell a far more honest story than a follower count ever will.
What’s a “good” LTV:CAC ratio?
A ratio around 3:1 is generally treated as healthy, meaning a customer is worth roughly three times what it cost to acquire them. Anything close to or under 1:1 means the business is losing money on every customer it brings in, which is a serious red flag regardless of how good other metrics look.
Should a small business with limited traffic use data-driven attribution?
Probably not yet. Data-driven models need a decent volume of conversions to produce reliable weighting. Smaller businesses are usually better off with a simple linear or position-based model until conversion volume grows enough to make a data-driven model worth the switch.
How often should KPIs be reviewed?
It depends on the metric. Fast-moving channel numbers like ad spend efficiency or email performance are worth a weekly look. Broader KPIs like lead volume or conversion rate fit a monthly cadence. Big-picture numbers like LTV:CAC or overall ROMI need more data to mean anything, so quarterly reviews make more sense there.