

Search “what is a good ROAS” and you’ll get the same answer forty times over. Some version of “4:1 is good.” Then the same article spends the next eight paragraphs quietly walking that number back, because honestly, it’s not true for most businesses reading it.
Here’s the problem with that flat number. A business running on thin margins can hit 4:1 and still be losing money once you account for everything else eating into that revenue. Meanwhile a business with fat margins could be sitting on 2:1 and printing cash. Same ratio, same headline number, completely different outcome, because the number alone tells you nothing without knowing what’s behind it. Nobody sat down and worked out where that “4:1” figure came from, they just repeated it because it sounded authoritative and it’s the number everyone else was already repeating too.
So this guide isn’t going to hand you a benchmark and call it a day. It’s going to walk through what ROAS actually measures, why the “good” number changes so much depending on who’s asking, how to find your own break-even point, where ROAS and ROI get confused, and the tracking mistakes that quietly make your number look better or worse than it actually is. By the end, you should be able to run your own math instead of borrowing someone else’s benchmark.
A good ROAS isn’t a number you copy from a blog post. It’s a number you calculate from your own margins.
What ROAS Actually Means

Before getting into whether a number is good or bad, get clear on what it’s actually measuring, because a lot of the confusion downstream starts right here.
ROAS stands for Return on Ad Spend. In plain terms, it tells you how much revenue came back for every dollar you put into ads. That’s it. Nothing about profit, nothing about overhead, just revenue against ad cost.
The formula is simple: revenue from ads divided by cost of ads.
You’ll see this number expressed two ways, and they mean the exact same thing. As a ratio, like 4:1, or as a percentage, like 400%. If someone tells you their ROAS is 400%, that’s the same as saying 4:1. Don’t let the format throw you.
Here’s a clean example. Spend $1,000 on ads, and that campaign generates $3,000 in revenue. Divide $3,000 by $1,000, and you get 3. That’s a 3:1 ROAS, or 300%. For every dollar spent, three dollars came back in revenue.
| Ad Spend | Ad Revenue | ROAS (Ratio) | ROAS (%) | What It Means |
|---|---|---|---|---|
| $1,000 | $1,000 | 1:1 | 100% | Break-even, no profit or loss |
| $1,000 | $3,000 | 3:1 | 300% | $3 earned for every $1 spent |
| $1,000 | $500 | 0.5:1 | 50% | Losing money on ad spend |
That third row matters more than people give it credit for. A ROAS under 1:1 means the ad spend itself isn’t even coming back, forget profit entirely. That’s the floor. Everything above it is where the real question starts.
Notice what’s missing from this definition too, because it’s just as important as what’s included. Nothing about product cost. Nothing about shipping, fees, or overhead. ROAS is a media efficiency metric, full stop. It answers exactly one question: how efficiently did this specific ad spend turn into revenue. It was never designed to answer “is my business profitable,” and treating it like it does is where most of the confusion in this whole topic actually starts. Hold onto that distinction, because it comes back hard a few sections from now.
So, What Is a “Good” ROAS?
Alright, let’s actually answer the question in the title, then immediately complicate it, because that’s honestly the more useful part.
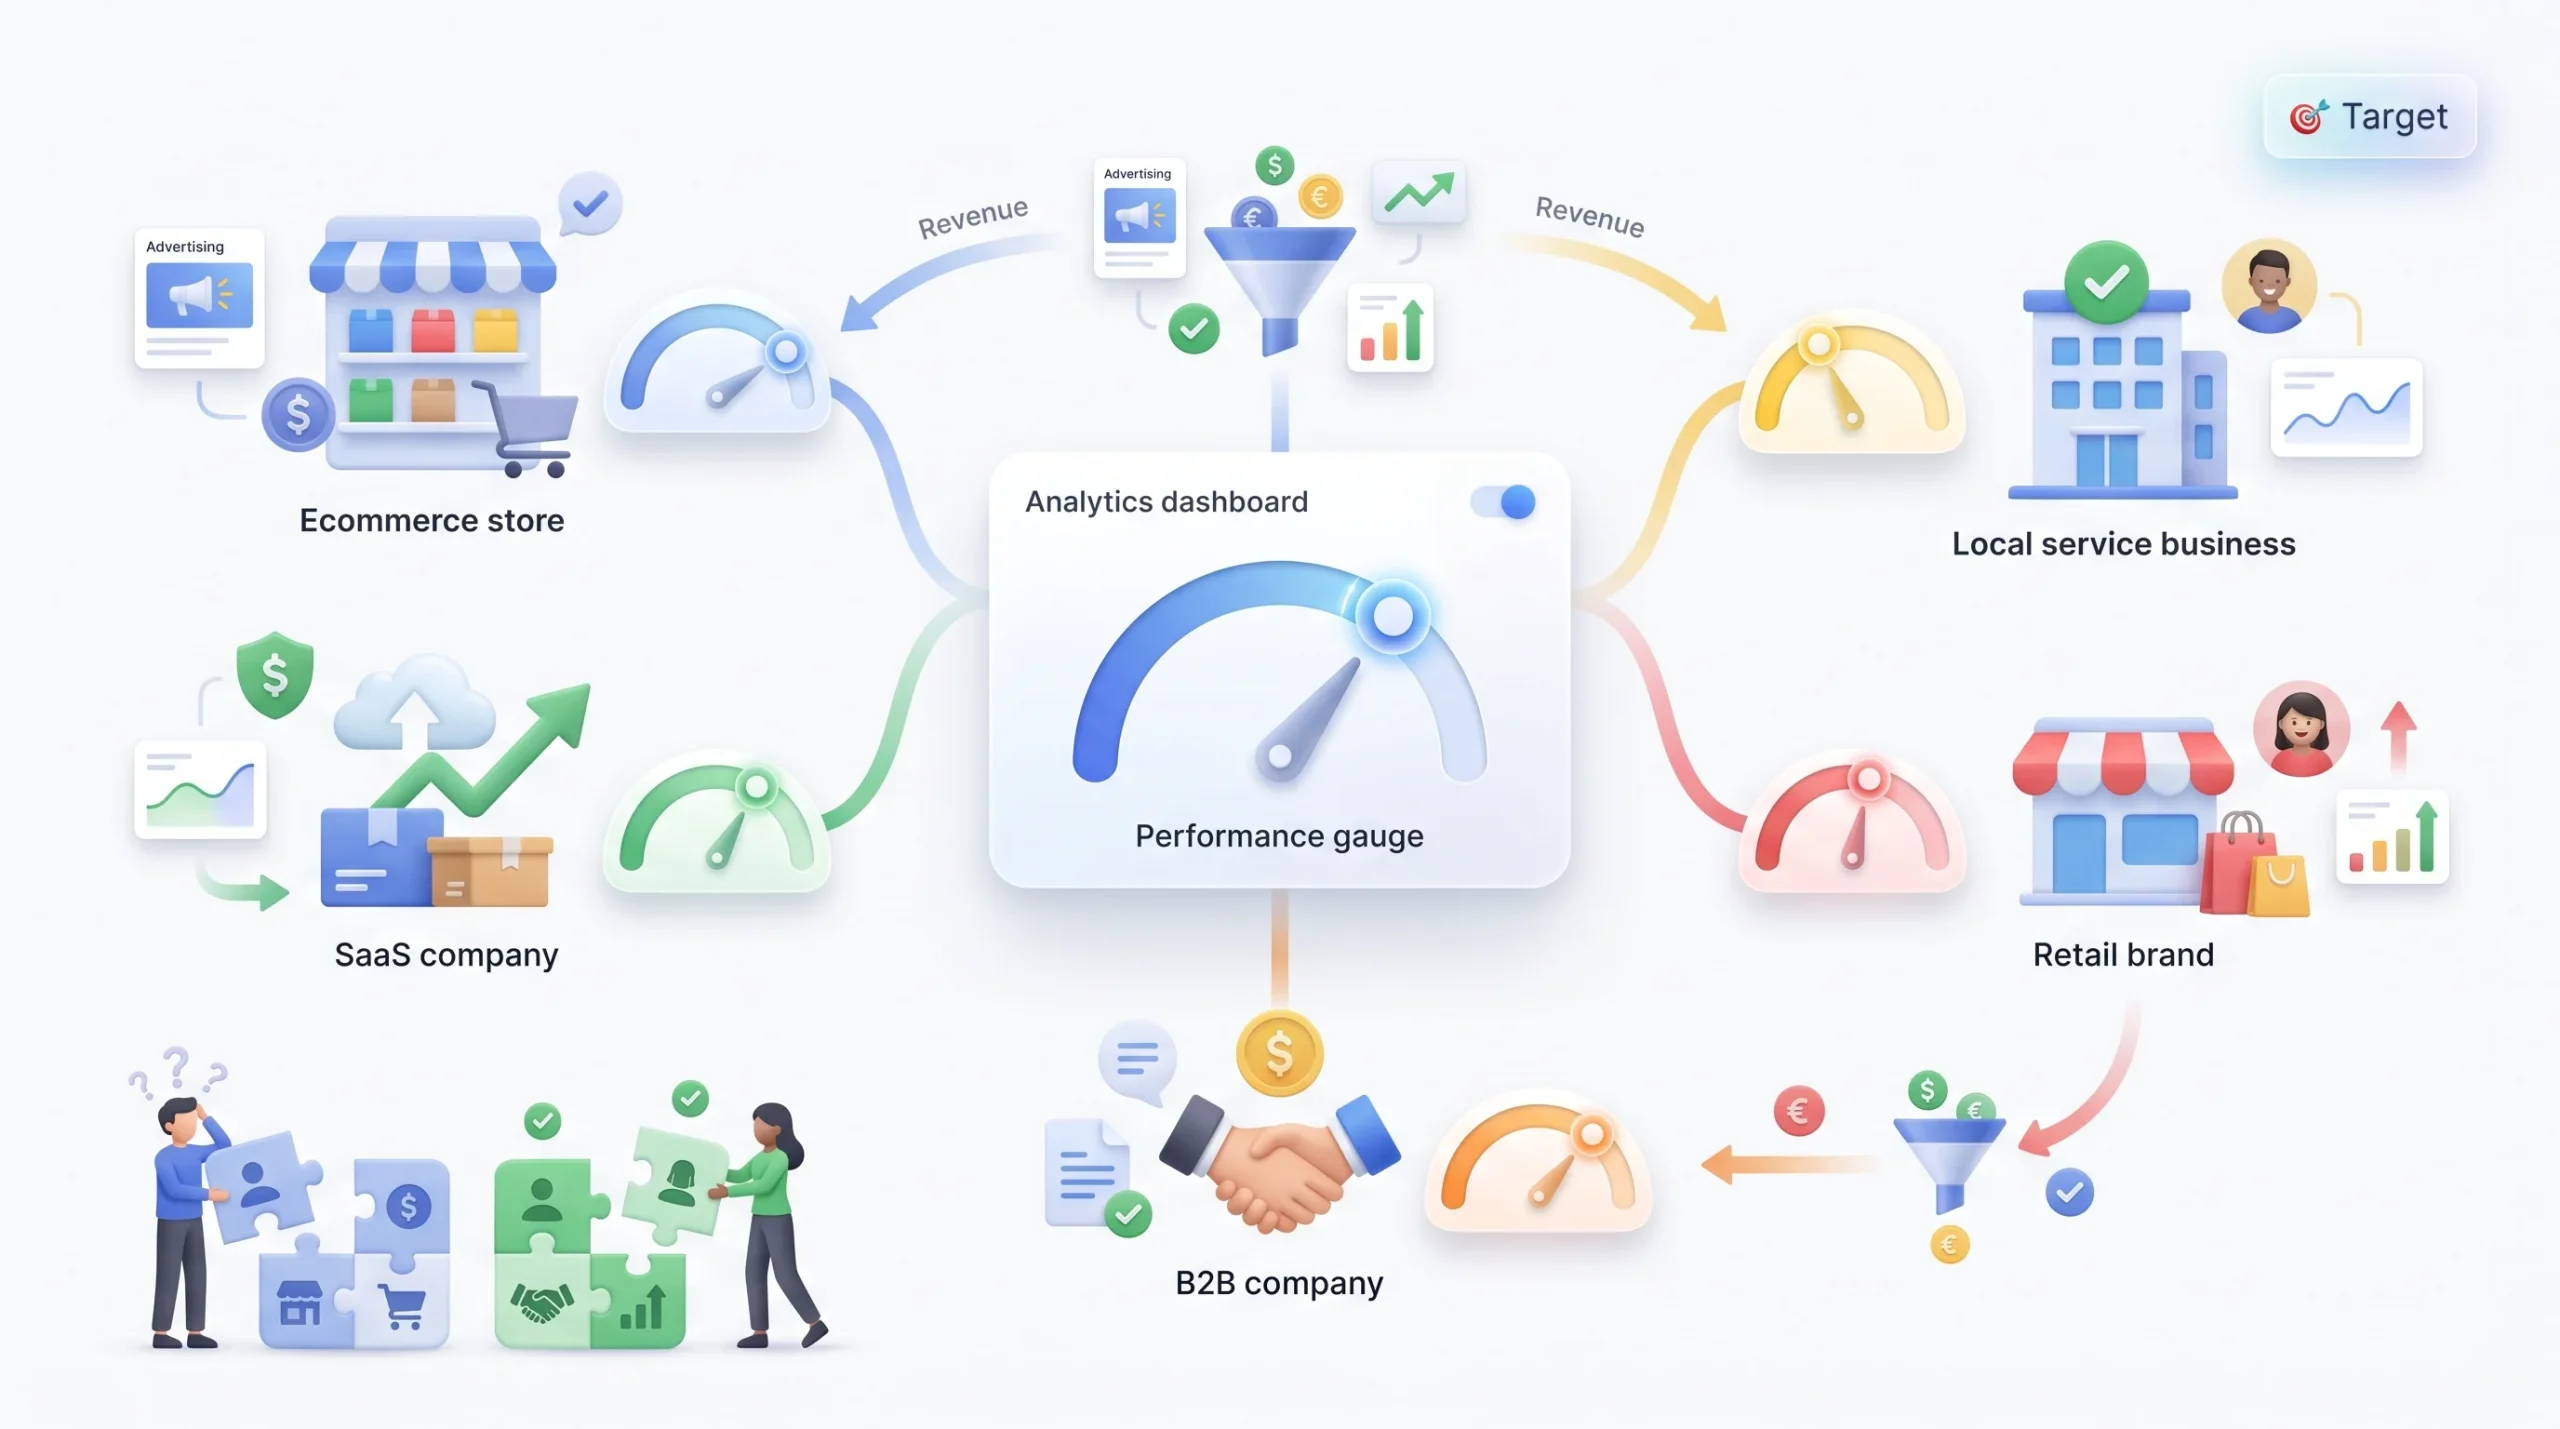
The commonly cited range floating around out there is somewhere between 2:1 and 4:1, with 4:1 getting mentioned a lot as a strong target. You’ll see that number everywhere. It’s not wrong exactly, it’s just incomplete.
Here’s the thing. That range comes from averaging across a huge pile of businesses with wildly different cost structures. A high-margin skincare brand and a low-margin electronics retailer both get lumped into the same “2 to 4 is good” advice, and that’s like using a stranger’s shoe size to go buy your own shoes. Might fit, probably won’t.
So what’s the real answer? A good ROAS is whatever number sits comfortably above your break-even ROAS, the point where the campaign actually starts putting money in your pocket instead of just covering itself. That number is different for every business, and finding it takes about five minutes of math, which is exactly what the next section walks through.
Every “good ROAS” number floating around online is an average of businesses that aren’t yours.
Break-Even ROAS: The Number That Actually Matters

This is the section that actually answers the question everyone’s really asking, even if they don’t phrase it this way. Not “what’s a good ROAS in general,” but “what ROAS do I personally need to not be losing money.”
Break-even ROAS is exactly what it sounds like. It’s the point where your ad revenue exactly covers your ad costs, no profit, no loss. Below that number, you’re losing money on every sale the ad generates. Above it, you’re actually making something.
The formula: break-even ROAS equals 1 divided by your profit margin.
Let’s run real numbers. Say a business has a 25% profit margin. That means for every dollar of revenue, 25 cents is actual profit and 75 cents goes toward the cost of the product, shipping, all of it. Plug that into the formula: 1 divided by 0.25 equals 4. So this business needs a 4:1 ROAS just to break even. Not to be profitable. Just to break even.
Now flip it. Take a business with a 50% margin instead. 1 divided by 0.50 equals 2. This business only needs a 2:1 ROAS to hit that same break-even point.
See what just happened? Both businesses could report the exact same “4:1 is good” headline number, and one of them is barely surviving while the other is sitting on a mountain of extra profit that the first business would kill for. Same ratio, completely different reality, and margin is the entire reason why.
| Profit Margin | Break-Even ROAS Formula | Break-Even ROAS |
|---|---|---|
| 10% | 1 ÷ 0.10 | 10:1 |
| 20% | 1 ÷ 0.20 | 5:1 |
| 25% | 1 ÷ 0.25 | 4:1 |
| 50% | 1 ÷ 0.50 | 2:1 |
| 70% | 1 ÷ 0.70 | 1.43:1 |
Look at that top row for a second. A business running a 10% margin needs a 10:1 ROAS just to break even. That’s not a typo. That’s just what thin margins demand. If that business ever reads “4:1 is a good ROAS” and celebrates hitting it, they’re actually celebrating a loss.
A 4:1 ROAS isn’t good or bad on its own. It’s just a number. Your margin is what decides which one it is.
The “Shallow ROAS” Trap: Why a Good-Looking Number Can Still Be a Loss

Here’s something most articles mention in a single sentence and then rush past. It deserves way more attention than that, because it’s the reason smart people scale campaigns straight into a loss while staring at a number that looks fantastic.
Shallow ROAS is when the calculation only accounts for ad spend and ad revenue, and completely ignores everything else that eats into that revenue before it becomes actual profit. And there’s a lot that gets left out. Cost of goods sold. Shipping. Payment processing fees. Platform or marketplace fees. Returns. Any labor or agency cost tied to actually running the campaign.
Let’s walk through it with real numbers, because seeing this on paper is a lot more convincing than just being told it happens.
Say a campaign spends $1,000 and generates $3,000 in revenue. That’s a 3:1 ROAS. Looks solid. Most people would call that a win and move on.
But now subtract cost of goods sold. Say this product runs at 80% COGS, which isn’t unusual for a lot of physical products once you factor in materials, manufacturing, and fulfillment. That’s $2,400 eaten up right there. $3,000 minus $2,400 leaves $600.
That $600 is what’s left to cover the ad spend. But the ad spend was $1,000. So $600 minus $1,000 lands at negative $400.
| Line Item | Amount |
|---|---|
| Ad Spend | $1,000 |
| Ad Revenue (3:1 ROAS) | $3,000 |
| Cost of Goods Sold (80% of revenue) | $2,400 |
| Remaining After COGS | $600 |
| Ad Spend Already Accounted For | $1,000 |
| Net Result | -$400 (a loss) |
A 3:1 ROAS. And it lost $400. That’s not a hypothetical edge case, that’s just what happens when margins are thin and nobody bothers to check what’s actually left over after the product itself gets paid for.
A “good” ROAS can still lose you money. ROAS measures media efficiency, not profit. Confuse the two and you’ll scale a losing campaign, and scale it fast, because the number on the dashboard keeps telling you everything’s fine.
ROAS vs. ROI: What’s the Actual Difference
This trips up beginners constantly, and honestly, a lot of experienced marketers get sloppy with it too. Worth slowing down and actually separating these two.
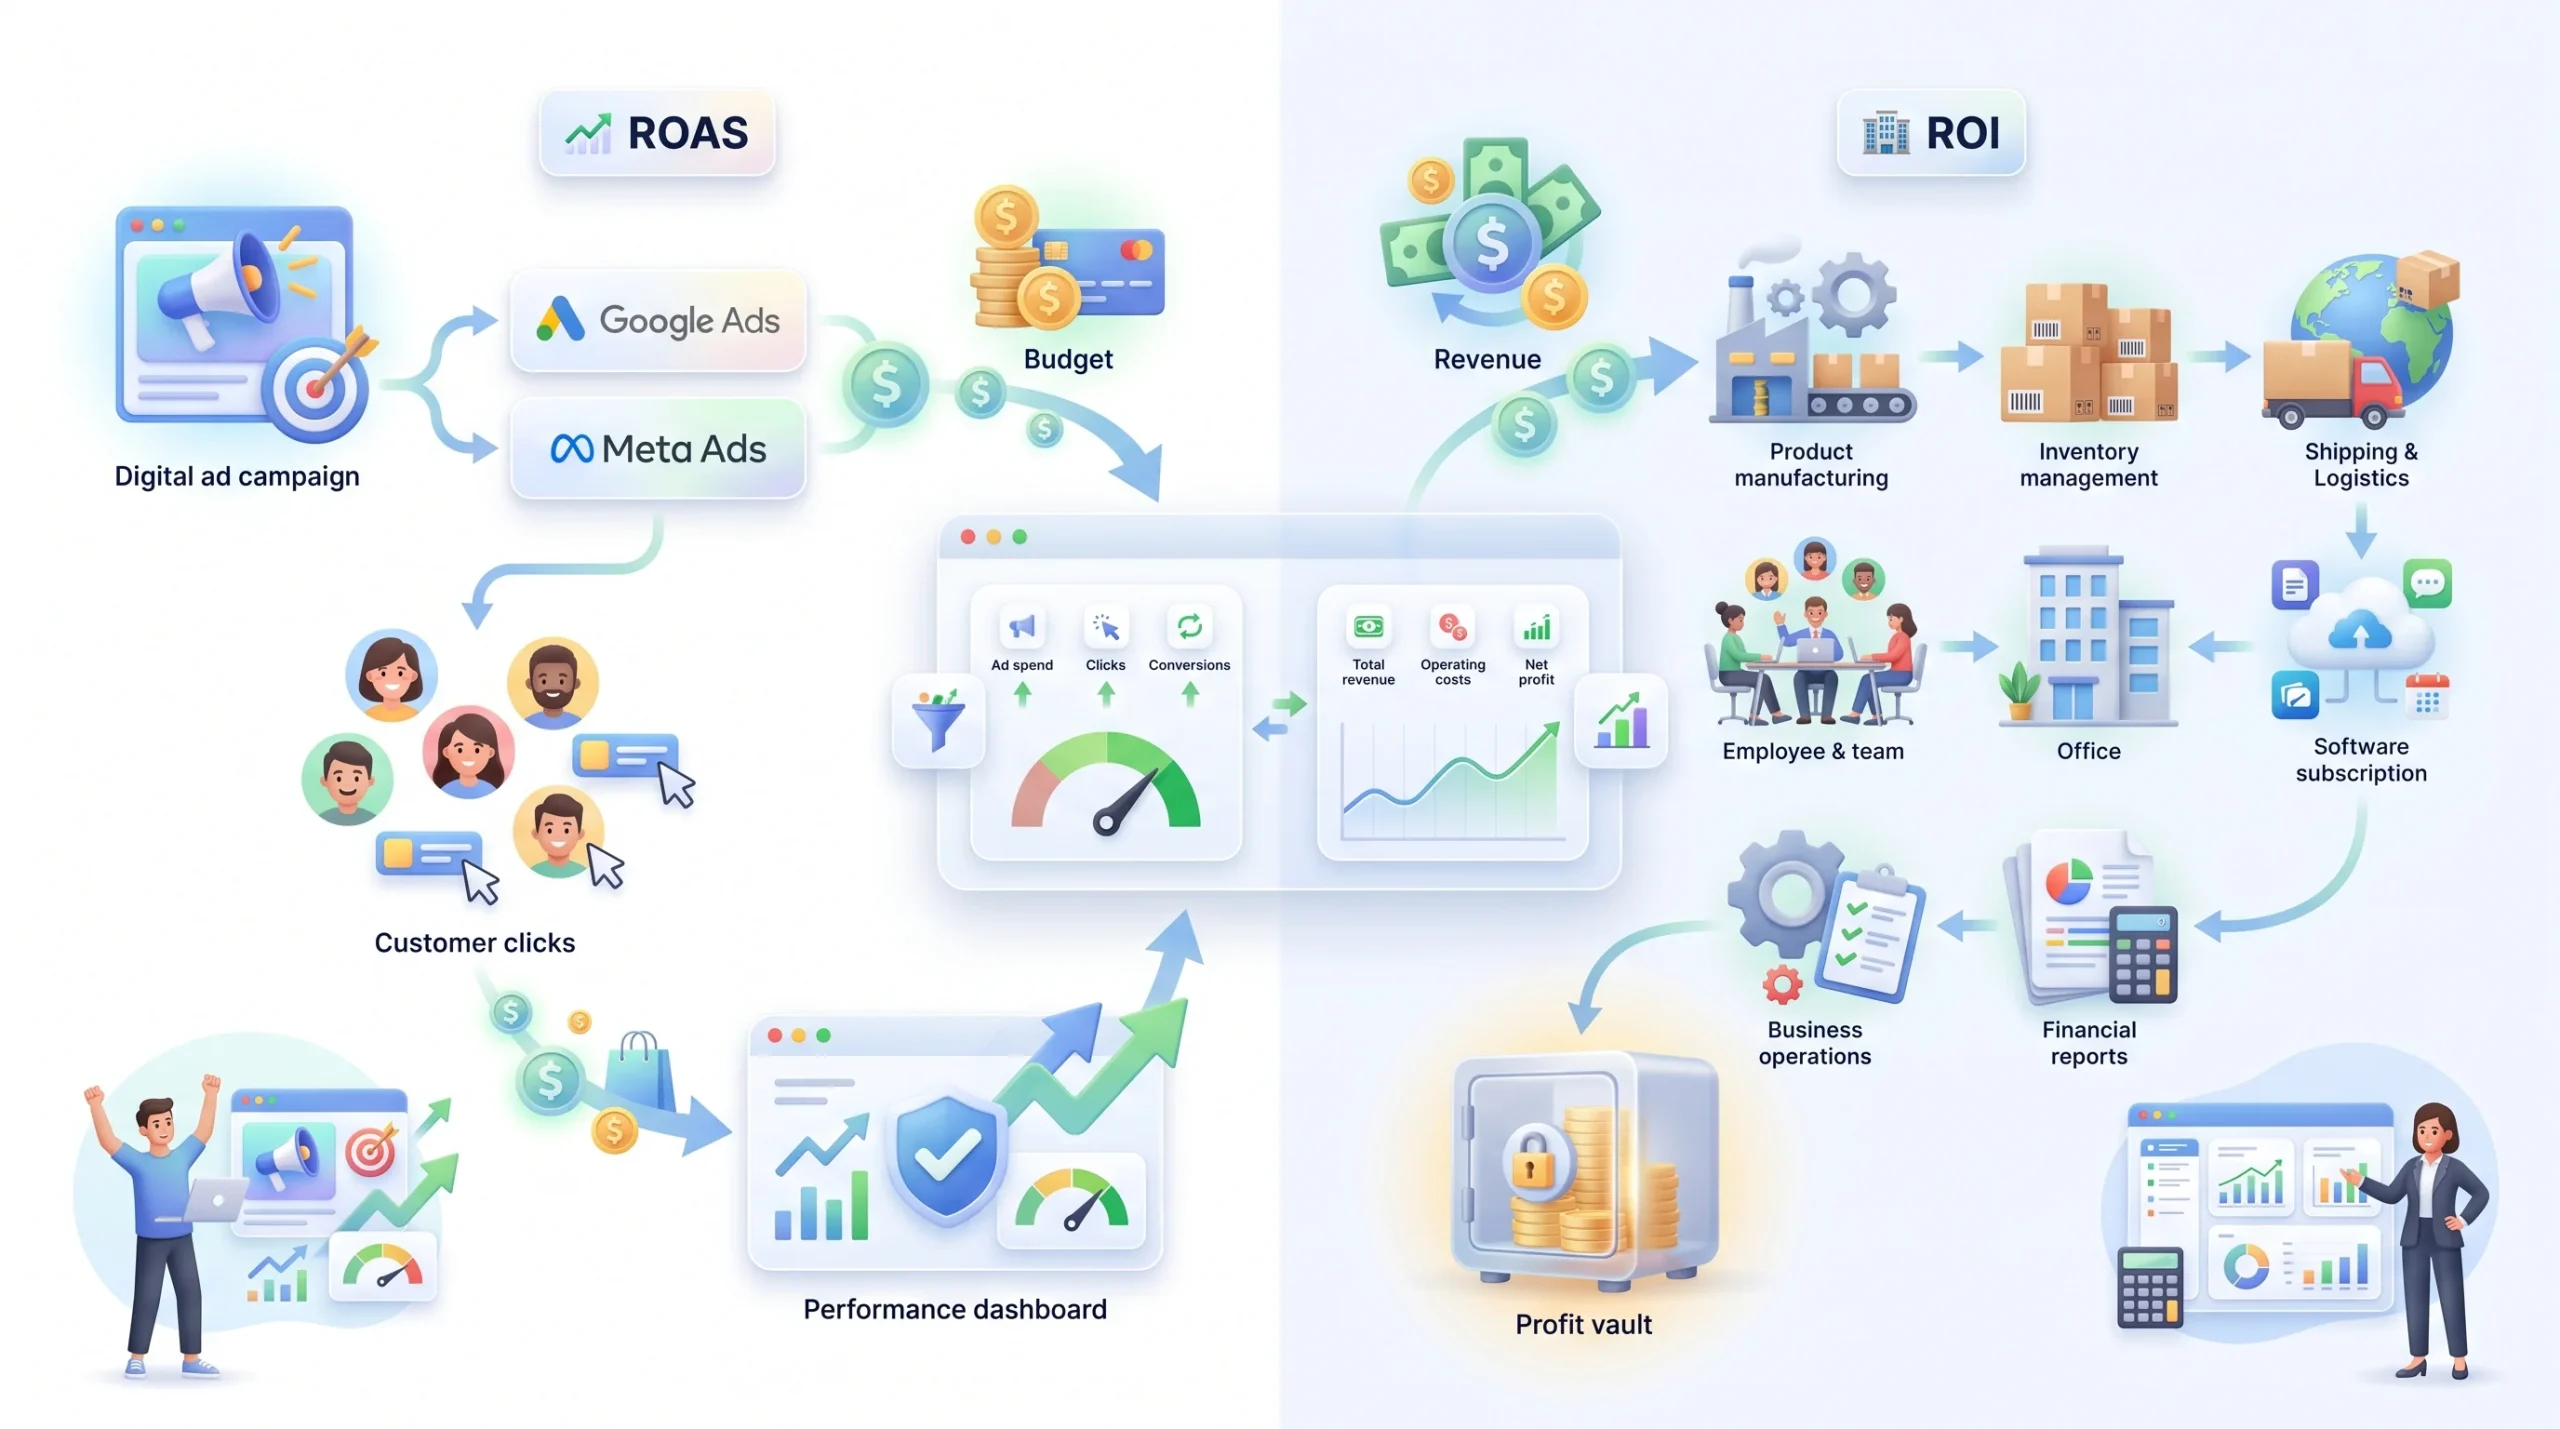
ROAS looks at one thing and one thing only. Ad spend versus the revenue that specific ad spend generated. That’s the whole scope.
ROI looks at the bigger picture. Net profit against every cost involved in running the business, not just the ads. Product costs, salaries, rent, software, all of it factors in.
Here’s why that gap matters in practice. A campaign can post a genuinely strong ROAS, say 4:1, while the business as a whole has a negative ROI, because overall overhead and margins are thin enough that the ad efficiency doesn’t translate into actual company-wide profit. You just watched exactly this happen in the shallow ROAS example above.
So when should each one get used? ROAS is the better tool when comparing campaigns against each other, since it strips out everything but ad efficiency and gives you a clean apples-to-apples read. ROI is the better tool for answering the bigger question: is this marketing effort actually helping the business, once everything is accounted for.
| Factor | ROAS | ROI |
|---|---|---|
| What it measures | Revenue vs. ad spend only | Net profit vs. all costs |
| Best used for | Comparing campaigns to each other | Judging overall business profitability |
| Includes overhead/COGS? | No | Yes |
| Can be “good” while the business loses money? | Yes | No, by definition |
That last row is the one worth remembering.
ROAS can lie to you by omission. ROI can’t, because it’s built to include the stuff ROAS leaves out.
How to Calculate ROAS (Step-by-Step)
The math itself is simple. Where people mess this up isn’t the formula, it’s the inputs going into it. Here’s the actual sequence to follow.
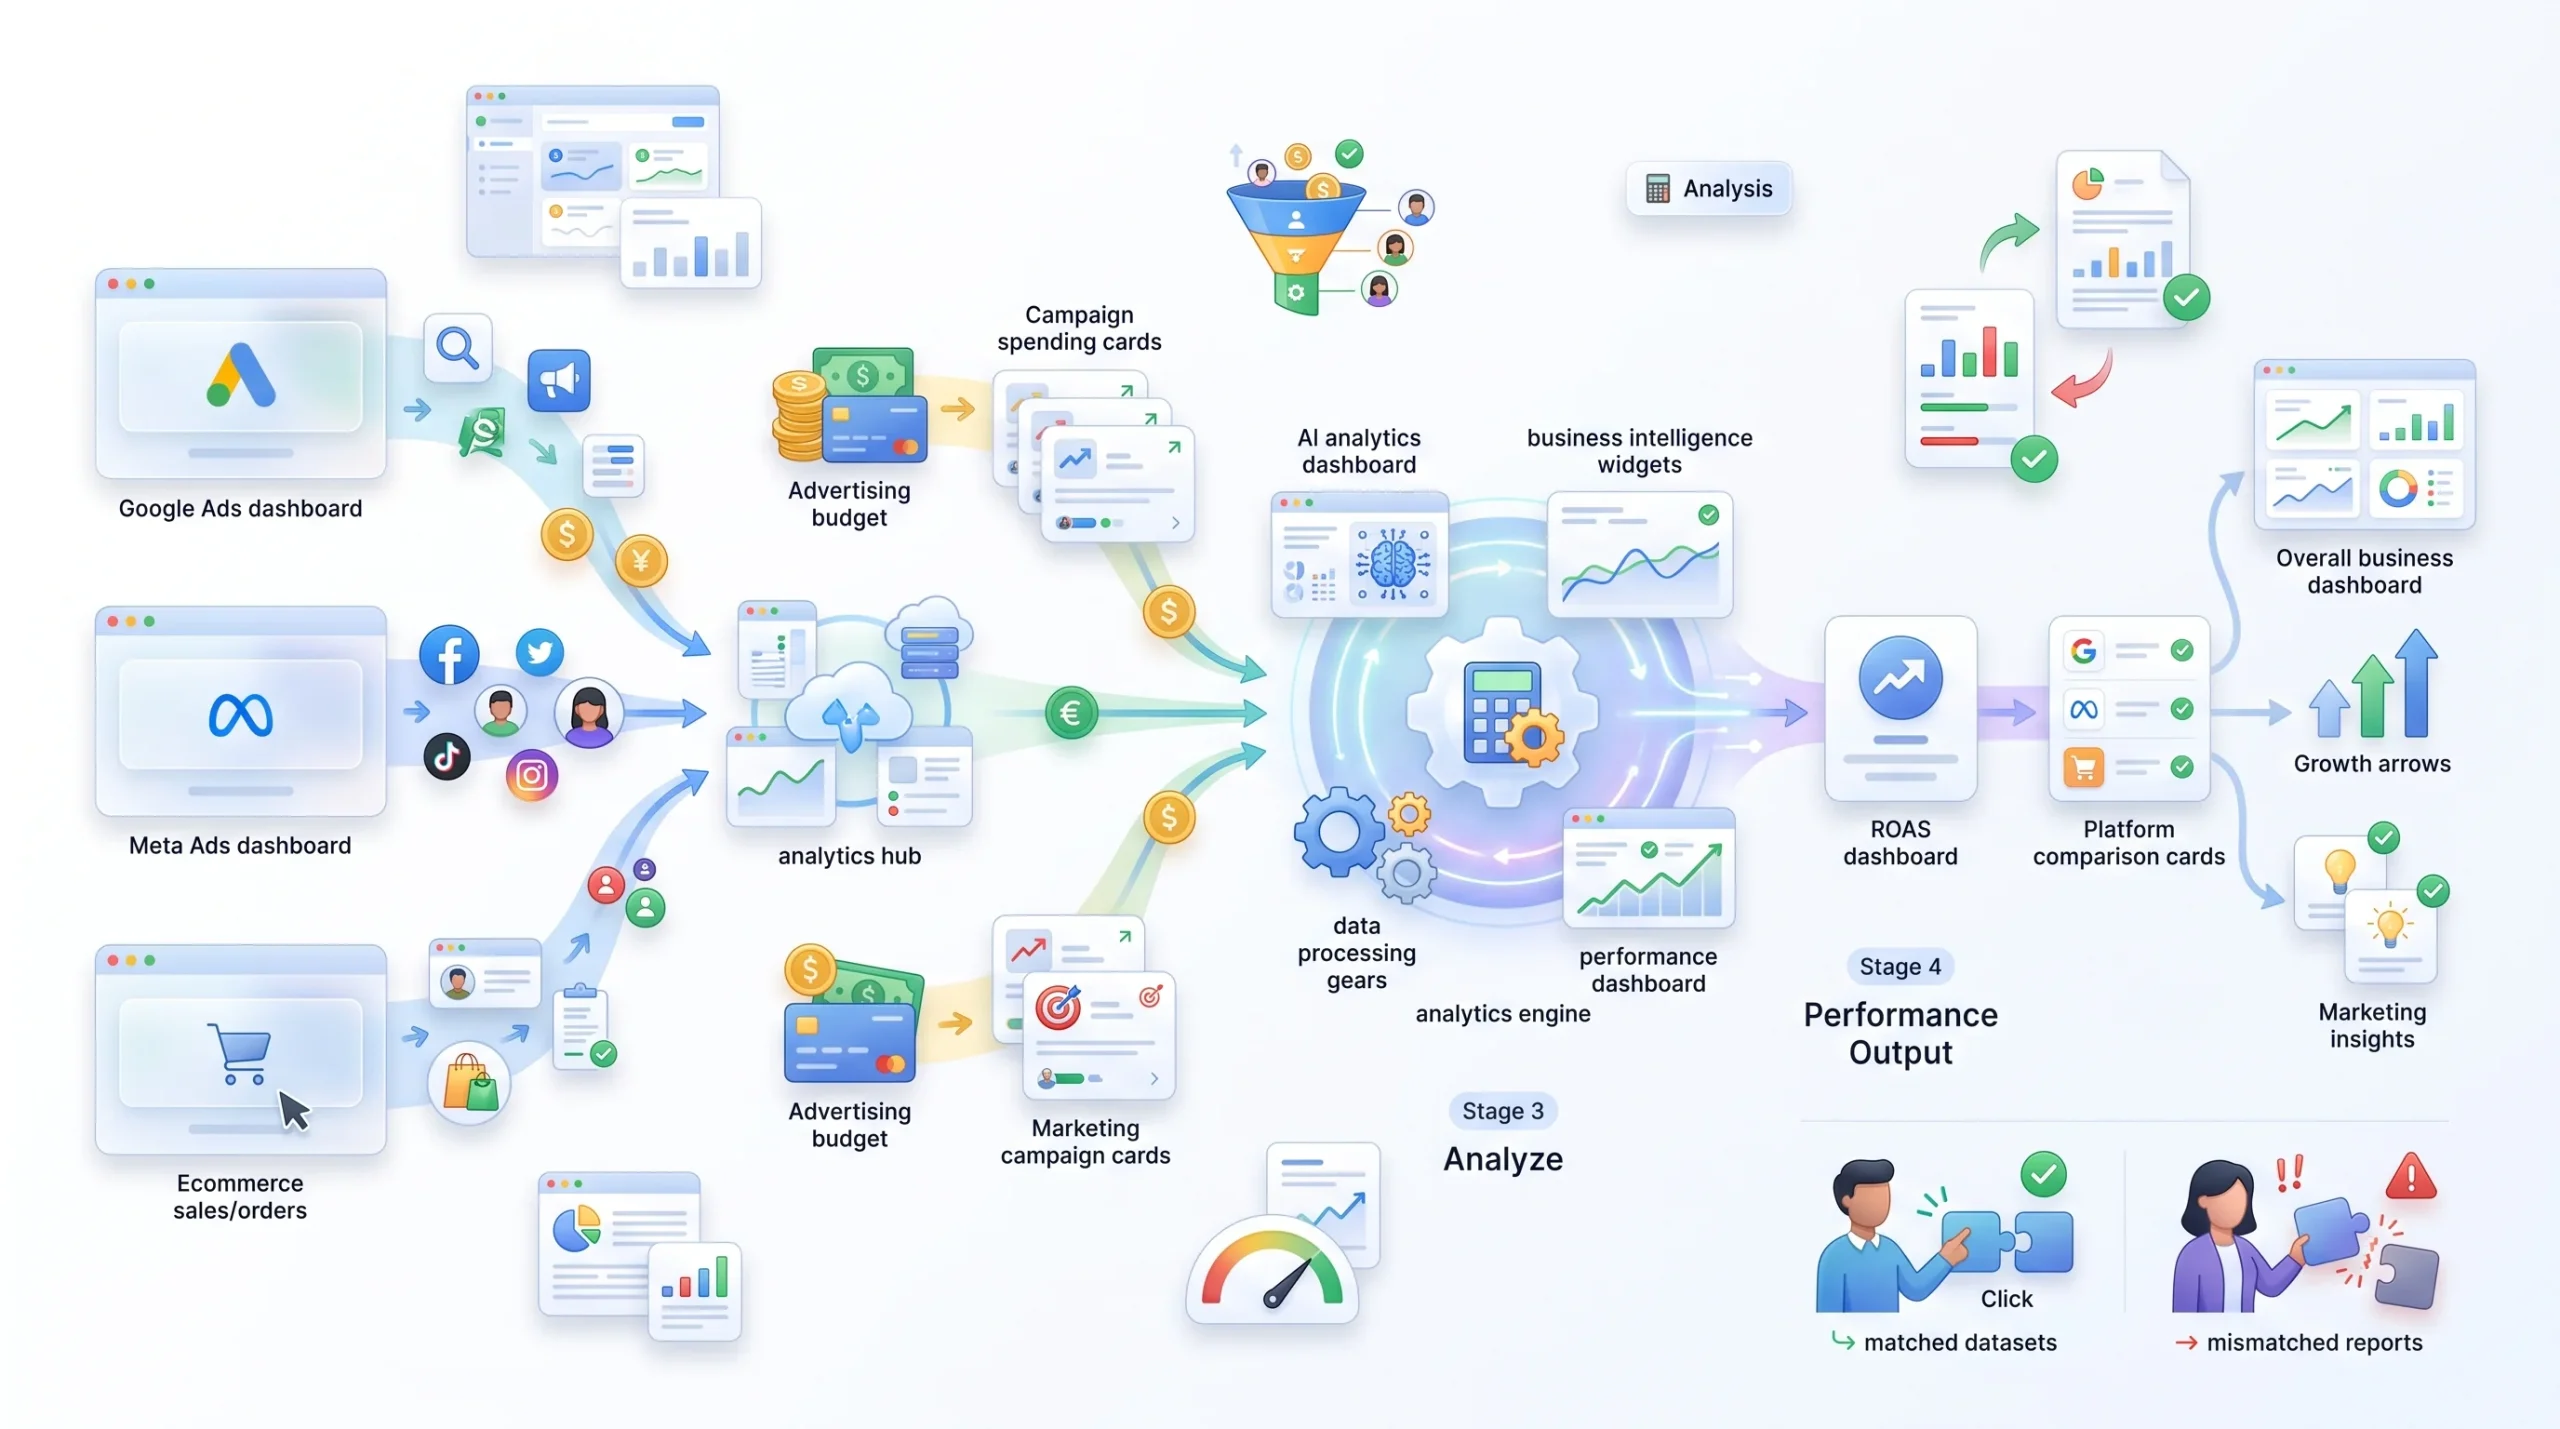
Step 1: Pull total ad revenue for the period you’re measuring. Pick a clear, defined window, a week, a month, whatever makes sense for the campaign, and pull the revenue attributed to ads for exactly that window. Not a rough estimate. The actual number from your attribution source.
Step 2: Pull total ad cost for that exact same period. Same window, no exceptions. This is where a lot of beginner ROAS numbers go sideways, more on that in a second.
Step 3: Divide ad revenue by ad cost. Straightforward division. Revenue on top, cost on the bottom.
Step 4: Convert to a percentage if you want it in that format. Multiply the result by 100. A ROAS of 3 becomes 300%.
Step 5: Repeat this per campaign, per platform, and blended across everything. Don’t just calculate one number and call it done. Per-campaign ROAS tells you which specific campaign is working. Per-platform ROAS tells you how Meta is doing against Google. Blended ROAS tells you the overall picture across everything running at once. Each view answers a different question.
Watch out for one specific mistake here, because it happens constantly. Pulling revenue from a 30-day window and cost from a 7-day window, or any mismatch like that, produces a number that looks real but means absolutely nothing. It’s not that the math is wrong, it’s that you fed it two different timeframes and asked it to make sense of the mismatch. Always double check that the date ranges on both sides actually line up before trusting the result.
Worth doing this calculation manually at least once, even if a dashboard is already showing you the number automatically. Pulling the raw revenue and cost figures yourself, running the division by hand, and comparing it against what the platform reports forces a real check on whether the automated number is actually trustworthy. A lot of people go months trusting a dashboard figure they’ve never once verified against their own bank statements, and that’s exactly how a shallow or misattributed ROAS number ends up driving real budget decisions.
Why ROAS Benchmarks Vary So Much by Industry and Platform
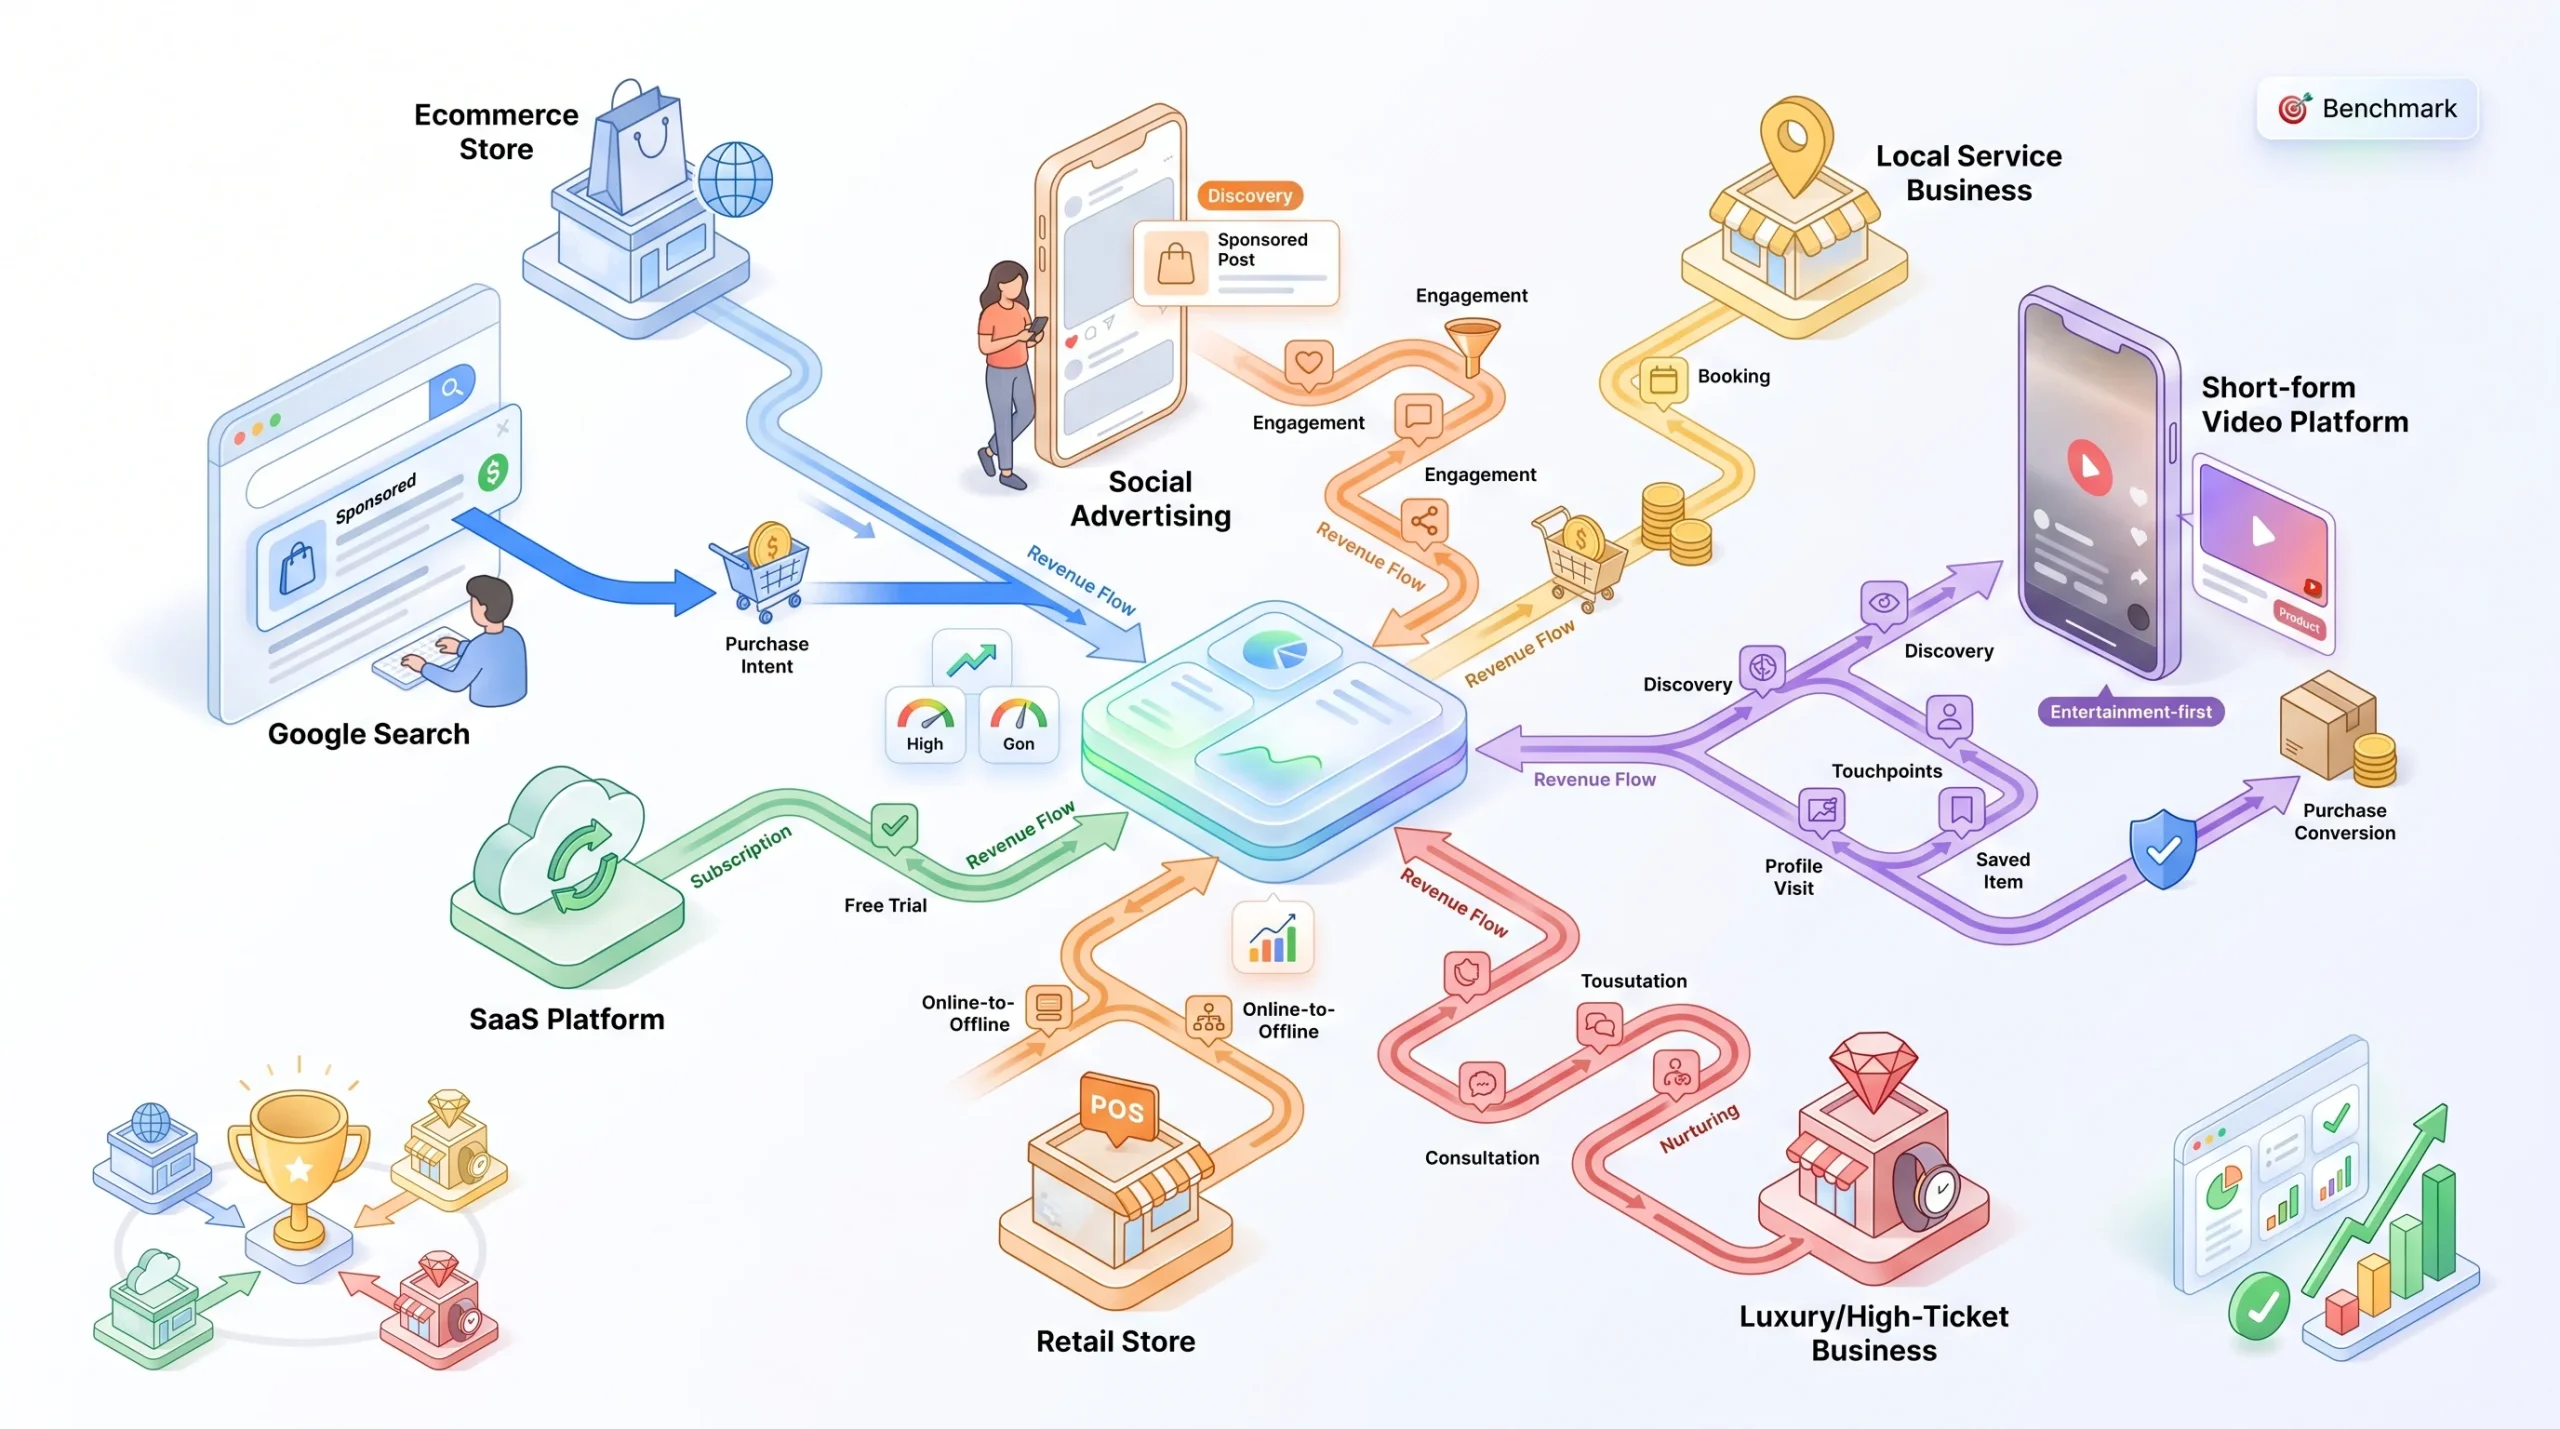
Here’s where those benchmark tables you’ve probably seen floating around actually earn their place, paired with an explanation of why the numbers differ instead of just handing you a chart and walking away.
Three things really drive the variation. Profit margin, average order value, and how long the typical sales cycle runs.
Margin’s effect is the one already covered above. High-margin categories can profitably accept a lower ROAS and still come out ahead. Low-margin categories need a much higher ROAS just to break even, forget profit.
Platform differences come down to intent at the exact moment someone sees the ad. Search platforms like Google Ads often see stronger returns because someone typing a search query is usually already looking for something specific, they’re closer to buying. Social platforms like Meta or TikTok are more discovery-driven. Someone’s scrolling, not searching, so the ad has to create demand rather than just capture it. That difference in intent shows up directly in the numbers.
Sales cycle length matters too. Businesses with long consideration periods, think financial services or B2B software, often show lower ROAS inside a short tracking window, not because the campaign is weak, but because a lot of the actual value shows up weeks or months later, outside whatever window is being measured.
| Platform | Commonly Cited Range | Why It Differs |
|---|---|---|
| Google Ads (Search) | Often cited around 2:1 to 4:1, with 4:1+ considered strong | Higher purchase intent at the moment of the click |
| Meta Ads (Facebook/Instagram) | Often cited around 2:1 to 4:1 | Mixed intent, more discovery-driven, retargeting performs better than cold traffic |
| TikTok Ads | Often cited lower on average across industries | Younger platform, more discovery and awareness-driven behavior |
These are general reference points pulled from broad industry reporting, not fixed targets, and honestly, they shift constantly as platforms change their algorithms and consumer behavior moves around. Don’t anchor a business plan to any single number in that table. Anchor it to the break-even ROAS covered earlier, since that’s the one number in this entire guide that’s actually calculated from your own business instead of borrowed from someone else’s average.
Worth walking through why the same business can see genuinely different numbers on different platforms, because it’s not random. Picture a mid-size apparel brand running both Google Search ads and Meta ads at the same time, same products, same time period. On Google, someone searching “women’s running jacket” already knows what they want, they’re comparing options and close to buying, so that click tends to convert at a higher rate. On Meta, someone scrolling their feed wasn’t looking for a running jacket at all, the ad has to stop the scroll and create interest from nothing. Both channels can work well, but they’re doing fundamentally different jobs, and expecting identical ROAS from both is expecting a cold-call to convert as well as an inbound lead.
Category also plays a bigger role than people give it credit for. A business selling a $40 impulse-buy product and a business selling a $2,000 considered purchase are going to see wildly different ROAS patterns even on the exact same platform, because the buying decision itself moves at a completely different speed. The $40 product might convert same-day off a single ad exposure. The $2,000 product might take three weeks, five touchpoints, and a comparison against two competitors before anyone pulls out a card. Judging both of those campaigns against the same weekly ROAS benchmark misses what’s actually happening in each buyer’s head.
Benchmarks tell you what other businesses are doing. They don’t tell you what your business needs.
Attribution: Why the ROAS Number You’re Looking At Might Be Wrong

This one rarely gets explained clearly anywhere, and it quietly distorts a huge number of ROAS calculations without anyone noticing.
Attribution is just the model deciding which ad gets credit for a sale when a customer interacts with more than one touchpoint before actually buying. And most customers do interact with more than one touchpoint, even for a fairly simple purchase.
The default on most platforms is last-click attribution. Whichever ad someone clicked right before converting gets 100% of the credit. Everything that happened earlier in the journey gets zero, even if it played a real role.
Here’s a scenario that plays out constantly. Someone sees a Facebook ad for a product. They don’t buy right away, they keep scrolling. A few days later, they remember the brand, search for it directly on Google, click a search ad, and buy. Under last-click attribution, Google gets 100% of the credit for that sale. Facebook gets nothing, even though the Facebook ad is very likely what put the brand in this person’s head in the first place.
That’s why platform-reported ROAS numbers so often disagree with each other, and with a business’s actual sales data. Meta’s dashboard and Google’s dashboard are each measuring the world through their own attribution model, and each one tends to over-credit itself for a given sale. Add up every platform’s self-reported ROAS and you’ll frequently get a number that’s higher than what actually happened across the business as a whole.
There’s an alternative worth knowing about, called multi-touch attribution, which spreads credit across multiple touchpoints instead of dumping it all on the last click. Some models split credit evenly across every touchpoint in the journey. Others weight it, giving more credit to the touchpoints closer to the actual sale under something called time-decay, or giving extra weight to the very first touchpoint that introduced the customer to the brand in the first place. None of these are perfect, they’re all just different ways of guessing at something genuinely hard to measure with total accuracy. But they’re a more honest guess than handing 100% of the credit to whichever ad happened to be clicked last.
Setting up multi-touch attribution properly is more complicated, so it’s not something every beginner needs to implement on day one. But knowing it exists, and knowing why last-click can quietly mislead, is enough to make anyone a little more skeptical of a dashboard number that looks suspiciously perfect.
Here’s a second scenario worth sitting with, because the first one undersold how tangled this can actually get. Someone follows a brand on Instagram after seeing an organic post from a friend. A week later they see a Meta ad, click it, browse the site, and leave without buying. Three days after that, they see a Google display ad for the same brand while reading an unrelated article, don’t click it, but it jogs their memory. Later that evening they type the brand name directly into Google, click the organic listing or a branded search ad, and finally buy. Under last-click attribution, whichever channel captured that final branded search gets full credit. The Meta ad that actually drove the first real site visit gets nothing. The display ad that reminded them the brand existed gets nothing. Even the original organic Instagram post, the thing that started the whole chain, gets nothing, because attribution models built around ad clicks don’t even have a way to credit that touchpoint. The sale looks like a clean, cheap win for whichever channel closed it, when in reality it took a longer, messier path to get there.
Strategy tip: before cutting budget on a channel that “looks” weak, check whether it shows up early in the customer journey rather than at the close. A channel with a mediocre last-click ROAS might be the one starting most of your sales, not ending them.
How to Improve Your ROAS
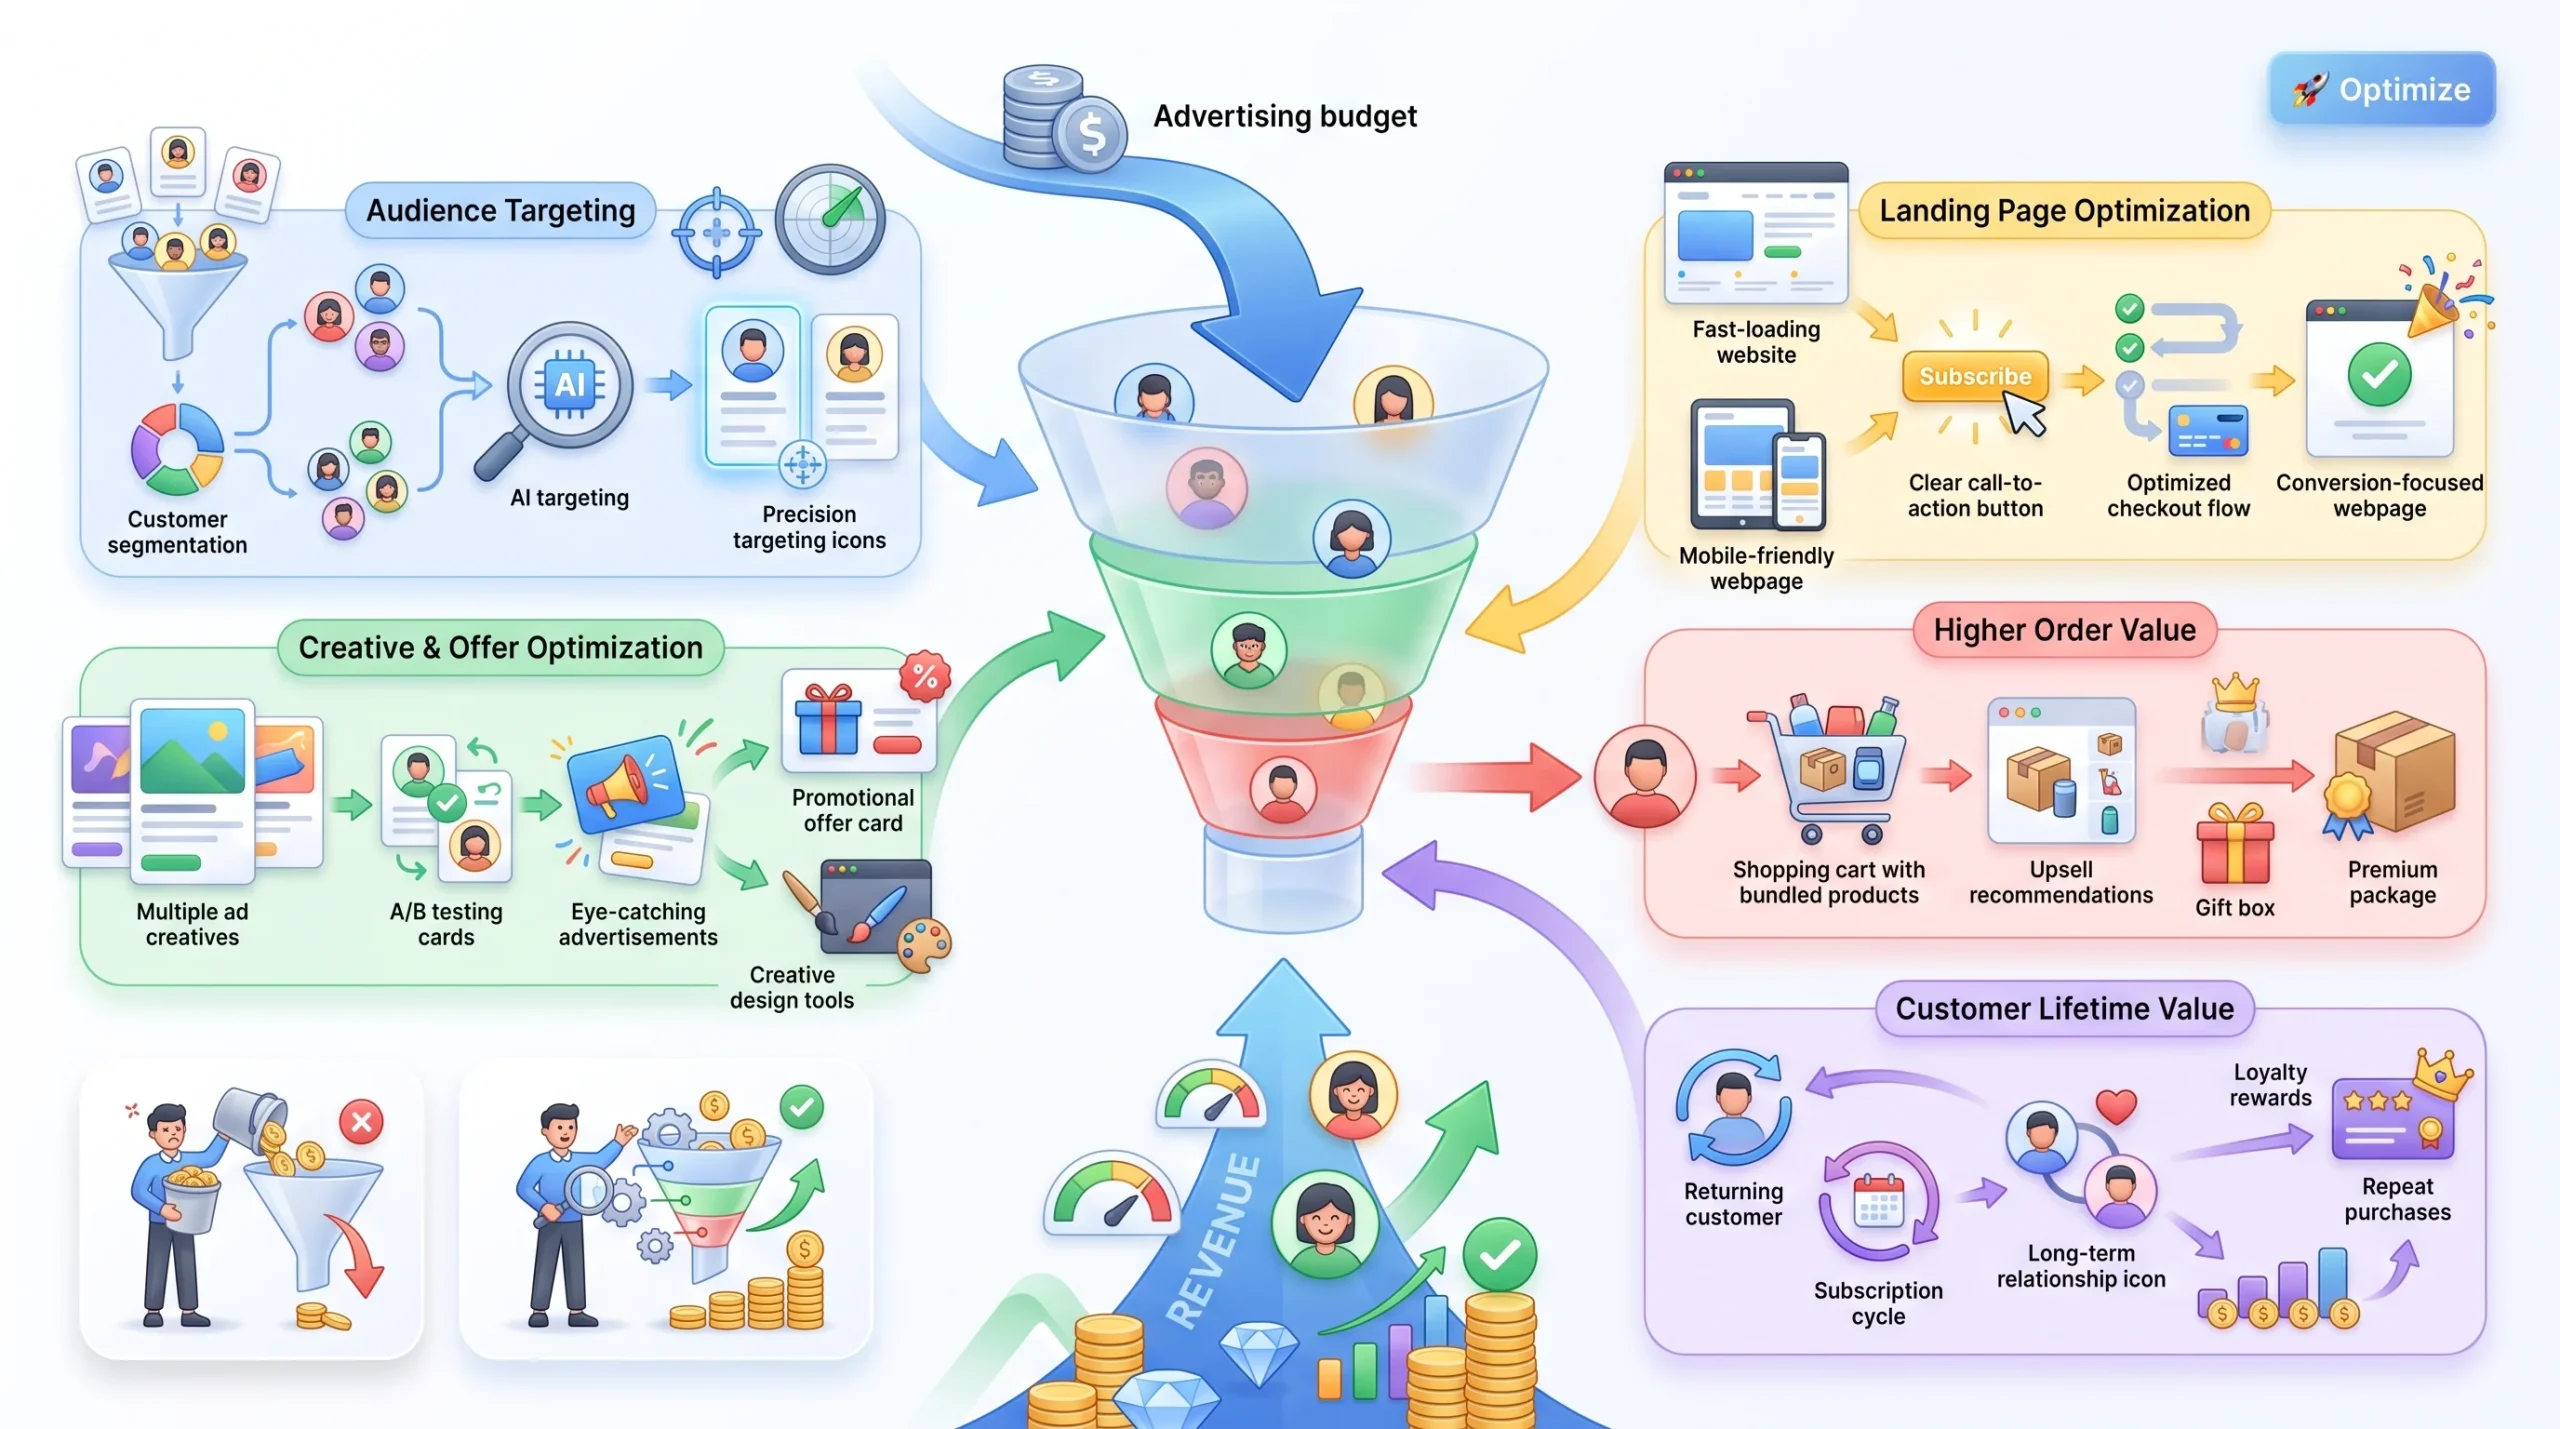
Alright, the practical part. This isn’t a generic tips list, each of these connects back to the logic already covered, so it should make more sense now than it would have at the top of this guide.
Improve targeting and audience quality. Wasted spend usually comes down to showing ads to people who were never going to buy in the first place. Tighter targeting built from real customer data, not guesses, reduces that waste and puts more of the budget in front of people actually likely to convert. This means building audiences off of who’s actually purchased before rather than a demographic guess about who “seems like” the right customer. Retargeting people who’ve already visited the site or engaged with the brand almost always shows a stronger ROAS than cold audiences, simply because those people already cleared the first hurdle of knowing the brand exists.
Improve creative and offer. Perfect targeting still underperforms if the ad itself doesn’t earn attention or the offer doesn’t give someone a reason to act. This isn’t something to guess your way through either, testing multiple creative variations against each other is how the winning version actually gets found, instead of assuming the first draft was the best one. Run two or three different angles at once, a different headline, a different image, a different framing of the offer, and let actual performance data decide the winner rather than a gut feeling about which one “looks better.”
Improve the landing page. A slow, mismatched, or confusing landing page wastes clicks that were already paid for. The ad did its job, someone clicked, and then the landing page lost them. That’s not an ad spend problem, that’s a conversion path problem, and it’s often the cheapest fix on this entire list since it doesn’t require touching the ad budget at all. If the ad promises a specific product or offer and the landing page dumps someone on a generic homepage instead, that mismatch alone can tank conversion rate regardless of how good the targeting was.
Increase average order value. Raising AOV improves ROAS without spending a single extra dollar on ads, because more revenue comes out of the exact same paid traffic. Bundles, upsells, free shipping thresholds, all of these push the same customer to spend more per order. A free shipping threshold set just above the average cart value is a classic move here, it nudges people to add one more item, and that one extra item is pure upside against a click that was already paid for either way.
Factor in customer lifetime value. A campaign judged only on first-purchase revenue can look mediocre while actually being excellent once repeat purchases get factored in over time. Someone who buys once at a low margin but comes back five more times is a completely different story than someone who buys once and disappears, even though a first-purchase-only ROAS calculation would treat them identically. A subscription business or a brand with strong repeat purchase behavior can often justify spending well past what a first-purchase ROAS alone would recommend, because the real return shows up over months, not on day one.
| Lever | What It Actually Fixes | Requires More Ad Spend? |
|---|---|---|
| Better targeting | Reduces wasted spend on unlikely buyers | No |
| Stronger creative/offer | Increases conversion rate from the same traffic | No |
| Landing page optimization | Fixes leaks after the click, not before it | No |
| Higher average order value | More revenue per conversion | No |
| Customer lifetime value | Reveals true long-term return, not just first purchase | No |
Notice something about that whole list. None of it requires spending more money on ads. Every single lever improves ROAS by making the existing spend work harder, not by throwing more budget at the problem.
KPIs to Track Alongside ROAS
ROAS should never get read on its own. It’s one piece of a bigger picture, and pairing it with a few other metrics is what actually turns a number into a diagnosis instead of just a headline.
| Metric | What It Adds to the ROAS Picture |
|---|---|
| CPA (Cost per Acquisition) | Shows the cost side of the equation on its own, useful for spotting efficiency issues ROAS alone can hide |
| Conversion Rate | Shows whether traffic quality or landing page performance is the real issue behind a weak ROAS |
| AOV (Average Order Value) | Shows whether ROAS is being driven by transaction size or by volume |
| CLV (Customer Lifetime Value) | Shows whether a “weak” first-purchase ROAS is actually strong once repeat revenue is factored in |
| Net Profit Margin | The number that ultimately decides what ROAS needs to be to stay profitable |
Reading these together is what separates someone just reacting to a number from someone actually figuring out what’s happening inside a campaign. A weak ROAS paired with a low conversion rate points toward a landing page problem. A weak ROAS paired with a healthy conversion rate but low AOV points somewhere completely different, toward the offer or the pricing itself. Same starting number, two totally different diagnoses, and you only get there by looking at more than just ROAS in isolation.
Take a concrete case. Two campaigns both show a 2:1 ROAS, which on the surface looks identical. Campaign A has a strong 4% conversion rate but a low $30 AOV. Campaign B has a weak 1% conversion rate but a $120 AOV. Same ROAS, completely different problems to solve. Campaign A is converting fine, the fix here is pushing average order value higher through bundling or upsells. Campaign B is struggling to convert traffic at all despite a high-value product, which points toward the landing page or the offer itself, not the targeting. Look at ROAS alone and both campaigns look equally “okay.” Look at the metrics behind it and two completely different action plans show up.
Tools for Tracking ROAS
Rounding this out with the practical side of where these numbers actually come from.
Native platform reporting, Meta Ads Manager, Google Ads, is where most beginners start, and it’s a reasonable starting point. It’s already built in, it’s free, and it shows performance in real time without any extra setup. Just keep the attribution caveats from earlier in mind, since each platform’s own dashboard tends to be a little generous crediting itself for sales that might have happened anyway or been influenced by another channel.
Google Analytics 4 adds cross-channel visibility that a single platform’s dashboard can’t give you, since it’s not trying to claim credit for one specific ad source. It sits above the individual platforms and gives a more neutral view of how traffic from different channels actually behaves once it lands on the site, which makes it a useful second opinion against what Meta or Google Ads are claiming on their own.
Third-party or e-commerce-specific tools come into play once a business is running across more than one platform and needs a single blended view instead of piecing together numbers from three different dashboards by hand. These tools typically pull spend and revenue data from every connected platform into one place, which makes it much easier to see blended ROAS across the whole account instead of jumping between tabs and doing the math manually every time someone asks for an update.
Here’s the thing that actually matters more than which tool gets picked though. Whatever’s being measured needs to line up with actual sales data, not just whatever number a platform is reporting about itself. Pull the actual order numbers from the store or the payment processor every so often and compare them against what the ad platforms are claiming. If there’s a big gap, that gap is worth understanding before trusting either number blindly. The tool is just the messenger. The real check is whether that message matches reality.
Conclusion
Stop looking for a universal good ROAS number, because it doesn’t exist, and every article claiming otherwise is really just describing an average of businesses that aren’t yours. The actual skill here isn’t memorizing a benchmark from a blog post, it’s understanding your own margin, knowing how attribution can quietly lie to you, and reading ROAS alongside the other metrics that give it context instead of staring at it in isolation. Go run the break-even calculation from earlier in this guide using your own numbers right now, not someone else’s industry average. That five minutes of math will tell you more about whether your ROAS is actually good than any benchmark table ever could.
FAQs
What is a good ROAS for Google Ads?
A commonly cited reference point is somewhere around 4:1, though this varies heavily by industry and margin. A financial services business with a long sales cycle and thin margins might need a very different target than an ecommerce brand with high margins and fast purchase decisions. The number that actually matters is your own break-even ROAS, not a generic industry figure.
What is a good ROAS for Facebook or Meta ads?
Reference points commonly cited for Meta ads sit somewhere around 2:1 to 4:1, with retargeting campaigns typically performing better than cold traffic aimed at people who’ve never heard of the brand. As with any platform, the real answer depends on your profit margin, not a number pulled from an average across every business running ads on the platform.
What’s the difference between ROAS and ROI?
ROAS only looks at ad spend versus the revenue that spend generated. ROI takes a much wider view, factoring in every cost tied to the business, not just advertising. A campaign can post a strong ROAS while the business as a whole has a weak or negative ROI if overall costs and margins are thin enough.
How do I calculate my break-even ROAS?
Divide 1 by your profit margin. A business with a 25% margin has a break-even ROAS of 4, meaning a 4:1 ROAS gets it to zero profit or loss, not into actual profit. Anything above that number is where real profit starts to show up.
Why does my ROAS look different on Meta than in Google Analytics?
Different platforms use different attribution models and windows, and each one tends to over-credit itself for a given sale. A last-click model on one platform might claim a sale that a different platform’s ad actually influenced earlier in the customer’s journey. This is why cross-checking platform-reported numbers against your own sales data matters.
Can a good ROAS still mean I’m losing money?
Yes, and this happens more often than people expect. If the ROAS calculation only accounts for ad spend and revenue, ignoring cost of goods sold, shipping, fees, and other costs, a campaign can look profitable on the surface while actually losing money once those costs are factored in.
How often should I check my ROAS?
Checking weekly is a reasonable habit for actively managed campaigns, especially ones spending meaningfully, but avoid drawing hard conclusions from small windows of data. A single rough day or even a rough week isn’t necessarily a trend, particularly for newer campaigns still gathering data.
What ROAS should I aim for as a beginner?
Skip searching for a universal target and calculate your own break-even ROAS first, using your actual profit margin. Once that number is clear, aim to build comfortably above it, since anything sitting right at break-even means the campaign is covering itself but not actually generating profit for the business.