


Look, if you’ve ever sat in a budget meeting and gotten asked “so what did all this content actually get us?” — and you didn’t have a real answer — you’re not alone. This happens constantly, in companies of every size, from three-person startups to publicly traded enterprises. Marketing teams pump out blog posts, guides, videos, whatever, month after month, and then when someone with the checkbook finally asks for numbers, all they’ve got is a traffic chart pointing up and to the right. Pageviews. Maybe a bounce rate nobody fully understands. That’s not proof of anything. That’s just activity dressed up as achievement.
Here’s the thing nobody wants to say out loud: most companies that “do content marketing” have no real idea whether it’s working. They know they’re publishing consistently. They know Google Analytics shows some green arrows trending upward. But ask them how much actual revenue came from the blog last quarter, and you’ll get a shrug, a guess pulled out of thin air, or a nervous laugh followed by “well, it’s hard to measure exactly.” That answer used to be acceptable. It isn’t anymore, not when budgets are tighter and every department is expected to justify its existence with numbers.
That gap — between “we’re doing content” and “we know content is making us money” — is exactly what this guide is about. We’re going to walk through how to measure content marketing ROI properly, not with vague gestures at “brand awareness” or “thought leadership,” but with actual formulas, actual attribution logic, and actual dashboards you could realistically build this month with the tools you already have access to.
Why does this matter so much right now? Because content is expensive, and it’s gotten more expensive, not less, even with AI tools speeding up parts of the process. A single long-form article with decent research, a writer who actually understands the topic, some design work, and proper SEO optimization can run anywhere from $300 to $2,000 depending on who you hire and how deep the piece goes. Multiply that by 50 or 100 posts a year, then add in video production, email nurture sequences, gated whitepapers, and case study interviews, and suddenly you’re staring at a six-figure content budget with basically zero accountability attached to it. That’s the problem. Not because content doesn’t work — it absolutely can, and often does — but because “it works, trust me” isn’t a business case. Numbers are a business case. Nothing else survives a serious budget review.
There’s also a trap a lot of marketers fall into, and it’s worth naming early: confusing content performance with content ROI. These are not the same thing, and mixing them up is exactly how you end up defending a blog post that pulled in 40,000 pageviews and generated zero paying customers. Performance tells you people showed up. ROI tells you whether them showing up actually made you money. A post can perform beautifully on every engagement chart and still be a complete financial dud. A post can barely register on your traffic reports and quietly be your best-converting asset of the entire year. We’re going to get into real examples of both situations later in this guide.
This isn’t just a marketer’s problem either, and it’s worth being clear about who needs this information. CEOs need this because they’re the ones signing off on the budget every quarter. Business owners need it because every dollar spent on a freelance writer is a dollar not spent on something else that might have worked better. Agencies need it because clients are increasingly showing up to renewal conversations asking “prove it” instead of just renewing on faith the way they used to five years ago. If you’re any of these people, this guide was written for you specifically.
What You Will Learn in This Guide
Before diving in, here’s a quick rundown of exactly what’s covered, so you can skip ahead if you need to or read straight through if you’ve got the time. This guide moves from foundational concepts through to advanced tactics, so even if you’re already familiar with the basics, there’s a good chance the later chapters cover ground you haven’t fully mapped out yet, especially around attribution modeling and tracking setup.
- What content marketing ROI actually means, and how it’s genuinely different from just “content performance,” which trips up more marketers than you’d expect
- The full funnel content moves through, and why measuring only one stage of that funnel gives you a badly distorted picture of what’s actually happening
- Why ROI measurement is genuinely difficult, and it’s not because marketers are lazy or bad at their jobs
- The actual formulas — both basic and advanced — with real sample calculations you can adapt to your own numbers
- Every cost category you need to include, including the sneaky ones people conveniently forget when they want their ROI number to look better
- Where revenue from content actually originates, and the practical steps for tracing it back to the piece that started the journey
- The KPIs that matter, organized so you’re not drowning in forty different metrics that don’t actually mean anything for your specific goals
- Attribution models explained without the jargon soup that usually makes this topic more confusing than it needs to be
- The tools that actually help you get this done, plus a few that get more hype than they deserve
- A step-by-step framework for setting up tracking from scratch, even if you’re starting with absolutely nothing in place right now
- How ROI measurement shifts depending on the specific content type you’re evaluating
- How SEO compounds ROI over time in a way paid advertising simply never will, no matter how good your ad targeting gets
- The mistakes that quietly wreck ROI calculations without anyone noticing until months later
- Advanced strategies to push your ROI numbers meaningfully higher once the basics are in place
- How to build a dashboard that a CEO would actually glance at and understand, not one that just sits unopened
- Real case studies showing these principles applied in practice
- Where all of this is heading next, as tracking technology and privacy rules keep shifting
Alright. Let’s get into it properly.
What Is Content Marketing ROI?
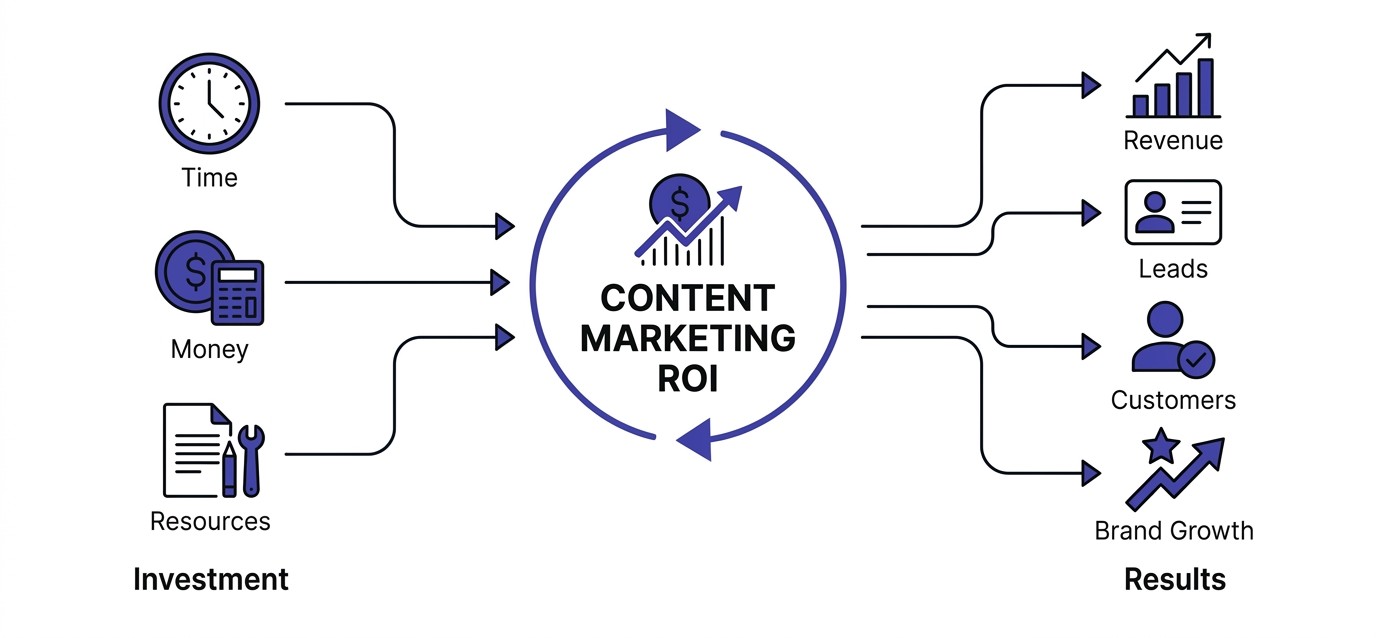
Content Marketing ROI (Return on Investment) is the process of measuring how much value your content generates compared to the amount of money, time, and resources you invest in creating, promoting, and maintaining it. It helps businesses determine whether their content strategy is contributing to revenue, lead generation, customer acquisition, brand awareness, or other business goals.
Many companies publish blogs, videos, social media posts, whitepapers, and email newsletters consistently but fail to measure whether those efforts actually produce meaningful business results. Content without measurable outcomes becomes an expense rather than an investment. Measuring ROI transforms content marketing into a data-driven strategy where every piece of content is evaluated based on its contribution to business growth.
The Simple Explanation
Content marketing ROI is, at its core, a comparison between two numbers. You spend money making and distributing content — writers, designers, tools, promotion, all of it. That content, ideally, generates revenue back for the business, whether through direct sales, qualified leads, or improved retention. ROI is simply the ratio between what you got back and what you put in to get it. That part sounds simple because the concept genuinely is simple. The measurement part is where things get messy, and that’s most of what this guide deals with.
The Business Perspective
From a business owner’s chair, content ROI answers one very specific question: is this spend justified compared to everything else I could be doing with the same money? If a $50,000 annual content budget generates $200,000 in revenue that can reasonably be traced back to it, that’s a conversation-ending number in any budget meeting. Nobody argues with a 4x return sitting on a spreadsheet. But if that same $50,000 only generates $12,000, you’ve got a real problem on your hands, and no amount of impressive-looking pageview charts is going to rescue that conversation when finance starts asking questions.
The Marketing Perspective
From inside the marketing team itself, ROI isn’t just a report card handed down from leadership — it functions more like a compass for daily decisions. It tells you which content types deserve more budget next quarter, which channels are quietly wasting money, and which topics your audience actually cares enough about to take action on rather than just skim past. Marketers who track ROI properly stop guessing at what to produce next. They start deliberately making more of what’s proven to work and quietly retiring what isn’t, instead of publishing content on autopilot simply because the editorial calendar says something needs to go out this week.
Why ROI Matters
Budget justification. You genuinely cannot walk into a leadership meeting next year and ask for a bigger content budget armed with nothing but “trust me, it’s working, I can feel it.” Numbers get budgets approved. Vibes and gut feelings don’t, especially once a company starts scrutinizing every line item more closely than it used to a few years back.
Marketing accountability. Content teams that actually measure ROI tend to hold themselves to a noticeably higher internal standard than teams that never bother. It genuinely changes the culture over time. Instead of reporting “we published 12 pieces of content this month” as the win itself, the conversation shifts naturally toward “we published 12 pieces and 3 of them generated real pipeline worth tracking.”
Resource allocation. Once you actually know which content drives revenue and which doesn’t, you can shift writers, designers, and ad spend toward the formats and topics proven to perform, instead of spreading your entire budget evenly like peanut butter across everything on the calendar regardless of past results.
Better strategic decisions. ROI data reveals things that gut instinct simply can’t see on its own. Maybe your case studies quietly convert far better than your blog posts ever have. Maybe your how-to guides bring in the most traffic, but your comparison pages bring in the actual paying buyers. None of this becomes visible until you sit down and measure it properly.
Difference Between ROI and Content Performance
This is exactly where a lot of teams get tripped up, so it’s worth slowing down here and walking through it carefully with real scenarios attached.
High traffic but no revenue. Picture a blog post that ranks for a broad keyword like “what is marketing” and pulls in 60,000 visits every single month. Impressive on paper, and it’ll look great screenshotted into a slide deck. But if those visitors are mostly students doing homework assignments rather than actual buyers researching a purchase decision, that traffic converts at essentially zero percent. Great performance on the surface, genuinely terrible ROI underneath it.
Low traffic but high conversions. Now picture a much narrower post like “best CRM for 10-person insurance agencies.” Maybe it only gets 400 visits a month, nothing to brag about in a traffic report. But those 400 people are exactly your ideal buyer, searching with real intent. If 20 of them book a demo and 4 become paying customers at $12,000 a year each, that quiet, low-traffic post just generated $48,000 for the business. That’s ROI doing its actual job while raw performance metrics look completely unremarkable next to it.
Viral content with poor ROI. A listicle goes unexpectedly viral, gets shared everywhere across social platforms, spikes your traffic dramatically for about a week. It feels incredible while it’s happening. Then you check the CRM afterward and find that basically zero new leads actually came from it. Viral doesn’t mean valuable. It just means momentarily visible to a lot of people who weren’t shopping for anything.
Evergreen content with excellent ROI. A detailed comparison guide published two years ago, quietly ranking on page one, quietly bringing in 10 to 15 qualified leads every single month without anyone touching it, month after month, with basically no ongoing cost attached. That’s the kind of content that actually pays salaries over time, even though it never generates the excitement a viral hit does.
Real-world example. Take a mid-market project management software company as a stand-in example here. They published two pieces the same month. One was “10 Productivity Hacks for Remote Teams,” which got picked up by a popular newsletter and hit 80,000 views almost overnight. The other was “Asana vs Their Tool: Which One Fits Teams Under 50 People,” which got maybe 3,000 views total, barely a blip by comparison. Guess which one actually drove more trial signups? The comparison page, by a wide margin, because it was catching people at the exact moment they were actively choosing between two specific products to buy. The productivity post was mostly read by people who weren’t shopping for software at all that day.
What is the Complete Content Marketing Funnel
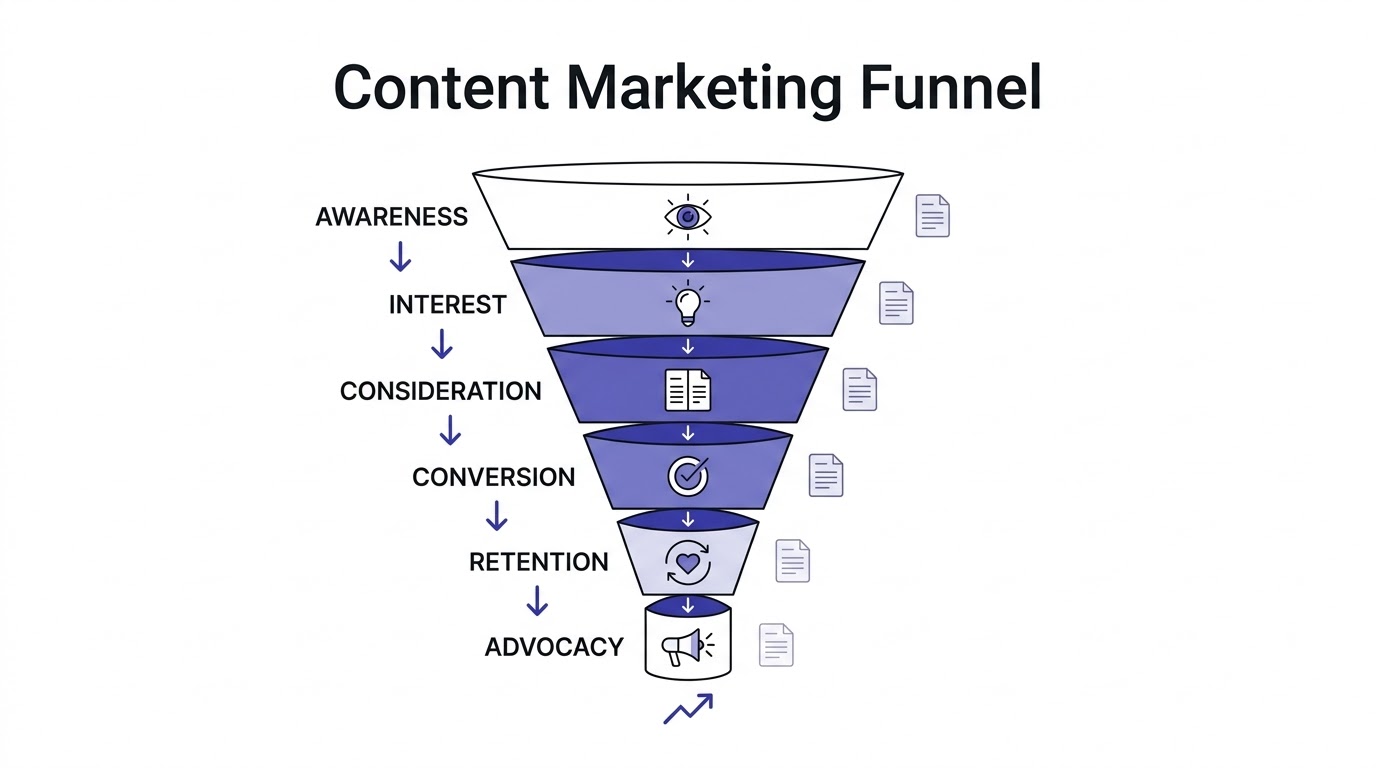
You genuinely can’t measure ROI properly if you’re treating every single piece of content the same way, using the same yardstick regardless of its job. A blog post introducing your brand to a total stranger and a case study closing an already-warm deal are doing completely different jobs in the business. They need different metrics attached to them, and judging one by the other’s standards will only produce confusing, misleading conclusions.
The funnel itself moves roughly like this: Awareness leads into Interest, which leads into Consideration, which leads into Conversion, which leads into Retention, and eventually into Advocacy if things go well. Content shows up at every single one of these stages in some form, and if you’re only ever measuring top-of-funnel numbers like raw traffic, you’re missing almost the entire story of what content is actually doing for the business.
Top of Funnel Content
This is where most companies sink the bulk of their content budget without thinking too hard about it — blogs, educational guides, explainer videos, the broad stuff. The goal here isn’t to sell anything directly. It’s simply to get found and get noticed by people who have no idea your company exists yet, planting the earliest seed of a relationship that might take months to develop further.
The metrics that matter here are traffic, reach, and impressions. There’s nothing inherently wrong with tracking these numbers closely — just don’t confuse them with proof of revenue generated. Top-of-funnel content is genuinely doing its job correctly if it’s bringing new eyeballs into your orbit, full stop, even if none of those eyeballs convert this month.
Middle of Funnel
Once someone already knows who you are, middle-of-funnel content exists to move them further, toward seriously considering you as an option. Case studies, webinars, detailed whitepapers — this is the stuff specifically designed to earn genuine trust rather than just awareness.
The metrics that matter here are leads, downloads, and email signups. This is the stage where you finally start seeing real intent show up in the data. Someone handing over their email address for a whitepaper is a fundamentally different animal than someone who skimmed a random blog post for forty seconds and bounced.
Bottom of Funnel
Landing pages, product pages, demo request forms live here. This content exists for exactly one reason, no ambiguity about it whatsoever — to convert visitors into paying customers or qualified leads ready for sales.
The metrics that matter here are sales, revenue, and qualified leads generated. If bottom-of-funnel content isn’t producing these specific numbers consistently, something is genuinely broken somewhere, whether that’s weak content itself, a poor offer, or bad targeting sending the wrong people to the page in the first place.
Post-Purchase Content
Content marketing doesn’t stop the moment someone finally becomes a paying customer, and honestly, this stage gets neglected way more often than it should. Help articles, ongoing newsletters, and customer education content all work together to keep people actually using what they bought, which directly prevents them from churning away later.
The metrics that matter here are retention rate, upsell revenue, and customer lifetime value. A help center that quietly reduces support ticket volume and keeps churn numbers down is generating real ROI even though it never shows up on a typical “content marketing performance” report most teams build.
Why Measuring ROI Is Difficult
Honestly, if measuring content ROI were an easy, straightforward task, every single company would already be doing it well and this guide wouldn’t need to exist. It’s genuinely difficult, and here’s a breakdown of exactly why.
Long Buying Cycles
A B2B software purchase can realistically take anywhere from six to eighteen months to move from someone’s first blog visit all the way through to a signed contract. Try attributing that eventual sale back to one specific article they happened to read over a year earlier. Most standard analytics tools don’t even retain cookie data that far back, making the connection nearly invisible without dedicated long-term tracking infrastructure in place.
Multiple Touchpoints
Nobody buys anything meaningful after reading just one blog post in isolation. They typically read a guide, then a comparison page, then a case study, then go Google a competitor for a second opinion, then come back to your site, then a colleague forwards them a review site link. By the time they finally convert, six or seven separate pieces of content have touched their decision in some way. Giving 100% of the credit to just one of those pieces is basically fiction, but that’s exactly what basic default tracking setups end up doing anyway.
Multi-channel Marketing
Someone reads your blog post, later sees a retargeting ad for you on Instagram, then gets an email a few days later from a nurture sequence, and finally converts after that email. Which channel actually “gets the credit” for that sale? This is the classic marketing attribution headache that’s existed for years, and content ROI inherits this exact problem in full.
Organic Search Delays
SEO-driven content doesn’t perform the day you hit publish, no matter how good the writing is. It can genuinely take three to six months, sometimes considerably longer, to start ranking meaningfully in search results. If you measure ROI just a month after publishing something, you’ll likely conclude the piece failed when really it simply hasn’t had enough time to work yet.
Attribution Issues
Analytics tools default to last-click attribution most of the time out of the box, meaning whatever page someone happened to be on right before converting gets 100% of the credit for the entire journey. That massively undervalues the earlier content that actually introduced the person to your brand in the first place and did the harder work of building initial trust.
Offline Conversions
Somebody reads your content online, then picks up the phone and calls your sales line, or walks physically into your store, or asks a friend for a referral after remembering your brand from something they read. None of that activity shows up in Google Analytics at all. It happened, and it mattered to the business, but it remains completely invisible to your standard dashboard.
Brand Awareness Isn’t Immediate Revenue
Some content exists purely to plant a seed in someone’s mind. They read it, consciously forget about it fairly quickly, but subconsciously remember your company name six months later when they’re finally ready to actually buy something in your category. That’s genuinely real value being created. It’s also nearly impossible to attach a clean, defensible dollar figure to it after the fact.
The Content Marketing ROI Formula Explained
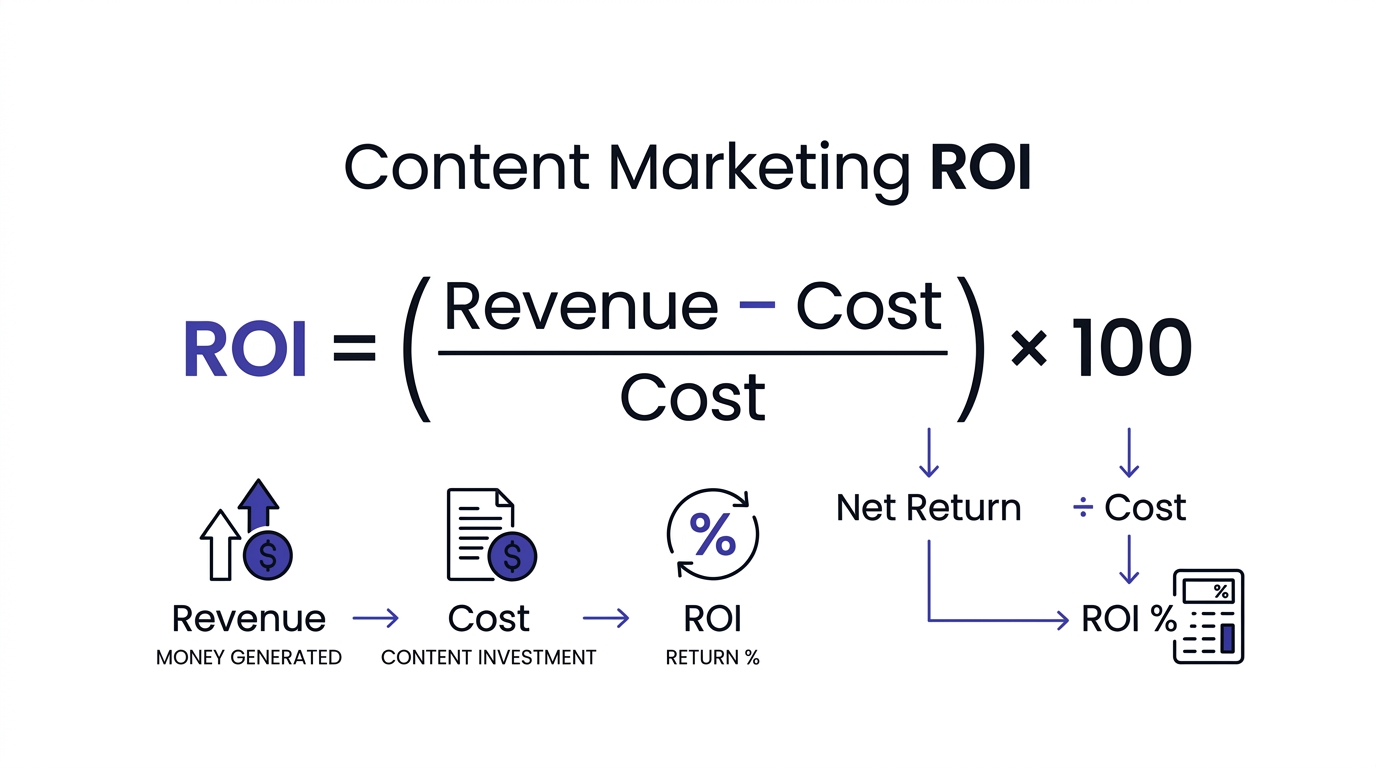
Okay, formulas. This is the part everyone actually came here for, so let’s not overcomplicate something that’s genuinely straightforward at its core.
Basic ROI Formula
ROI = ((Revenue – Cost) / Cost) × 100
Say that out loud a few times, because it’s genuinely the entire concept in one line. You take what you made from the content, subtract what you spent producing and distributing it, divide that difference by what you spent, then multiply the result by 100 to turn it into a clean, readable percentage.
Revenue here means the money you can reasonably attribute to that specific piece or campaign of content — sales closed, subscriptions started, whatever your particular business counts as real revenue in its financial reporting.
Cost means everything that went into producing and distributing that piece of content. Not just the writer’s invoice sitting in your inbox. We’ll break this down fully and carefully in Chapter 5, but for now, understand that “cost” needs to include far more than most people initially assume when they’re doing quick napkin math.
If your revenue equals your cost exactly, your ROI comes out to 0%. You broke even, nothing gained, nothing lost. Anything above zero means the content genuinely made you money. Anything negative means it cost you more to produce than it ever returned, which is important information even when it’s disappointing to see.
Advanced ROI Formula
The basic formula works perfectly fine for quick napkin math during a casual conversation. But if you want something a finance department would actually trust and sign off on, your cost side needs to expand to include: production cost covering the actual writing, filming, or design work involved; distribution cost covering paid promotion and social ads pushing the content out; software costs covering your CMS, SEO tools, and analytics stack, prorated fairly across the content they support; agency fees if any part of the process gets outsourced externally; employee salary, meaning the specific portion of someone’s time spent on this content rather than their entire salary; design costs for graphics, custom illustrations, and thumbnails; video editing costs, which can become a genuinely huge line item people conveniently forget about; and promotion costs covering email blasts, influencer partnerships, and paid social boosting. Skip any single one of these categories and your final ROI number ends up inflated and, honestly, a bit dishonest, even if that wasn’t the intention behind leaving it out.
Sample ROI Calculations
Example 1: A single blog post. Say a post costs $600 total to produce, covering the writer, an editor’s pass, and a bit of design work for the header image. It generates 20 leads over the following three months. Of those leads, 5 eventually become paying customers at $500 each, totaling $2,500 in revenue. Running the formula: ROI = ((2,500 – 600) / 600) × 100 = 316%. That’s a genuinely fantastic return coming from a single article.
Example 2: An SEO blog series over 12 months. Total cost across the full year for a content series targeting a specific keyword cluster comes to $8,000, covering writers, editing, and some paid promotion used to kickstart early traffic. Over the year, this series generates 340 leads total, converting at roughly 6%, working out to about 20 customers at an average deal size of $1,200 each. That’s $24,000 in total revenue. ROI = ((24,000 – 8,000) / 8,000) × 100 = 200%. A genuinely solid result, and this particular number tends to keep climbing further into year two, since the content is already ranking well and ongoing costs drop sharply while revenue keeps flowing in.
Example 3: A video marketing campaign. Production cost here, including a hired videographer, editing software, and a paid promotion push behind it, totals $15,000. It generates enough awareness to lead to 8 tracked sales at $2,000 each, totaling $16,000. ROI = ((16,000 – 15,000) / 15,000) × 100 = 6.7%. Technically positive, sure, but only barely. This is exactly the kind of result that should trigger a hard, honest look at whether video is genuinely worth this level of spend for this particular business, or whether the targeting needs serious rework before investing further.
Example 4: An email marketing article. A guide written specifically to feed into an email nurture sequence costs $400 to produce. It gets sent to a segment of 5,000 subscribers, converts 15 of them into paying customers at $300 each, generating $4,500 total. ROI = ((4,500 – 400) / 400) × 100 = 1,025%. Email content consistently posts some of the biggest ROI percentages across this entire guide, mostly because production cost stays low and the audience receiving it is already warm and familiar with your brand.
Notice something clearly across all four examples — the ROI percentage swings wildly depending on the content type, the temperature of the audience involved, and the underlying cost structure at play. That’s completely normal and expected. Don’t panic if your video campaign posts a modest 7% return while your blog post hits 300% in the same reporting period. Different content types are simply supposed to behave very differently from one another.
All Costs You Must Include When Calculating ROI
People love to quietly lowball their cost side because it makes the final ROI number look more impressive on a slide. Don’t do this to yourself. It’ll bite you later when finance starts cross-checking your numbers against what they’re actually seeing in the budget spreadsheets.
Content Planning
Time spent researching topics, doing keyword research, and building out an editorial calendar counts as real cost. This isn’t free labor magically appearing out of nowhere just because nobody sends a separate invoice for the planning phase specifically.
Keyword Research
Whether you’re doing this yourself inside a tool like Ahrefs or paying an SEO consultant to hand you a full keyword map, this genuinely costs money somewhere along the line. Prorate the relevant tool subscription fairly across the content it directly supports.
Writer Cost
The most obvious line item on any list like this, but people still manage to get it wrong by only counting the final invoice while completely ignoring revision rounds, briefing calls, and the back-and-forth emails that ate up real hours.
Editing
A second set of eyes reviewing the work costs money too, whether that’s a dedicated in-house editor or a senior marketer spending an hour cleaning up someone else’s rough draft before it goes live.
Design
Custom graphics, header images, and infographics all add up. Stock photos are relatively cheap, sure, but custom design work adds up fast, especially for content-heavy brands publishing frequently across multiple formats.
Video Production
Camera equipment, editing software licenses, a videographer’s day rate, voiceover talent if you’re using any. Video is consistently the single most underestimated cost category across nearly every company that tries to track this seriously.
SEO Optimization
Someone actually has to go through the piece and optimize titles, meta descriptions, internal links, and overall content structure. That takes real, measurable time, which means it carries real cost, even if it happens quietly in the background.
Publishing
CMS platform fees, plus developer time if your site needs any custom work to properly display the finished content the way it was designed to look.
Promotion
Social media scheduling tools, the actual time spent posting and engaging with comments, and any paid boosts applied to extend reach beyond organic followers.
Paid Ads
If you’re running paid traffic to a piece of content through paid search or paid social channels, that ad spend genuinely counts as a content cost. It shouldn’t get filed away as a separate, unrelated line item that gets ignored during ROI calculations.
Influencer Promotion
Paying someone with an existing audience to share your content or collaborate on producing it together. This can get expensive surprisingly fast and needs to be tracked directly against the specific content piece it’s supporting.
Marketing Automation
Your HubSpot, Marketo, or ActiveCampaign subscription fee should be prorated fairly across the specific campaigns actively running through that platform at any given time.
Email Marketing
Platform costs, plus the actual time spent building and sending campaigns tied to specific pieces of supporting content used within those emails.
Content Refresh
Updating an old post genuinely isn’t free just because the original piece was already paid for once. Someone has to research what’s changed since publication, rewrite outdated sections, and republish the updated version. This cost should be tracked separately from original production, since it recurs repeatedly over a content asset’s entire lifespan.
Analytics Tools
Google Analytics itself is free, sure, but most serious content teams are also paying for Looker Studio add-ons, heatmap tools, or CRM reporting features that carry real, ongoing subscription costs worth accounting for.
Hidden Costs Most Businesses Ignore
Meeting time spent discussing the content. Approval cycles where legal or compliance teams review drafts before publication. Translation costs if you’re localizing content for different markets. The opportunity cost of pulling a subject matter expert away from their regular job for an interview. None of these show up neatly on an invoice anywhere, but they’re genuinely real costs, and ignoring them is exactly how ROI numbers end up misleadingly rosier than reality actually supports.
How to Measure Revenue from Content Marketing
This is honestly the hardest part of the entire process, because revenue doesn’t arrive with a convenient little tag attached saying “this came from that specific blog post you wrote back in March.” You genuinely have to go find it yourself, piece by piece.
Organic SEO. Set up goal tracking inside GA4 tied specifically to organic sessions, then follow those sessions carefully through to actual conversion events. If someone lands on an SEO-driven blog post and eventually fills out a demo form weeks later, that connection is traceable as long as your tracking infrastructure is configured correctly from the start.
Paid Campaigns. When you’re running ads driving traffic to specific content, UTM parameters become completely non-negotiable. Every single link needs one attached, or you’ll lose track entirely of which campaign actually drove which eventual conversion.
Email Marketing. This tends to be one of the easier revenue sources to trace cleanly, because email platforms already track click-throughs natively, and when integrated properly with your CRM, can follow that person all the way through to a closed deal down the line.
Social Media. Genuinely trickier to trace, because a lot of social engagement happens without anyone ever clicking a link at all. Someone might see your post, remember your brand vaguely, then later just type your company name directly into Google search. That’s called dark social, and it absolutely does generate real revenue, even though it appears as plain direct traffic inside your standard reports.
Referral Traffic. When another website links to your content and sends visitors your way, that traffic is trackable inside GA4’s referral reports without much extra setup. Worth paying attention to which specific referral sources actually convert into customers versus which ones just send low-value drive-by traffic.
Affiliate Marketing. If content is driving affiliate sales for your business, most affiliate platforms already come with their own built-in tracking systems that tie revenue directly back to specific content pages automatically.
Product Sales. For ecommerce businesses specifically, this tends to be one of the cleanest revenue traces available — someone reads a buying guide, clicks through to a product page, and buys. GA4’s ecommerce tracking handles this reasonably well right out of the box with minimal extra configuration needed.
Service Sales. Genuinely harder to trace, because service businesses often close deals over phone calls or in-person meetings that never get logged anywhere inside standard analytics tools. This is exactly where dedicated call tracking software earns its keep and pays for itself.
Subscription Revenue. For SaaS and membership-based businesses, tie content first to trial signups, then carefully follow the trial-to-paid conversion rate to attribute lifetime revenue back to whichever piece of content actually started that customer relationship in the first place.
SaaS Free Trial Conversions. Track which specific content pieces bring in trial signups, then segment your overall conversion rate by content source. You’ll often discover that some content brings in plenty of trial signups that rarely convert, while other content brings in fewer trials that convert at a noticeably higher rate.
Demo Requests. For B2B businesses especially, demo requests often serve as the cleanest bottom-of-funnel signal available. Track which content pieces tend to precede a demo request within the customer’s overall journey, not simply which page happened to host the request form itself.
Essential Content Marketing KPIs to Measure ROI
There’s a real temptation here to track absolutely everything available. Resist that urge firmly. More metrics doesn’t automatically mean more clarity for your team — usually it just means more noise drowning out the signals that actually matter for your specific goals.
Traffic Metrics
Organic Traffic. Visitors arriving from unpaid search results specifically. This usually forms the backbone of long-term content ROI, since it keeps working steadily without requiring continuous ongoing ad spend to sustain it.
Direct Traffic. People typing your website URL straight into their browser without clicking any link at all. A steadily rising direct traffic number often signals growing brand recognition over time, sometimes fed indirectly by content people remembered clearly but never actually clicked on originally.
Referral Traffic. Visitors arriving specifically via links placed on other websites pointing to yours. A genuinely good indicator of how much your content is being cited, referenced, or shared elsewhere across the web.
Returning Visitors. People who’ve visited your site before at some point and have now come back again deliberately. High returning visitor rates on specific content pages usually mean you’ve built something genuinely useful worth revisiting, not just something that happened to rank once and got abandoned.
New Users. First-time visitors arriving on your site for the very first time. Necessary for sustained growth, obviously, but on their own these numbers don’t tell you anything meaningful about actual revenue generated.
Engagement Metrics
Time on Page. How long someone actually spends reading a given piece of content. Thirty seconds spent on a dense 2,000-word guide tells you pretty clearly that people are bouncing without genuinely engaging with the material at all.
Scroll Depth. Whether readers actually make it down to the bottom of your content or consistently bail out somewhere in the middle. Genuinely useful for figuring out precisely where you’re losing people’s attention within a longer piece.
Bounce Rate. The percentage of visitors who leave your site after viewing just a single page. Context matters enormously here — a high bounce rate on a quick reference page might be completely fine and expected, while that same rate on a product comparison page should raise real concern.
Pages per Session. How many separate pages someone visits before eventually leaving your site entirely. More pages viewed generally correlates with higher interest overall, though it doesn’t always correlate directly with more revenue generated.
Video Completion Rate. For video content specifically, what percentage of viewers actually watch all the way through to the end. Low completion rates showing up early in the video usually mean your opening hook simply isn’t working well enough to hold attention.
Lead Generation Metrics
Email Subscribers. New signups that can reasonably be attributed to a specific content piece or campaign that drove the signup in the first place.
Form Submissions. Contact forms, download requests, consultation requests — basically anything where someone willingly hands over their personal information in exchange for something of value from you.
Lead Magnets. Downloads of gated content specifically, things like templates, checklists, or full ebooks. Track carefully which lead magnets attract the genuinely highest-quality leads, not simply which ones generate the most raw download volume overall.
Demo Requests. Already covered earlier in Chapter 6, but worth repeating here as its own dedicated KPI category, since it’s often the single strongest bottom-funnel signal available within B2B businesses specifically.
SEO Metrics
Keyword Rankings. Where exactly you sit within search results for your specific target terms. Rankings alone don’t directly equal revenue on their own, but they function as a reliable leading indicator well worth watching closely over time.
Backlinks. Other websites linking back to your content voluntarily. More authoritative backlinks generally help improve your rankings over time, which eventually translates into more revenue further down the line.
Domain Authority. A composite score, most commonly Moz’s specific metric, though other tools maintain similar versions, estimating roughly how likely your site is to rank well overall across search results generally.
Search Visibility. The overall share of relevant search results where your brand actually shows up, calculated across all your various target keywords combined together into one aggregate figure.
Featured Snippets. Whether your content is successfully winning that prime “position zero” spot sitting right at the very top of search results pages. These tend to drive a disproportionately high click-through rate relative to their actual ranking position.
Conversion Metrics
Conversion Rate. The percentage of visitors who go on to complete whatever desired action you’ve defined for that specific page or piece of content. This is genuinely one of the single most important numbers found anywhere in this entire guide.
Assisted Conversions. Conversions where a particular piece of content played some meaningful role somewhere along the journey without actually being the final touchpoint right before conversion. GA4’s multi-channel reports can help surface this kind of data.
Revenue. The actual dollar amount generated by the business, which is, ultimately, the entire point of running this whole exercise in the first place.
Sales. The raw number of completed transactions or closed deals that can be reasonably tied back to specific content assets.
Pipeline Value. For B2B businesses specifically, the total dollar value of deals currently still in progress that originated from content, calculated even before those deals officially close and become recognized revenue.
Customer Metrics
Customer Acquisition Cost. How much you spent in total marketing cost, all channels combined, to acquire a single new customer. Content marketing frequently posts a lower CAC than paid channels over a longer time horizon, which happens to be one of its biggest selling points as a strategy.
Customer Lifetime Value. The total revenue a single customer generates across their entire relationship with your business, not just from their first purchase alone. This matters enormously for ROI calculations, because a customer acquired through content might genuinely be worth far more over three years than the initial transaction amount alone would suggest.
Retention Rate. The percentage of customers who actually stick around and continue their relationship with your business over time. Post-purchase content directly and measurably influences this specific number.
Repeat Purchases. For ecommerce businesses especially, how often existing customers come back and buy again after their very first purchase, and whether content, like detailed buying guides or a regular newsletter, is genuinely influencing that repeat behavior.
Brand Metrics
Brand Searches. People actively Googling your company name directly rather than a generic industry term. Rising brand search volume over time often means your content strategy is working, even in months when it’s not directly closing sales itself.
Social Mentions. How often people are talking about your brand online without you prompting them to. Genuinely harder to tie directly back to revenue, but still useful as a leading indicator worth tracking over time.
Share of Voice. How much of the overall conversation happening within your industry your brand is capturing compared to competitors, measured across search results, social platforms, and press mentions combined together.
Attribution Models and Their Impact on ROI
Here’s something that genuinely trips up a lot of people who are otherwise pretty sharp with numbers: the exact same customer journey can produce wildly different ROI results depending entirely on which attribution model you happen to be using. This isn’t a minor technicality buried in the settings menu. It genuinely changes which specific content ends up looking like a winner or a loser in your reports.
First Click Attribution
Gives 100% of the credit to the very first touchpoint in someone’s entire journey — the first blog post they ever happened to read, for example, before anything else followed.
Pros here: genuinely great for understanding what actually brings brand-new people into your world in the first place, before any nurturing happens.
Cons here: ignores absolutely everything that happened afterward that actually pushed them toward buying. A blog post might end up getting full credit for a sale that a detailed case study three months later actually closed on its own.
Last Click Attribution
The complete opposite approach — 100% of the credit goes to whatever content someone interacted with right before converting, nothing earlier counts at all. This remains the default setting in a lot of basic analytics setups simply because it’s the easiest option to calculate automatically.
The cons here are pretty obvious: it completely ignores all the content that built awareness and trust much earlier in the journey. Bottom-of-funnel content ends up looking dramatically more valuable than it actually was operating entirely on its own merits.
Linear Attribution
Spreads credit evenly across every single touchpoint that occurred throughout the journey. If someone interacted with five separate pieces of content before eventually buying, each one receives exactly 20% of the total credit.
Fairer overall than relying on first-click or last-click alone, but it treats a passing glance at some random blog post identically to a deep, engaged read of a detailed case study, which honestly doesn’t reflect reality very accurately either way.
Time Decay Attribution
Gives progressively more credit to touchpoints that occurred closer to the actual moment of conversion, and less credit to touchpoints further back in time. Makes fairly intuitive sense when you think about it — the case study someone read the day before finally buying probably mattered more to their decision than some blog post they skimmed eight months earlier.
Position-Based Attribution
Sometimes called U-shaped attribution in the industry. Gives extra weight specifically to the very first touchpoint and the very last touchpoint, with whatever credit remains spread out across everything that happened in between those two points. This approach tends to land as a solid, balanced middle ground for a lot of businesses trying to be fair without overcomplicating things.
Data-Driven Attribution
The most genuinely sophisticated option available, using machine learning to figure out actual credit weighting based entirely on real conversion patterns pulled from your own specific data. GA4 now offers this natively, and it’s honestly the best default choice for most businesses if you have enough overall conversion volume for the underlying algorithm to actually learn something meaningful from.
Which Attribution Model Should You Use?
| Business Type | Recommended Model |
|---|---|
| Short sales cycle, single-session purchases | Last Click |
| Long B2B sales cycle | Position-Based or Time Decay |
| Brand-building focus | First Click |
| High conversion volume, established tracking | Data-Driven |
| Simplicity is the priority | Linear |
Honestly, if you can swing it operationally, data-driven attribution is where most mid-size and larger companies should ultimately land. It’s genuinely the most accurate reflection of what’s actually happening across a real customer journey. But it does need real volume to function well — if you’re only getting a small handful of conversions each month, the underlying algorithm simply doesn’t have enough data to learn from properly, making position-based attribution a much more reasonable fallback choice in the meantime.
Best Analytics Tools for Measuring Content ROI
Accurate ROI measurement depends heavily on reliable analytics tools. Since no single platform tracks every stage of the customer journey, successful marketers combine several tools to gain a complete understanding of content performance, user behavior, conversions, and revenue attribution.
Google Analytics 4
What it measures: Traffic, engagement behavior, conversion events, and revenue figures once ecommerce tracking has been properly configured on the backend.
Key reports: The acquisition reports clearly show where your traffic actually originates from across channels, the engagement reports show precisely how people interact with your content once they arrive, and the conversion reports, once you’ve defined your specific conversion events, show the real business outcomes tied to that traffic.
Google Search Console
Shows you exactly which search queries are bringing people to your content and precisely how you’re currently ranking for each of them. Essential for understanding your organic content’s real search performance in a way GA4 alone genuinely can’t show you on its own.
Google Tag Manager
Not strictly an analytics tool in itself, but it’s the underlying plumbing that lets you fire off custom tracking events without needing a developer involved every single time you want to measure something new. If you’re serious about ROI tracking long-term, you need this set up correctly from the start.
Looker Studio
Google’s free dashboard-building tool. This is where you pull data together from GA4, Search Console, and other sources into one unified visual dashboard that doesn’t require anyone on the leadership team to log into five separate platforms just to understand what’s actually happening.
HubSpot
Combines CRM functionality, marketing automation, and content analytics all within one integrated platform. Particularly strong for tying content directly to closed deals, since the CRM and content tools already live together inside the same system without needing separate integration work.
Semrush
Genuinely strong for competitive research and keyword tracking specifically, plus it includes decent content ROI-adjacent reporting around organic traffic value that’s useful for broader strategy conversations.
Ahrefs
Widely considered the gold standard for backlink tracking and keyword ranking data specifically. Won’t tell you revenue directly on its own, but it’s essential for covering the SEO half of your overall ROI story properly.
Hotjar
Provides heatmaps and full session recordings that show you exactly where people are clicking, scrolling, and dropping off across your content pages. Genuinely useful for diagnosing why a piece of content isn’t converting well even when the traffic numbers look perfectly healthy on paper.
Microsoft Clarity
Basically a free alternative to Hotjar, offering heatmaps and session recordings without any price tag attached at all. Worth running alongside your paid tools rather than instead of them.
CRM Platforms
Salesforce. The enterprise standard for tracking leads all the way through to closed revenue, and pairing it carefully with UTM data lets you trace individual deals back to the specific content that started them.
HubSpot CRM. Tightly integrated with HubSpot’s broader content tools, making attribution noticeably easier if you’re already operating within that particular ecosystem.
Zoho CRM. A genuinely budget-friendly option that still offers solid lead source tracking capabilities for smaller teams without a massive software budget.
Marketing Automation Platforms
Tools like Marketo, ActiveCampaign, and Pardot let you build out full nurture sequences fed by your content, then track precisely which sequences and which specific pieces actually led to eventual conversions.
Comparison Table
$-$$-$-$
| Tool | Features | Pricing | Best For |
|---|---|---|---|
| GA4 | Traffic, conversions, ecommerce | Free | Everyone, baseline tracking |
| Search Console | Search performance | Free | SEO content ROI |
| Looker Studio | Dashboards | Free | Reporting to leadership |
| HubSpot | CRM + content + automation | Full-funnel attribution | |
| Semrush | Keyword + competitive research | SEO strategy | |
| Ahrefs | Backlinks + rankings | SEO strategy | |
| Hotjar | Heatmaps, recordings | Free-$$ | UX diagnosis |
| Salesforce | Enterprise CRM | $$$$ | Large sales teams |
How to Set Up Content ROI Tracking
This is the part where theory finally turns into actual practice. Here’s a genuinely step-by-step way to build this whole system out properly, starting from nothing.
Step 1: Define Business Goals
Before tracking a single thing, you need absolute clarity on what you’re actually trying to prove with all this measurement. Is the goal generating leads? Driving direct sales? Improving retention? Different goals require fundamentally different tracking setups behind the scenes, so this step genuinely can’t be skipped.
Step 2: Set KPIs
Pick the specific metrics from Chapter 7 that actually align tightly with your Step 1 goals. Don’t track every single metric just because the option exists in your dashboard — pick specifically the ones that genuinely answer your core business question.
Step 3: Configure Analytics
Get GA4 properly installed across your site, and make sure ecommerce or lead tracking is genuinely configured correctly, not just relying on the default pageview tracking that comes bundled out of the box automatically.
Step 4: Create Conversion Events
Define precisely what counts as a real conversion for your specific business — form submits, demo bookings, completed purchases — and set each of these up as trackable events inside your GA4 property.
Step 5: UTM Tracking
Every single promotional link you share anywhere, whether it’s inside an email, a social post, or a paid ad campaign, needs proper UTM parameters attached to it. Without this in place consistently, you’re genuinely flying blind on where your traffic actually originated from.
Step 6: Goal Tracking
Connect your defined conversion events to actual measurable goals inside your analytics platform, so you can view conversion rates broken down by content source, rather than just seeing raw traffic numbers with no context attached.
Step 7: CRM Integration
Connect your analytics tools and marketing platforms directly to your CRM system, so leads can be tracked all the way through to closed revenue, rather than just to the point where they initially fill out a form and disappear from view.
Step 8: Dashboard Creation
Build a Looker Studio dashboard, or something similar, that pulls all of this scattered data together into one place a non-marketer could realistically glance at and understand within about a minute or two.
Step 9: Monthly Reporting
Set a recurring cadence to actually sit down and review this data regularly. Tracking data that nobody ever looks at is genuinely worthless no matter how well it’s built. Monthly tends to be the right frequency here — weekly often ends up too noisy to act on, while quarterly moves too slowly to catch emerging problems early enough to matter.
Step 10: Optimization
Use everything you’re learning from this data to actually change real behavior going forward — kill off underperforming content types entirely, double down harder on whatever’s demonstrably working, and refresh older content that’s slowly losing its rankings over time.
How to Measure ROI for Different Content Types
Not every content format serves the same purpose. A blog post may attract organic traffic, while a webinar generates qualified leads, and an email campaign nurtures existing prospects. Because each content type supports different stages of the buyer journey, businesses should evaluate ROI using metrics that align with the specific goals of that format.
Blog Posts
Metrics: Organic traffic volume, time on page, conversion rate, and total leads generated from the specific piece.
Formula: Same basic ROI formula applies here, with cost including writing, editing, and any promotion spend tied to the specific post.
Example: A 1,500-word blog post costing $400 to produce that generates 8 qualified leads and 2 eventual customers at $600 each nets $1,200 in revenue. ROI = ((1,200-400)/400) × 100 = 200%.
Landing Pages
Metrics: Conversion rate is really the only metric that genuinely matters here. Landing pages exist specifically to convert visitors, not to inform or entertain them, so traffic arriving without conversions attached is basically a failed landing page regardless of how impressive the raw visitor count looks.
Videos
Metrics: Watch time, completion rate, and click-through rate to a landing page or product page afterward. Video production costs run considerably higher than most other formats, so ROI thresholds need to be set with that reality in mind, rather than comparing directly against blog post ROI percentages on an apples-to-apples basis.
Email Newsletters
Metrics: Open rate, click-through rate, and ultimately the conversion rate that follows from those clicks. Because production cost stays relatively low for email content, it tends to post genuinely strong ROI numbers compared to other formats requiring more resources.
Case Studies
Metrics: Sales influence and overall deal velocity throughout the sales cycle. Case studies rarely drive much traffic on their own merits — they function primarily as a closing tool, so their real ROI shows up in shortened sales cycles and higher close rates, rather than showing up clearly in any traffic report.
Whitepapers
Metrics: Download rate and, more importantly, overall lead quality. Whitepapers gate the content behind a form submission, which trades off raw traffic volume in exchange for genuine lead capture, so measure them specifically by lead quality rather than by simple page visit counts.
eBooks
Metrics: Similar measurement approach to whitepapers, but ebooks often serve earlier in the funnel and should be measured by how effectively they nurture leads toward the next stage, rather than by expecting immediate conversion right away.
Podcasts
Metrics: Listen counts, subscriber growth over time, and any trackable click-throughs coming from the show notes themselves. Podcast ROI is notoriously difficult to pin down with precision, so many teams reasonably treat podcasting as a longer-term brand-building investment with an extended measurement horizon attached.
Webinars
Metrics: Registration-to-attendance rate, followed by attendance-to-conversion rate afterward. Webinars can actually be measured with real precision, since attendees are usually tracked individually all the way through to their eventual sales outcomes.
Social Media Content
Metrics: Engagement rate, click-throughs back to owned content, and any directly trackable conversions coming from social-sourced traffic specifically. Much of social’s real value gets buried in dark social sharing that’s genuinely hard to measure directly, so treat the visible metrics you do have as a floor estimate, not the complete picture.
Infographics
Metrics: Shares, backlinks earned over time, and referral traffic generated as a result. Infographics function primarily as a link-building and awareness tool, so their real ROI often shows up indirectly through improved SEO rankings on other content, rather than through direct conversions attributable to the infographic itself.
Comparison Table
| Content Type | Primary Metric | Typical Production Cost | ROI Timeline |
|---|---|---|---|
| Blog Post | Organic leads | Low-Medium | 3-6 months |
| Landing Page | Conversion rate | Low | Immediate |
| Video | Completion rate | High | Medium-term |
| Newsletter | Click-through rate | Low | Immediate |
| Case Study | Deal velocity | Medium | Immediate-Long |
| Whitepaper | Lead quality | Medium | Medium-term |
| Podcast | Listener growth | Medium-High | Long-term |
| Webinar | Registration-to-close | Medium | Immediate |
| Infographic | Backlinks earned | Medium | Long-term |
How SEO Contributes to Content Marketing ROI
Here’s something that genuinely separates SEO content from basically every other marketing channel available: it compounds over time. Paid ads stop delivering results the second you stop paying for them, full stop. SEO content, once it actually ranks, keeps generating traffic and revenue for years afterward with minimal ongoing cost required to sustain it.
Organic traffic growth builds slowly but steadily over time. Unlike a paid campaign that spikes dramatically and then dies off immediately, organic content gains real momentum month over month as it gradually climbs through search rankings.
Evergreen traffic is the term used for content that stays genuinely relevant and continues ranking well long after its original publication date. A well-written guide covering a topic that doesn’t change much over time can keep bringing in qualified leads two, three, even five years after it was originally published.
Reduced advertising costs happen naturally as growing organic traffic replaces what you’d otherwise need to pay for through paid ads instead. This is genuinely one of the strongest arguments for content ROI that finance teams tend to respond to well, since it directly lowers customer acquisition cost over time.
Compounding returns show up specifically when you build content clusters around a particular topic area. Each new piece strengthens all the others through internal linking, and your overall domain authority grows steadily, making every future piece of content rank a little faster than it would have entirely on its own.
Topical authority is what Google starts recognizing once you’ve published comprehensively across a given subject area. Sites that cover a topic deeply and thoroughly tend to outrank sites with just one or two scattered posts on that same subject, even when those isolated posts are individually well-written.
Internal linking connects your content pieces together so both human users and search engine crawlers can navigate easily between related content, spreading authority around your site and keeping visitors engaged for longer sessions.
Content clusters are groups of related articles built around a central pillar page, similar to this one, with supporting posts linking back to it consistently. This overall structure tends to perform significantly better in search rankings than isolated, disconnected articles published without any real organizing structure.
Featured snippets put your content directly at the very top of the results page, often earning clicks even from people who wouldn’t normally scroll down far enough to reach your standard ranking position otherwise.
Brand visibility grows steadily as you rank for more and more terms across your entire industry, meaning people encounter your brand name repeatedly even before they’re ready to actually buy anything, which shortens the trust-building phase considerably once they finally are ready.
Real example. A B2B company we can reference generically here published a content cluster centered around “employee onboarding software” — one central pillar page plus twelve supporting articles surrounding it. Month one, almost no organic traffic showed up at all. Month six, the cluster was generating around 4,000 organic visits monthly. Month twelve, that number hit roughly 11,000, with conversion rates steadily improving as rankings climbed higher for increasingly high-intent search terms. Total cost for building the entire cluster over the year came to roughly $22,000. Revenue attributable by month twelve reached around $95,000, and it was still climbing steadily without any additional spend required beyond routine maintenance. That’s the compounding effect actually playing out in real numbers.
Advanced Strategies to Increase Content Marketing ROI
Content Repurposing. Take one well-researched piece and turn it into a video, an infographic, a LinkedIn carousel, and an email series. You multiply the total return on your original research investment without multiplying the underlying cost proportionally at all.
Content Clusters. Already covered thoroughly in Chapter 12, but genuinely worth repeating here as a deliberate strategy in its own right — clustering related content together around pillar pages compounds SEO returns significantly over time.
Topic Authority. Deliberately choosing to go deep on a smaller, focused number of topics rather than spreading yourself shallowly across everything possible. This builds real credibility that both search engines and human readers consistently reward.
AI-Assisted Content Optimization. Using tools to identify existing content gaps, suggest structural improvements, or speed up the research phase, freeing up human writers to focus their time on the parts that genuinely require real judgment and subject-matter expertise.
Conversion Rate Optimization. Regularly A/B testing headlines, CTAs, and page layouts specifically on your highest-traffic content to squeeze meaningfully more conversions out of traffic you’re already receiving anyway.
Personalization. Showing different CTAs or content recommendations depending on exactly where a visitor sits within their journey, rather than treating every single visitor completely identically regardless of context.
Email Nurture Sequences. Using content strategically to warm up leads gradually over time, instead of unrealistically expecting a single blog post to close a sale entirely on its own in one shot.
Interactive Content. Calculators, quizzes, and assessment tools tend to generate significantly higher engagement and lead capture rates compared to static content, largely because people genuinely enjoy getting personalized results tailored to them.
Lead Magnets. Strategic gated content offered at precisely the right moment within a reader’s journey, exchanged fairly for contact information that then feeds directly into your nurture and sales process.
A/B Testing. Systematically testing genuine variations of headlines, CTAs, and page layouts, rather than simply guessing at what might perform better based on gut feeling alone.
Content Refresh. Regularly updating older content that’s losing rankings or relevance over time, often producing meaningfully better ROI per dollar spent compared to creating something entirely new from scratch.
Automation. Using workflow tools to automatically trigger follow-up content or emails based specifically on a visitor’s individual behavior, rather than manually managing every single touchpoint by hand.
Predictive Analytics. Using historical performance data to forecast which content topics or formats are genuinely likely to perform well before you actually invest time and money into producing them.
Revenue Attribution. Building out the full tracking infrastructure covered earlier in Chapter 10 so every single strategy listed above can actually be measured and validated properly, rather than simply assumed to be working based on hope.
How to Build Your Content Marketing ROI Dashboard
A dashboard that nobody actually looks at is a genuine waste of all the time it took to build it in the first place. The real goal here is creating something a CEO could glance at for thirty seconds and immediately understand exactly how content is performing across the business.
The overall flow should move logically from one stage to the next: Traffic feeds directly into Engagement, which feeds into Leads, which feeds into Conversions, which feeds into Revenue, which ultimately rolls all the way up into a single clear ROI figure at the top.
Recommended widgets should include a top-line ROI percentage displayed front and center, a traffic-by-source breakdown chart, a leads-by-content-type visualization, a top-performing-content leaderboard ranked by revenue attributed, and a cost-versus-revenue trend line covering the past twelve months of activity.
Reporting frequency should land on monthly for the core dashboard review meeting, paired with a lighter weekly check-in specifically on traffic and leads so emerging problems get caught early rather than discovered a full month too late. Quarterly, run a deeper strategic review session where you actually decide, based on the data, what to kill entirely and what to scale up further.
Real-Life Content Marketing ROI Case Studies
Examining real-world examples demonstrates how strategic content marketing delivers measurable business results. These case studies highlight different industries and approaches while showcasing how content contributes directly to growth, lead generation, and revenue.
Case Study 1: B2B SaaS Company
Strategy: Built a content cluster around a specific pain point within their industry, supported by comparison pages and a gated ROI calculator tool designed to capture leads.
Results: Organic traffic to the cluster grew from nearly zero to over 15,000 monthly visits within just ten months of consistent publishing.
ROI: Total content spend across the entire year came to roughly $30,000. Attributed pipeline reached $410,000, with actual closed revenue landing around $140,000 by year’s end. That’s an ROI north of 350%, and the trajectory was still climbing steadily when the case was last reviewed.
Case Study 2: eCommerce Brand
SEO content: A skincare brand built out detailed ingredient guides and buying comparison content specifically targeting long-tail search terms that competitors were largely ignoring in their own strategies.
Revenue growth: Organic traffic to product-adjacent content drove a 22% increase in organic-attributed revenue year over year, with the underlying content requiring roughly $18,000 in total investment against nearly $95,000 in attributed sales generated.
Case Study 3: Local Service Business
Blogging: A regional HVAC company started publishing seasonal maintenance guides and cost-comparison articles specifically targeting local search terms relevant to their service area.
Lead generation: Within six months, organic search became their second-largest lead source overall, right behind referrals, generating around 40 qualified leads a month at a fraction of what they were previously paying for local paid search ads covering the same territory.
Case Study 4: Agency Client
Content optimization: Rather than producing brand-new content, an agency focused entirely on refreshing an existing client’s underperforming older posts — updating outdated statistics, improving overall structure, and strengthening weak CTAs throughout.
Conversion improvement: Conversion rates on the refreshed pages jumped by roughly 60% on average within just three months, with almost no new production cost involved at all, making this one of the highest ROI moves found anywhere across this entire case study set.
Future Trends in Content ROI Measurement
AI-powered analytics are steadily getting better at surfacing patterns that humans routinely miss, flagging which content is quietly underperforming well before it becomes an obvious, glaring problem visible to everyone.
Predictive attribution models are starting to forecast which content pieces are genuinely likely to drive future revenue based on early engagement signals, rather than requiring teams to wait months to eventually find out the actual results.
Cookieless tracking is becoming increasingly necessary as major browsers phase out third-party cookies entirely, pushing marketers steadily toward first-party data collection strategies built directly into their own content and email systems instead.
First-party data — meaning information you collect directly from your own audience rather than sourcing it through third parties — is fast becoming the genuine backbone of reliable attribution as privacy regulations continue tightening globally.
Revenue intelligence platforms are increasingly connecting marketing content directly to sales outcomes in real time now, rather than requiring tedious manual reconciliation between separate marketing and sales data sets after the fact.
Marketing mix modeling is making a real comeback as a way to measure overall channel effectiveness without relying entirely on individual-level tracking, which keeps getting harder as privacy restrictions continue to grow more strict.
Cross-channel attribution tools are steadily improving at stitching together a customer’s complete journey across email, social, search, and direct visits into one single coherent picture worth analyzing.
Generative AI and content performance forecasting are starting to let teams predict, before ever publishing anything, roughly how a piece of content is likely to perform based on historical patterns pulled from similar past content, cutting down meaningfully on wasted production spend going forward.
Conclusion
Measuring content marketing ROI isn’t optional anymore if you genuinely want your content program to survive budget season year after year. Traffic charts and social shares feel good to look at in a slide deck, but they don’t actually answer the question that matters most — did this content genuinely make the business money, whether directly or indirectly through the broader funnel.
The businesses that get this right aren’t necessarily the ones publishing the largest volume of content. They’re the ones who know exactly which specific pieces are working, which ones need refreshing soon, and which ones should quietly get retired from the site entirely. That kind of clarity only comes from tracking the full picture properly: costs, attribution, revenue, and everything connecting them, not just the vanity numbers that happen to show up first when you open your analytics dashboard each morning.
Success in content marketing genuinely shouldn’t be measured by how many articles got published this quarter alone. It should be measured by how many of them actually contributed meaningfully to leads, revenue, and long-term business growth that shows up clearly on a real P&L statement. Traffic is a means to an end here, never the end itself.
So here’s the honest push to close this out: go audit your current content strategy sometime this week. Pull up your last twelve months of publishing history and ask, piece by piece, what did this specific one actually generate for the business? Build the dashboard outlined back in Chapter 15 if you don’t already have one running. Set up the tracking infrastructure from Chapter 10 if it’s not properly in place yet. The underlying data is usually sitting right there already, half-connected across five different disconnected tools, genuinely waiting for someone to finally pull it all together and make a real decision based on what it’s actually saying.
That’s the real difference separating companies that just “do content marketing” from companies that actually make content marketing work for their bottom line. It’s not really about writing talent at the end of the day. It’s about the willingness to measure honestly and act decisively on what the numbers genuinely say, even when that means killing content you were personally proud of writing.
Frequently Asked Questions
What is content marketing ROI?
It’s the measurable return you get from content relative to what you spent producing and distributing it, expressed cleanly as a percentage using the formula ((Revenue – Cost) / Cost) × 100. It boils the entire concept of content success down to one comparable number finance teams can actually work with.
How do you calculate content marketing ROI?
Add up every single cost tied to a piece or campaign of content, including production, design, promotion, and staff time involved. Then track the revenue that content genuinely generated, either directly or through assisted conversions, and plug both numbers into the ROI formula to get your final percentage.
What is a good content marketing ROI?
There’s no single universal number that applies everywhere, but many marketers consider anything above 100%, meaning the content more than paid for itself, a genuinely solid result worth celebrating. SEO content that’s had real time to mature often posts 200% or higher, while newer or more experimental content types might sit noticeably lower initially before improving.
How long does it take to see ROI from content marketing?
This depends heavily on the specific content type involved. Email content and bottom-funnel landing pages can show returns almost immediately after launch. SEO-driven blog content typically needs three to six months to start ranking meaningfully, and often keeps improving steadily for a year or more beyond that initial period.
Which KPIs matter most?
It genuinely depends on the content’s specific role within your overall funnel. Top-of-funnel content should be judged mainly on traffic and engagement, middle-funnel content on leads actually generated, and bottom-funnel content on real conversions and revenue produced. Judging every single piece by the exact same metric is a genuinely common mistake worth avoiding.
How do you measure blog ROI?
Track organic traffic arriving at the post, the conversion rate of that traffic into actual leads, and then follow those leads carefully through to closed revenue using your CRM system. Subtract total production and promotion cost from that revenue figure and run it through the basic ROI formula.
Can brand awareness be included in ROI?
Sort of, but you need to be careful about how. Brand awareness itself doesn’t carry a clean dollar value attached directly, but you can track proxy metrics like branded search volume growth or rising direct traffic numbers, treating those as leading indicators even if you don’t fold them directly into a hard ROI percentage calculation.
What tools help measure content ROI?
Google Analytics 4 and Search Console cover the foundational traffic and search data needed, a CRM like HubSpot or Salesforce handles revenue tracking properly, and a dashboard tool like Looker Studio pulls it all together into something genuinely reviewable by leadership.
How often should ROI be measured?
Monthly works well for a solid operational view of things, paired with a deeper quarterly review to make bigger strategic calls about what to scale up or cut entirely. Measuring too frequently on slower-moving SEO content just introduces unnecessary noise into your decision-making process.
What is the difference between ROI and ROAS?
ROAS, meaning return on ad spend, measures revenue generated specifically per dollar spent on advertising alone. ROI is broader in scope and accounts for total cost, including production, staff time, and tools, not just ad spend narrowly. Content marketing ROI is almost always calculated as a full ROI figure rather than a narrow ROAS one specifically.
How do attribution models affect ROI calculations?
Significantly, and often more than people expect. The exact same customer journey can show a top-of-funnel blog post as either highly valuable or basically irrelevant, depending entirely on whether you’re using first-click, last-click, or a more balanced model like position-based or data-driven attribution instead.
How can small businesses measure content ROI with a limited budget?
Start with the free tools available — GA4, Search Console, and a simple spreadsheet tracking cost against leads generated over time. You genuinely don’t need an enterprise CRM to get started; you need consistent tracking of where your leads originate and a simple way to tie a handful of those back to closed sales manually if necessary.
How do you measure ROI for SEO content?
Track organic traffic growth over time, keyword ranking improvements, and then the conversion rate of that organic traffic into actual leads and sales. Because SEO content compounds gradually, ROI calculations should generally be run over a longer measurement window, six to twelve months minimum, rather than judged harshly after just a few weeks.
Which content type delivers the highest ROI?
It genuinely varies quite a bit by business, but generally email content and bottom-of-funnel landing pages post the fastest and highest percentage returns, since production cost stays low and the audience receiving them is already warm. SEO content tends to post the best long-term cumulative ROI overall because of its compounding nature, even if the early months look fairly unremarkable at first glance.
How can AI improve content ROI measurement?
AI tools are steadily getting better at pattern recognition across large data sets, surfacing which topics, formats, and structures correlate reliably with higher conversion rates, often before you’ve even manually crunched the numbers yourself, and increasingly at forecasting likely performance before content ever gets published in the first place.