


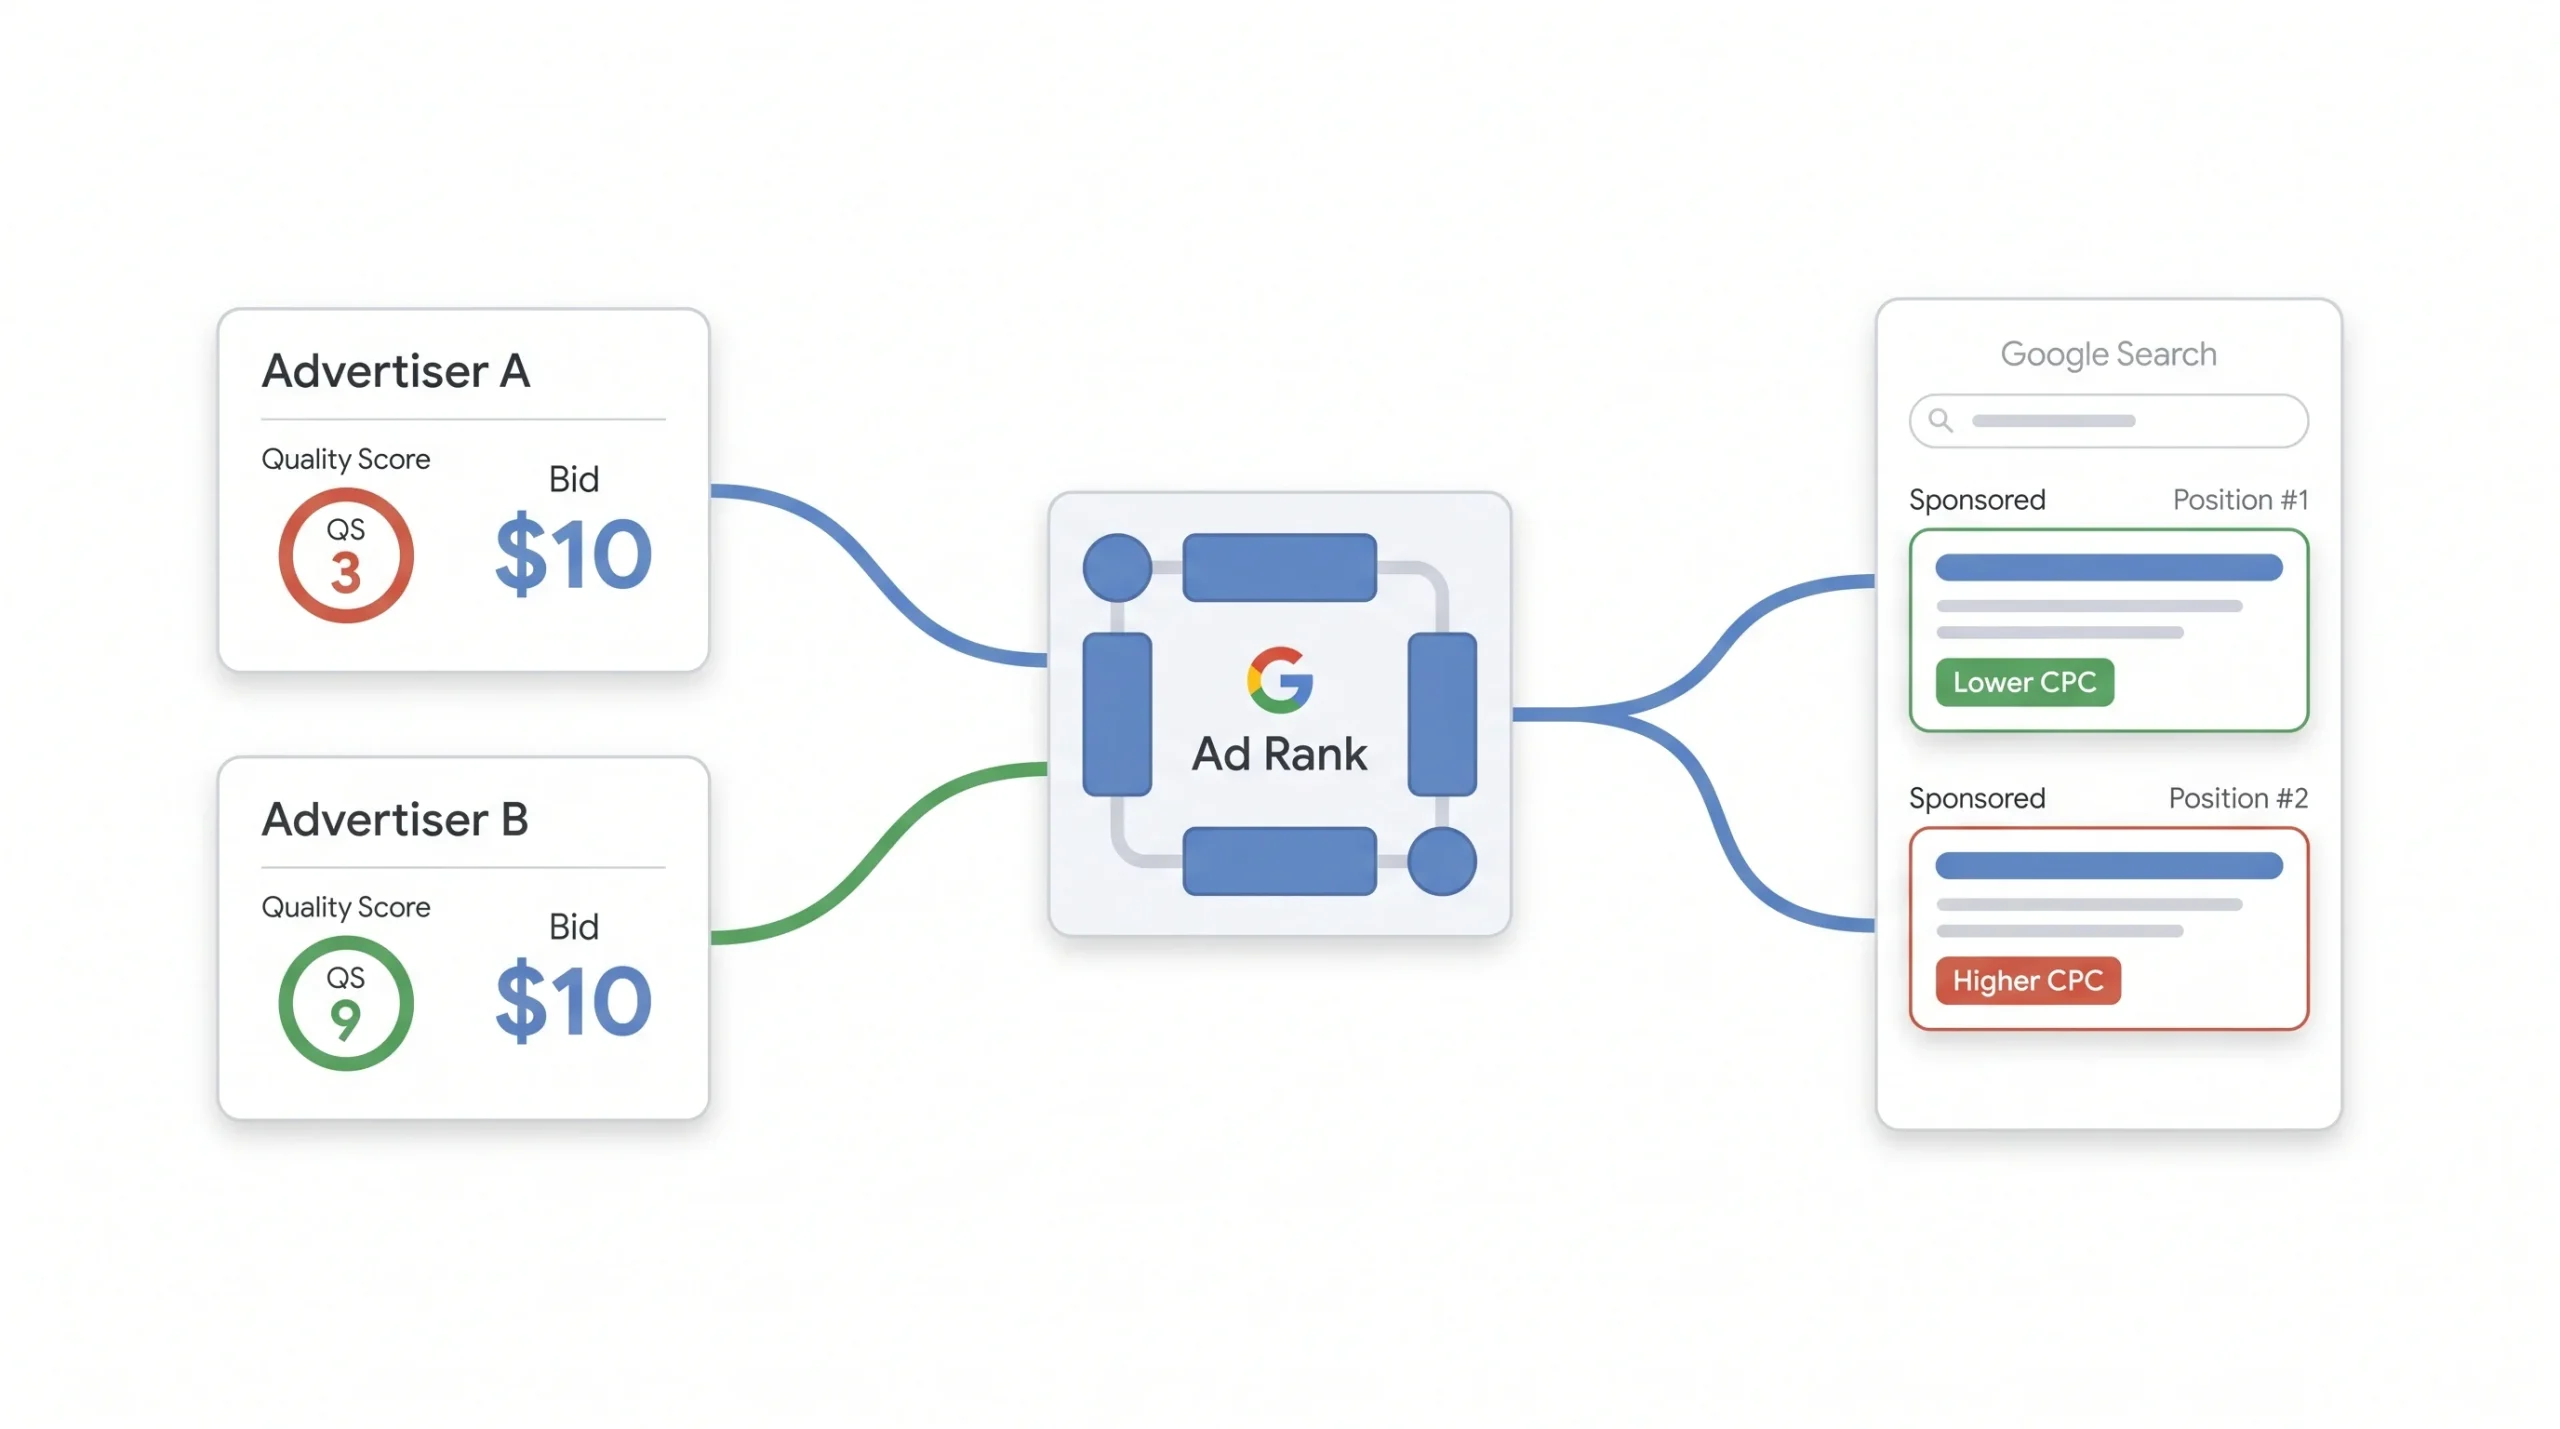
Here’s a scenario that trips up almost everyone running their first few Google Ads campaigns. Two advertisers are bidding on the exact same keyword. Same max CPC, give or take a few cents. One of them is paying half of what the other pays for the same click, in a similar position. Nobody changed the bid. Nothing shady happened. The difference is Quality Score, and once you understand what it actually is, this stops feeling like some mysterious Google black box and starts feeling like the most useful diagnostic tool in your entire account.
A keyword sitting at a Quality Score of 3 can cost up to 400% more per click than one sitting at the average score of 5. Flip that around, and a keyword at 10 can cut your CPC by roughly half compared to that same baseline. Same search term, same auction, wildly different price tag. That gap is the whole reason this metric deserves your attention, even though Google itself doesn’t talk about it as much as it used to.
This post walks through what Quality Score actually is, why it exists, what the three components mean in plain language, and exactly what to do to fix a low one. No fluff, no vague “best practices,” just the mechanics and the fixes.
What Is Quality Score in Google Ads?
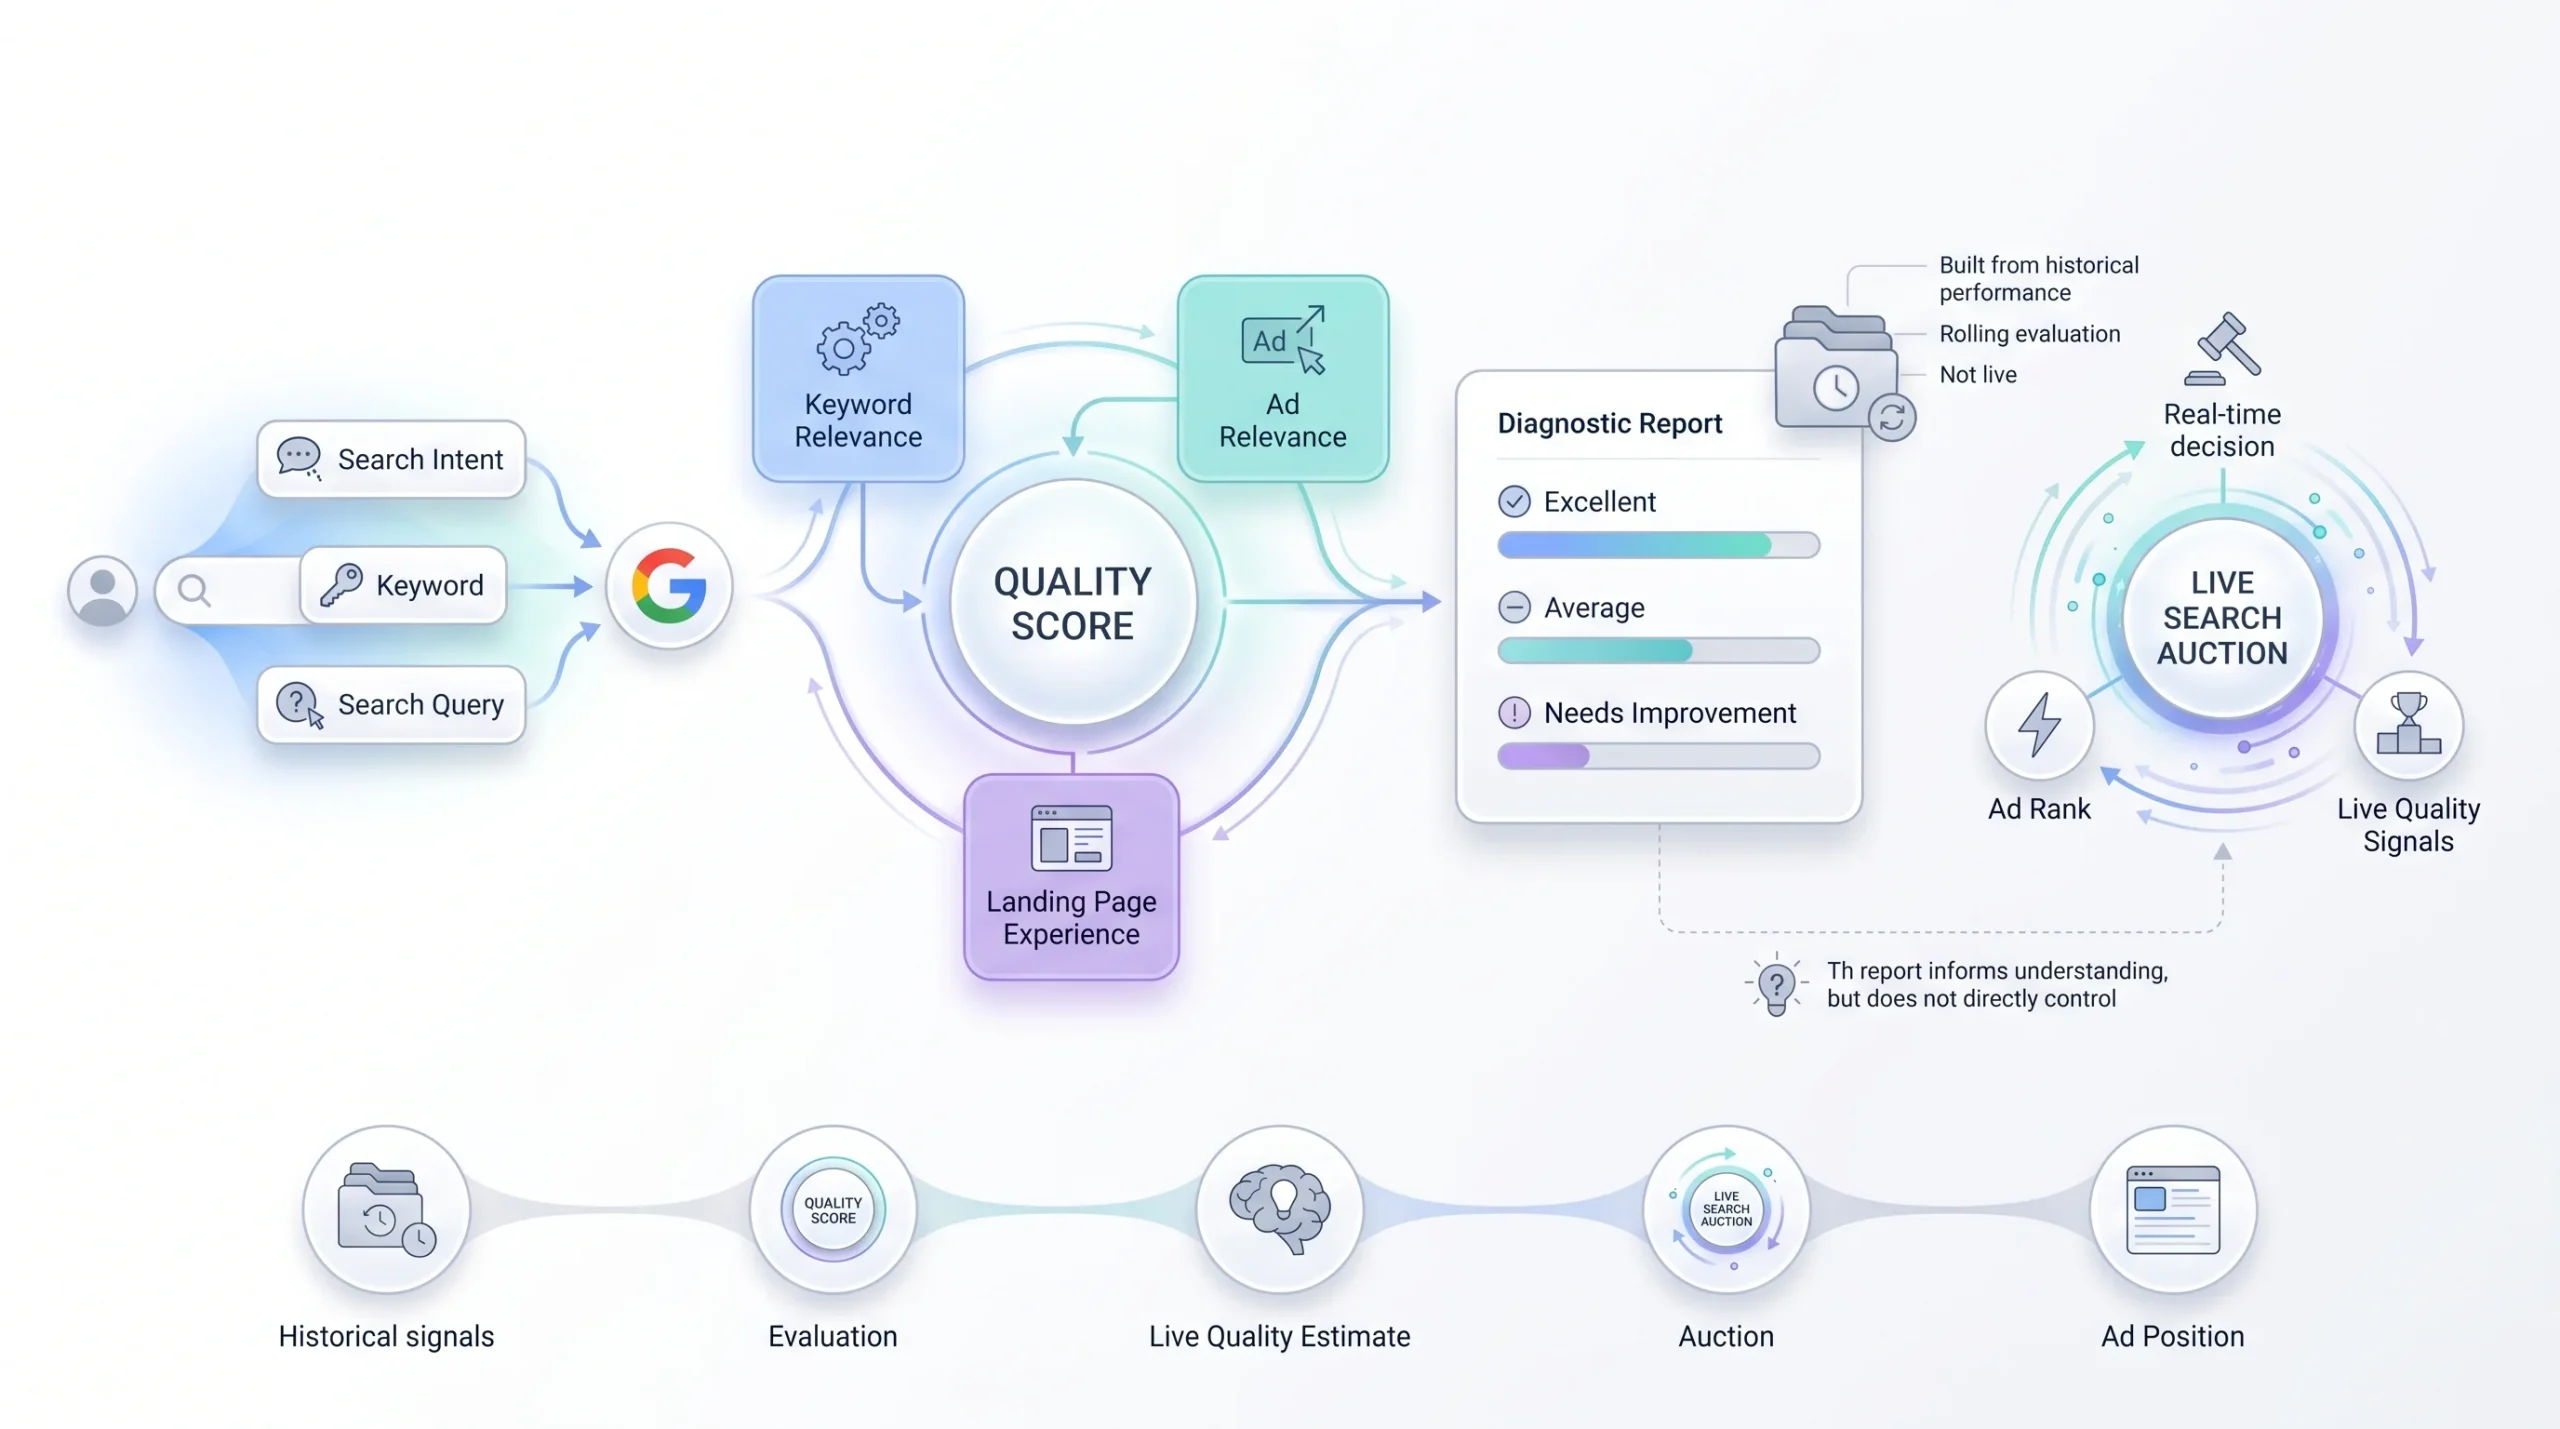
Quality Score is a 1-to-10 rating Google assigns to each keyword in your Search campaigns. It’s Google’s estimate of how relevant and useful your ad and your landing page are for people searching that particular term. Higher number, better estimate. Lower number, worse estimate. That’s the whole idea, stripped down.
A few things about it that trip beginners up constantly, so let’s get them out of the way early.
It only applies at the keyword level, and only inside Search campaigns. Your Display ads don’t get one. Your Shopping campaigns don’t get one. Performance Max doesn’t get one either. If you’re only running non-Search campaign types, this whole metric is basically invisible to you, which is honestly a separate conversation about how Google is quietly de-emphasizing manual keyword control across the board.
It’s also not a live number. It’s built from roughly the last 90 days of exact-match search data for that keyword. So when you check your Quality Score today, you’re looking at a snapshot of recent history, not what’s happening in the auction right this second.
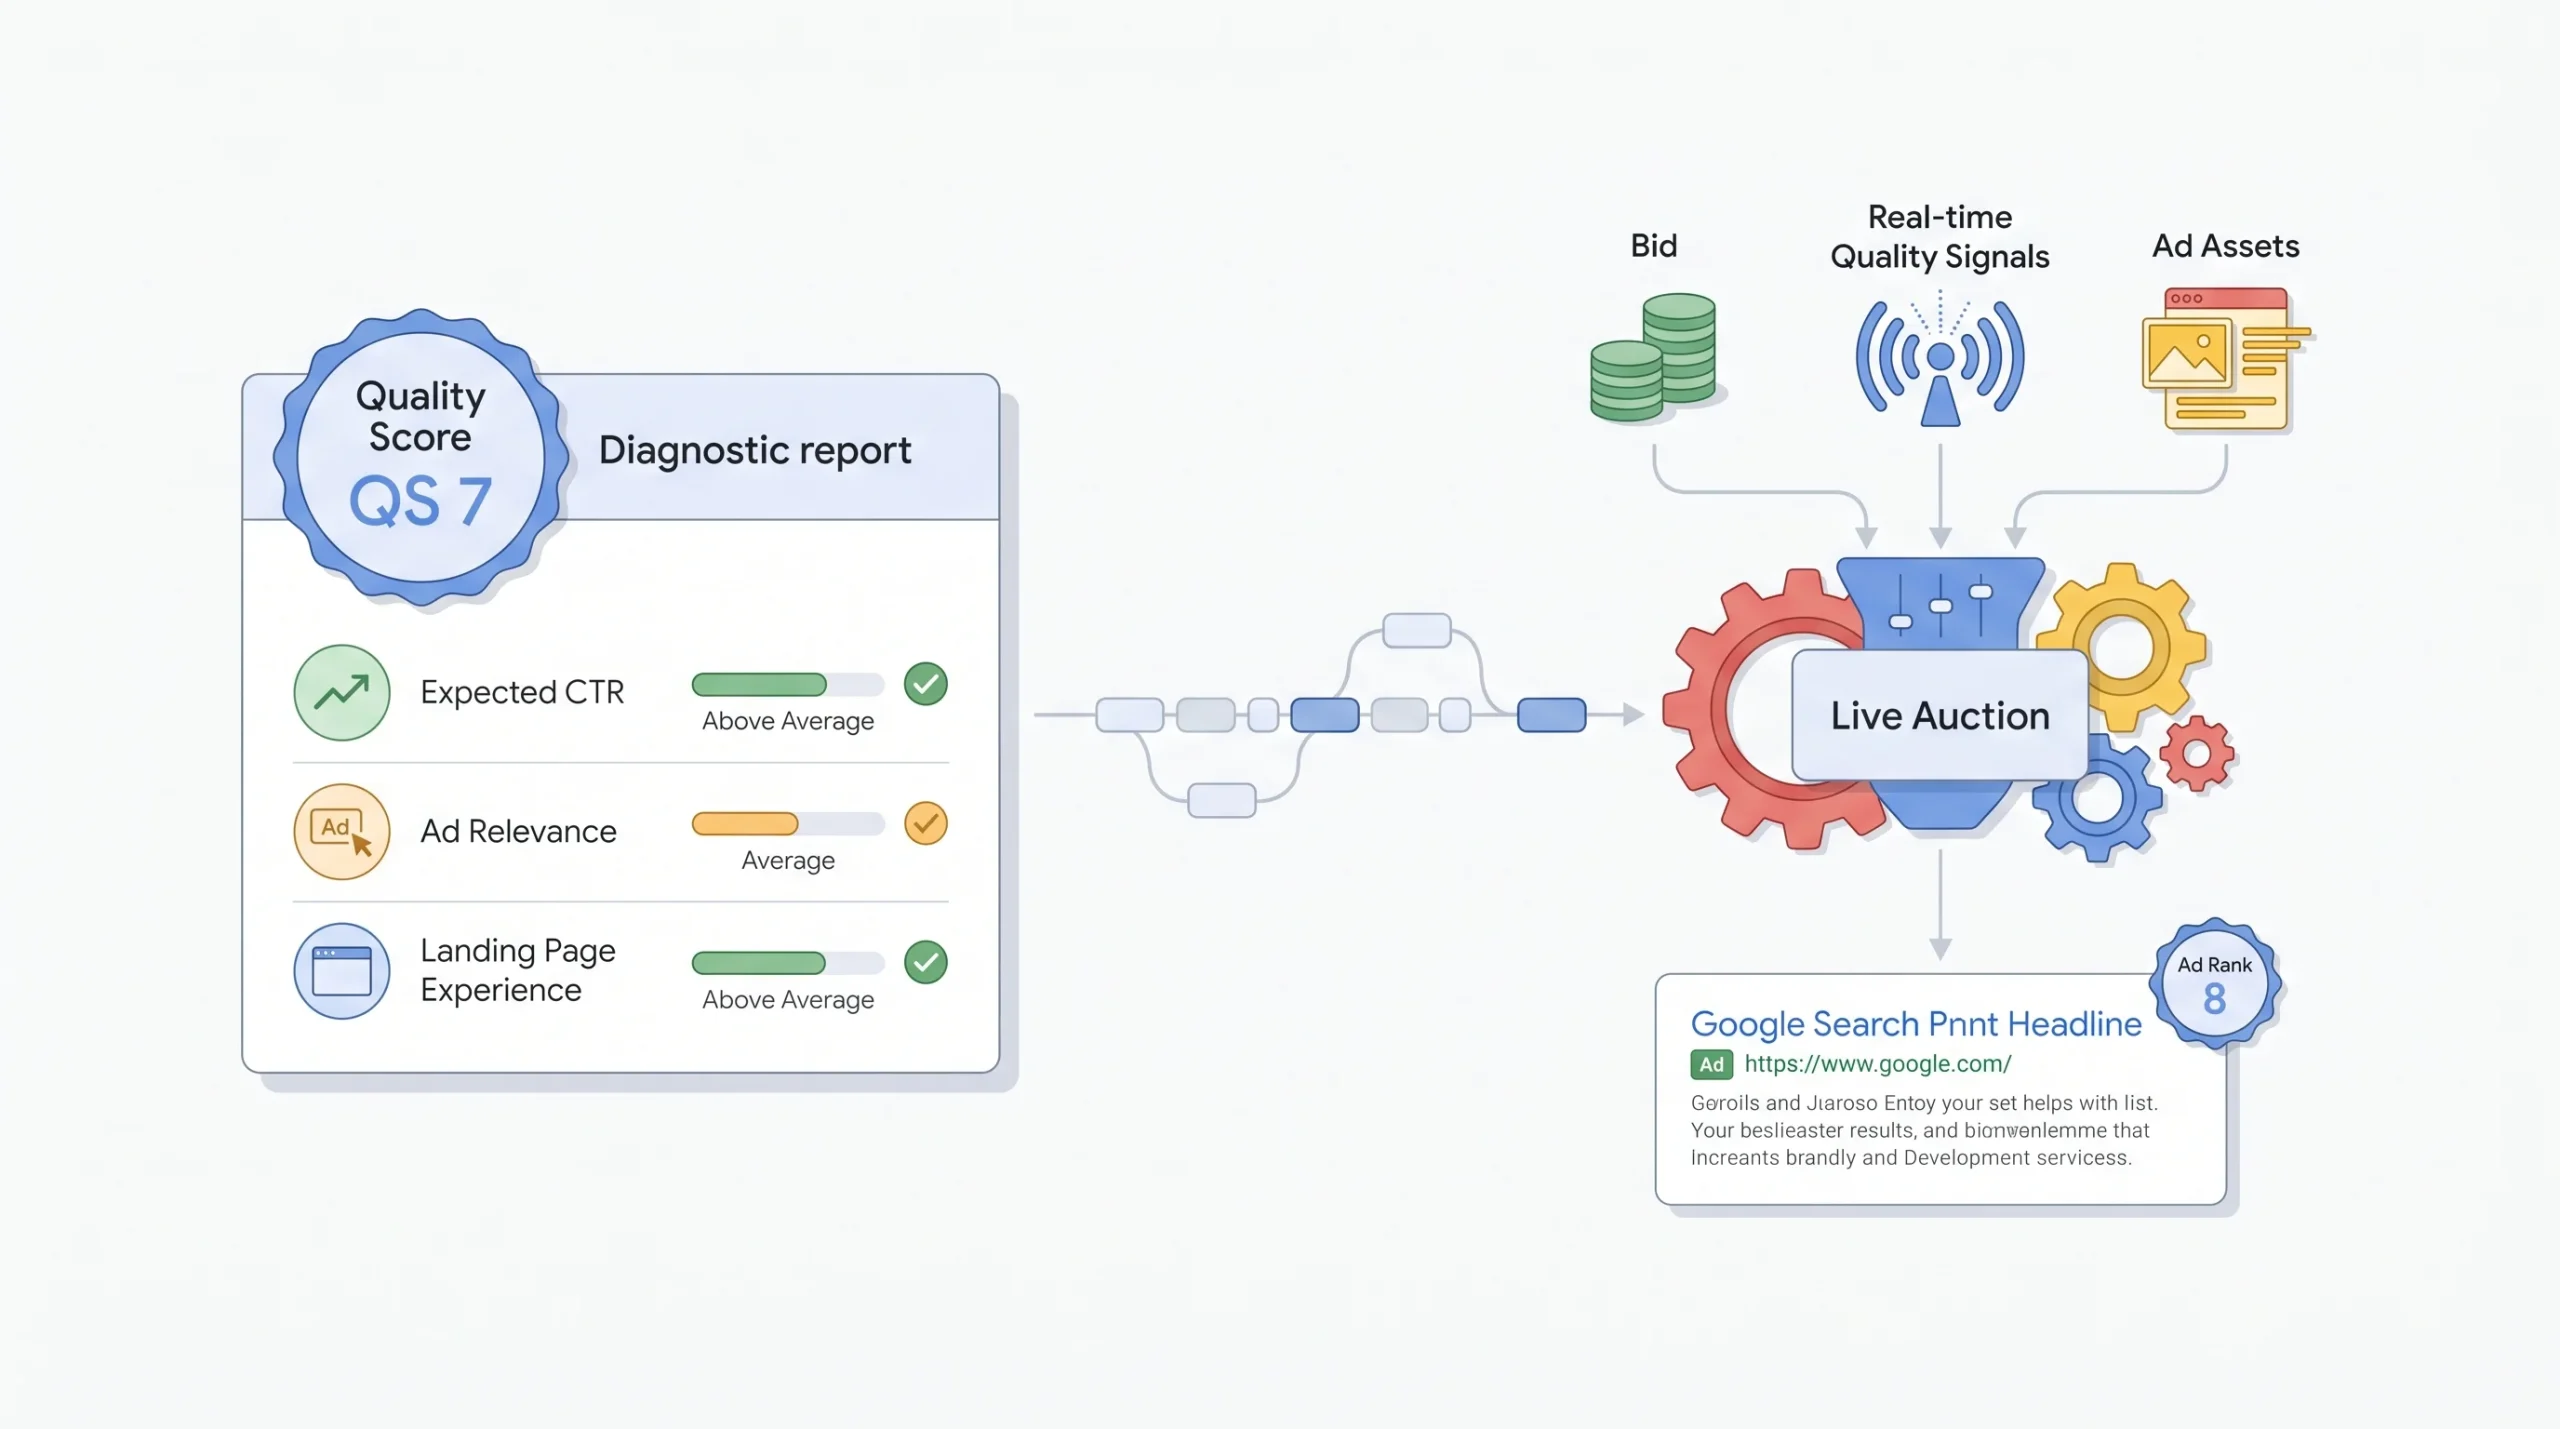
And here’s the part that actually changes how you should react to it: Google has said directly that Quality Score is not something the auction uses in real time. It’s a diagnostic. There’s a separate, live quality estimate built from the same underlying signals, and that’s what actually plugs into Ad Rank at the moment your ad competes for a spot. The visible 1-to-10 score in your dashboard is a lagging report card, not the live scoreboard.
That distinction matters more than people give it credit for. If you glance at your account tomorrow and see a keyword dropped from a 6 to a 5 overnight, don’t go rewrite three ads in a panic. That single-point wobble is often just normal movement in a trailing window, not a five-alarm fire.
| Attribute | Detail |
|---|---|
| Scale | 1 (poor) to 10 (excellent) |
| Assigned at | Keyword level, Search campaigns only |
| Data window | Roughly the last 90 days of exact-match search data |
| Used in the real-time auction? | No. It’s a diagnostic. A live quality estimate built from the same signals feeds the actual auction |
| Average score across accounts | Roughly 5 to 6 |
| What counts as “good” | 7 and above |
| Where to find it | Keywords tab, then Columns, then Modify columns, then Quality Score |
Why Quality Score Exists
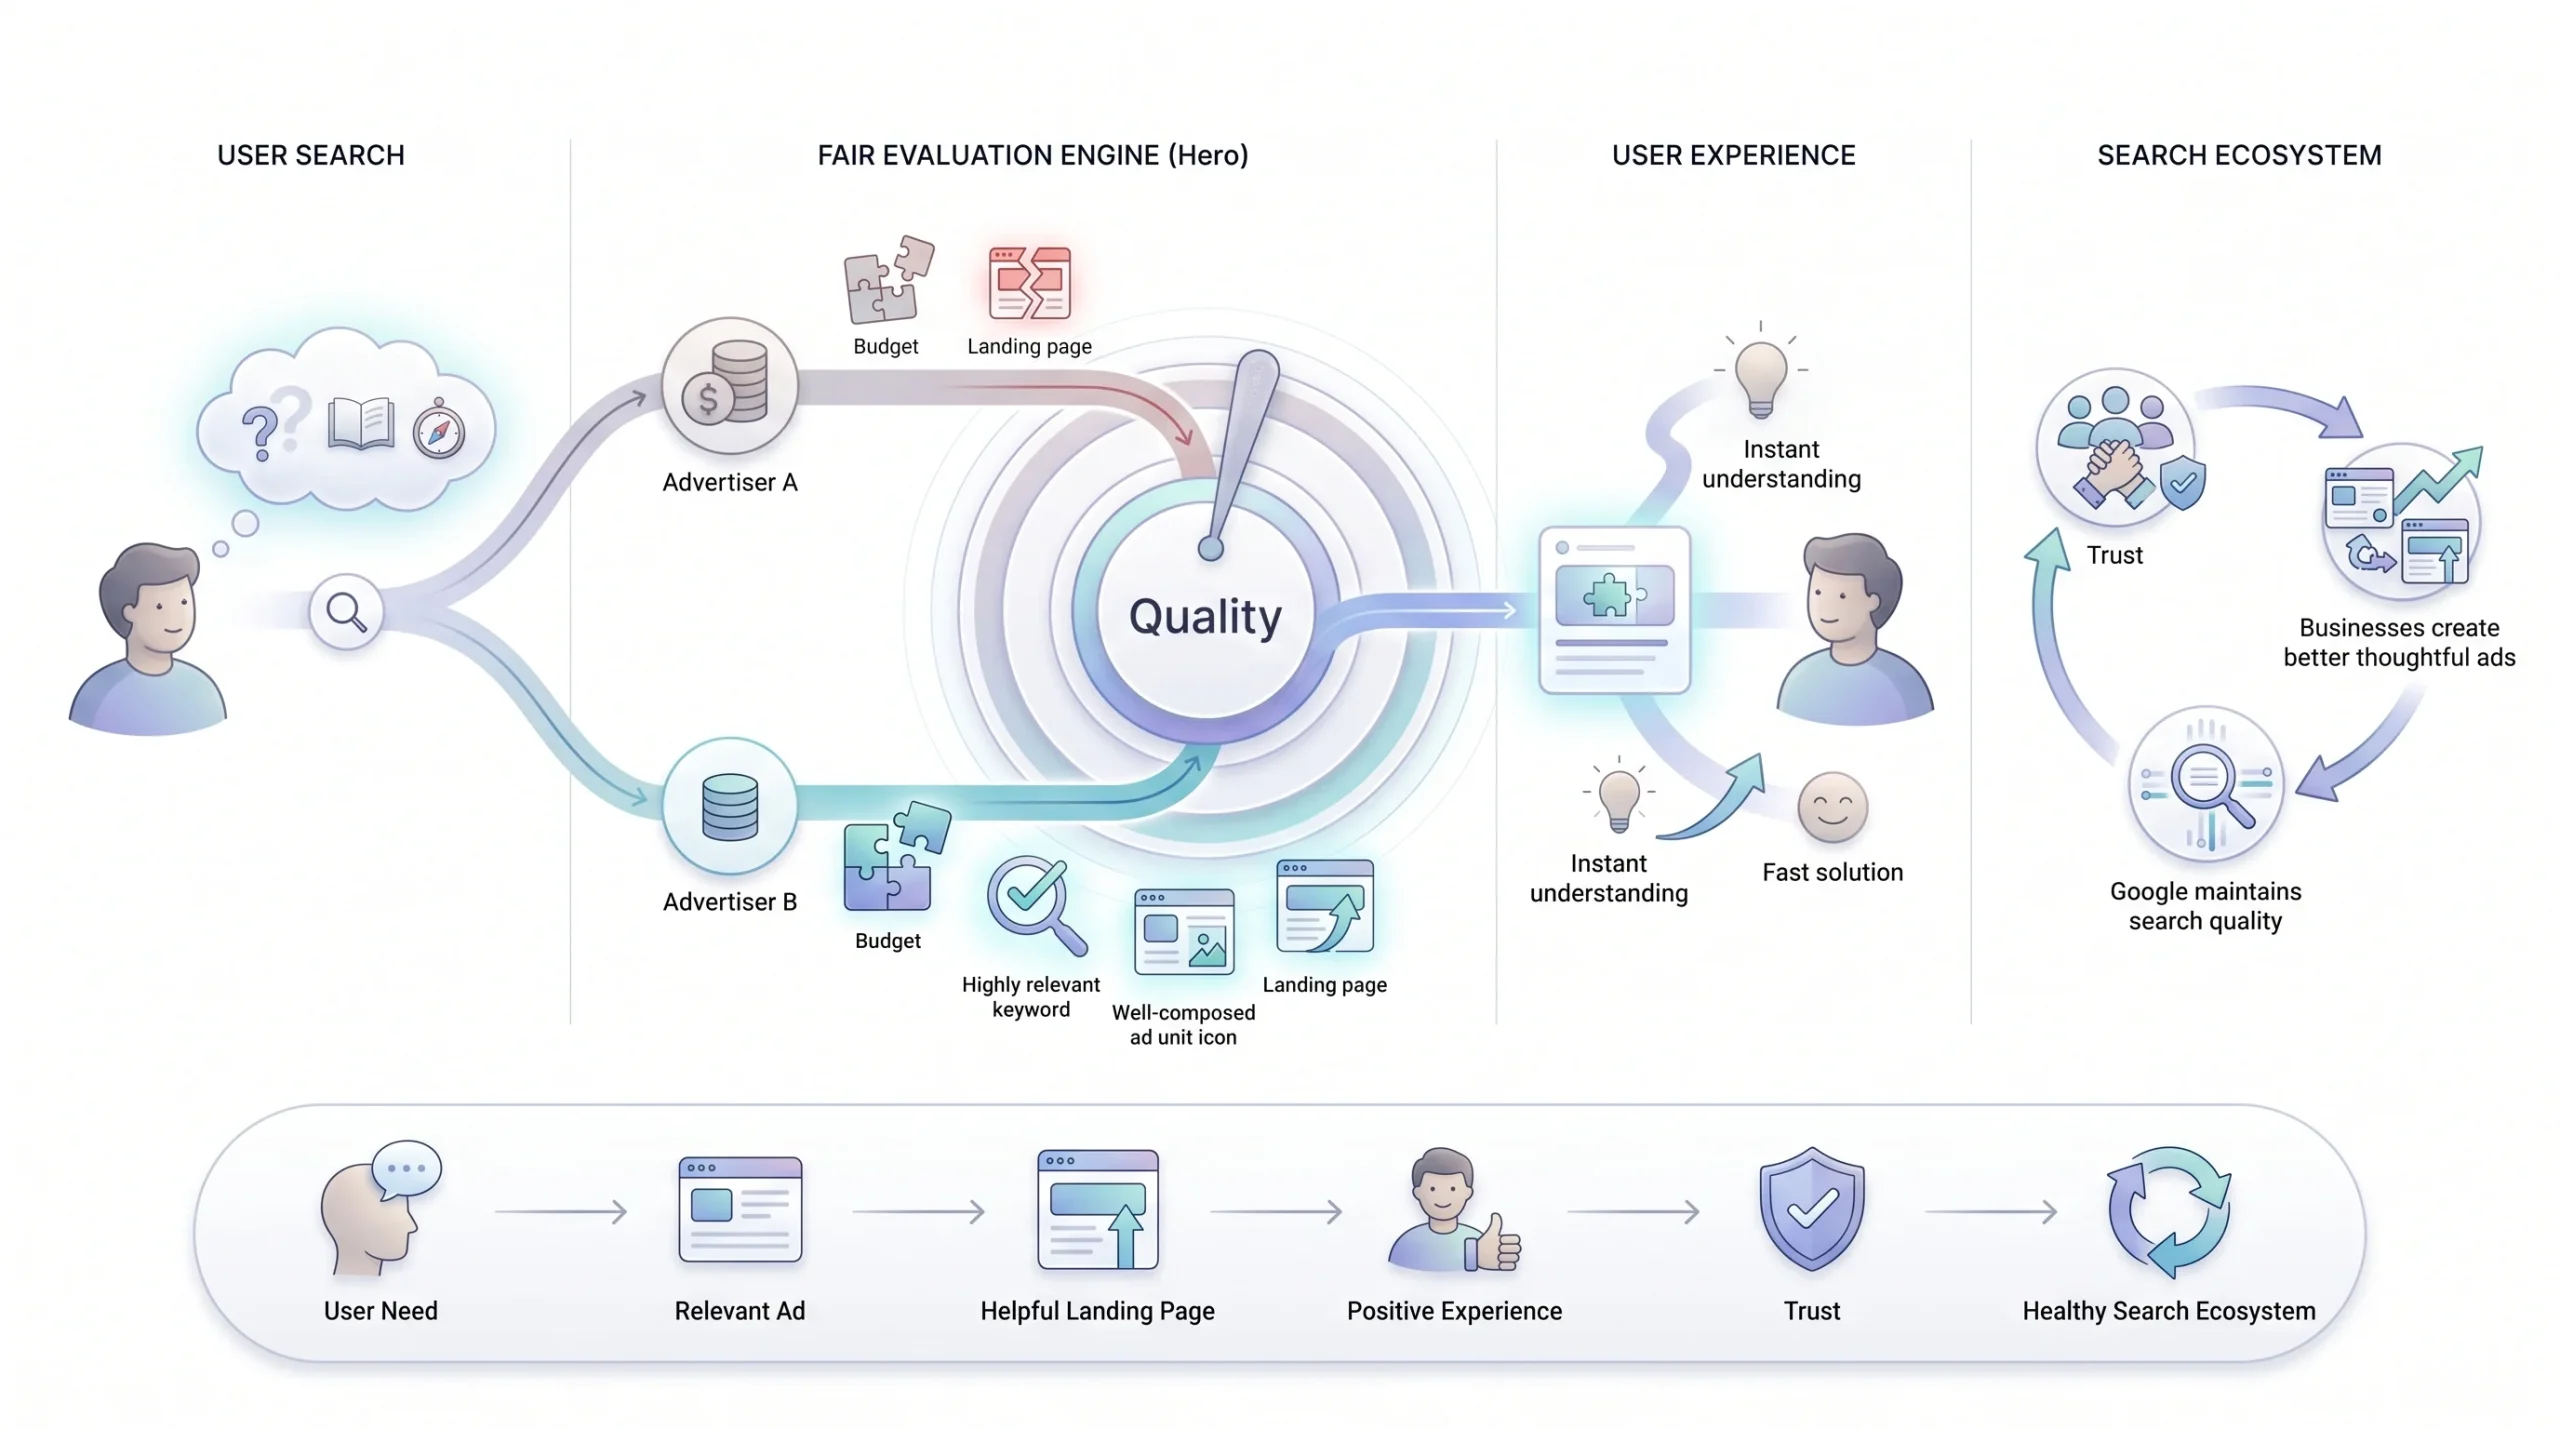
Think about what Google Ads would look like without any quality mechanism at all. Whoever pays the most wins the top spot, full stop. No regard for whether the ad actually answers the search. That’s a terrible experience for the person typing the query, and a search engine that keeps serving irrelevant paid results eventually loses the trust that makes people use it in the first place. So Google built a system that rewards advertisers whose ads genuinely help the person searching, not just the ones with the deepest pockets.
Frederick Vallaeys, who was part of the team at Google that helped build Quality Score and now runs Optmyzr, has made a point of saying it was never meant to be a marketer’s KPI. It was built as a guardrail against search ads turning into a pure pay-to-win system where relevance didn’t matter at all.
That reframes the whole exercise for you as an advertiser. When you improve your Quality Score, you’re not gaming an algorithm. You’re doing the actual work of making your ads and your landing pages genuinely more useful to whoever’s searching. The lower CPC is a side effect of doing that well. It was never supposed to be the goal you’re chasing directly, even though in practice, chasing it works out fine because the two things point in the same direction.
The Three Components of Quality Score
Every keyword’s score comes out of three sub-ratings. Each one gets graded as Below Average, Average, or Above Average, and that grade comes from comparing your ad against other advertisers who showed up for that exact same search over roughly the last 90 days.
Expected Click-Through Rate
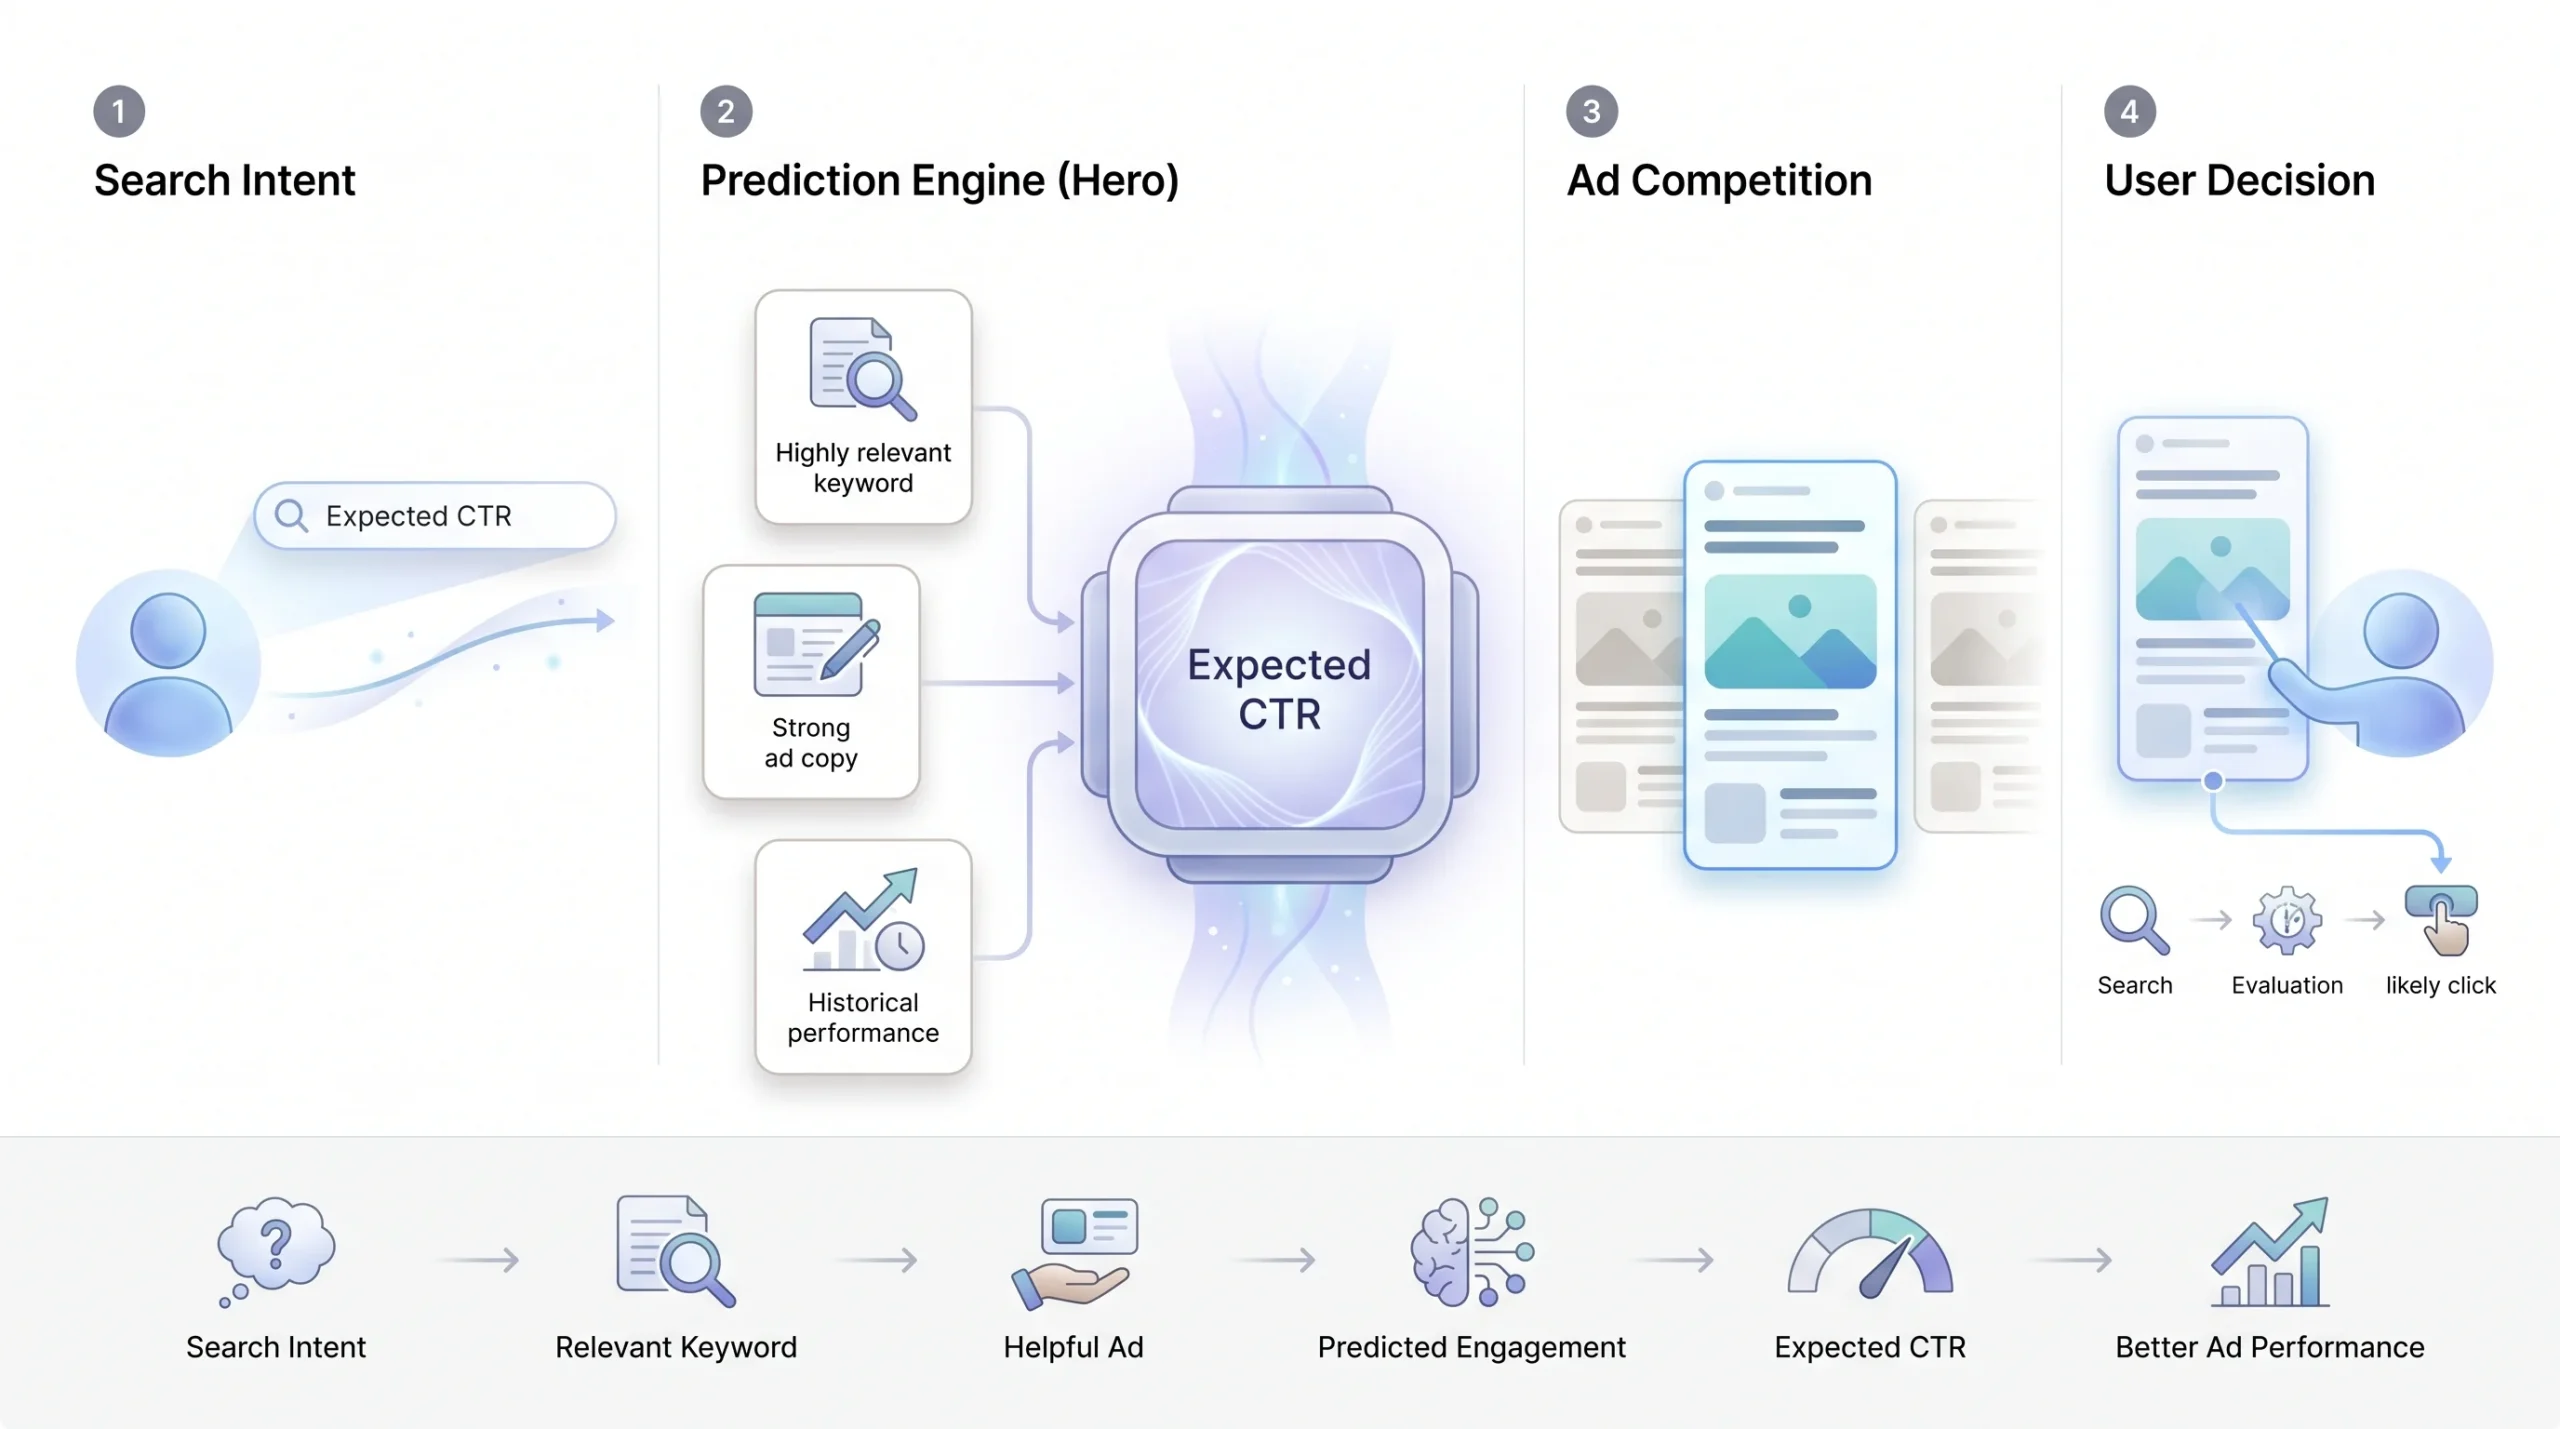
This is Google’s prediction of how likely someone is to click your ad when it shows up for a given keyword, measured against competitors bidding on that same keyword. The key word here is “expected,” not “actual.” A lot of advertisers confuse the two, and it causes real confusion when the numbers don’t line up.
Here’s the part people miss: it’s normalized for ad position. An ad sitting in position one is going to rack up more clicks than one buried in position four, just because of where it’s sitting. Google adjusts for that before scoring you, so you’re not getting penalized just for showing up lower on the page. What you’re actually being judged on is whether your ad copy, your keyword intent, and your past performance line up well enough that people would click it regardless of position.
What actually moves this number:
- Tightly themed ad groups with fewer, more closely related keywords instead of one giant mixed bag
- Ad copy written to match what the searcher actually wants, not just stuffed with the keyword
- Strong, specific headlines and calls to action instead of vague, generic ones
- Ad extensions and assets, like sitelinks, callouts, and structured snippets, since Google factors in the CTR lift it predicts those will give you
Ad Relevance
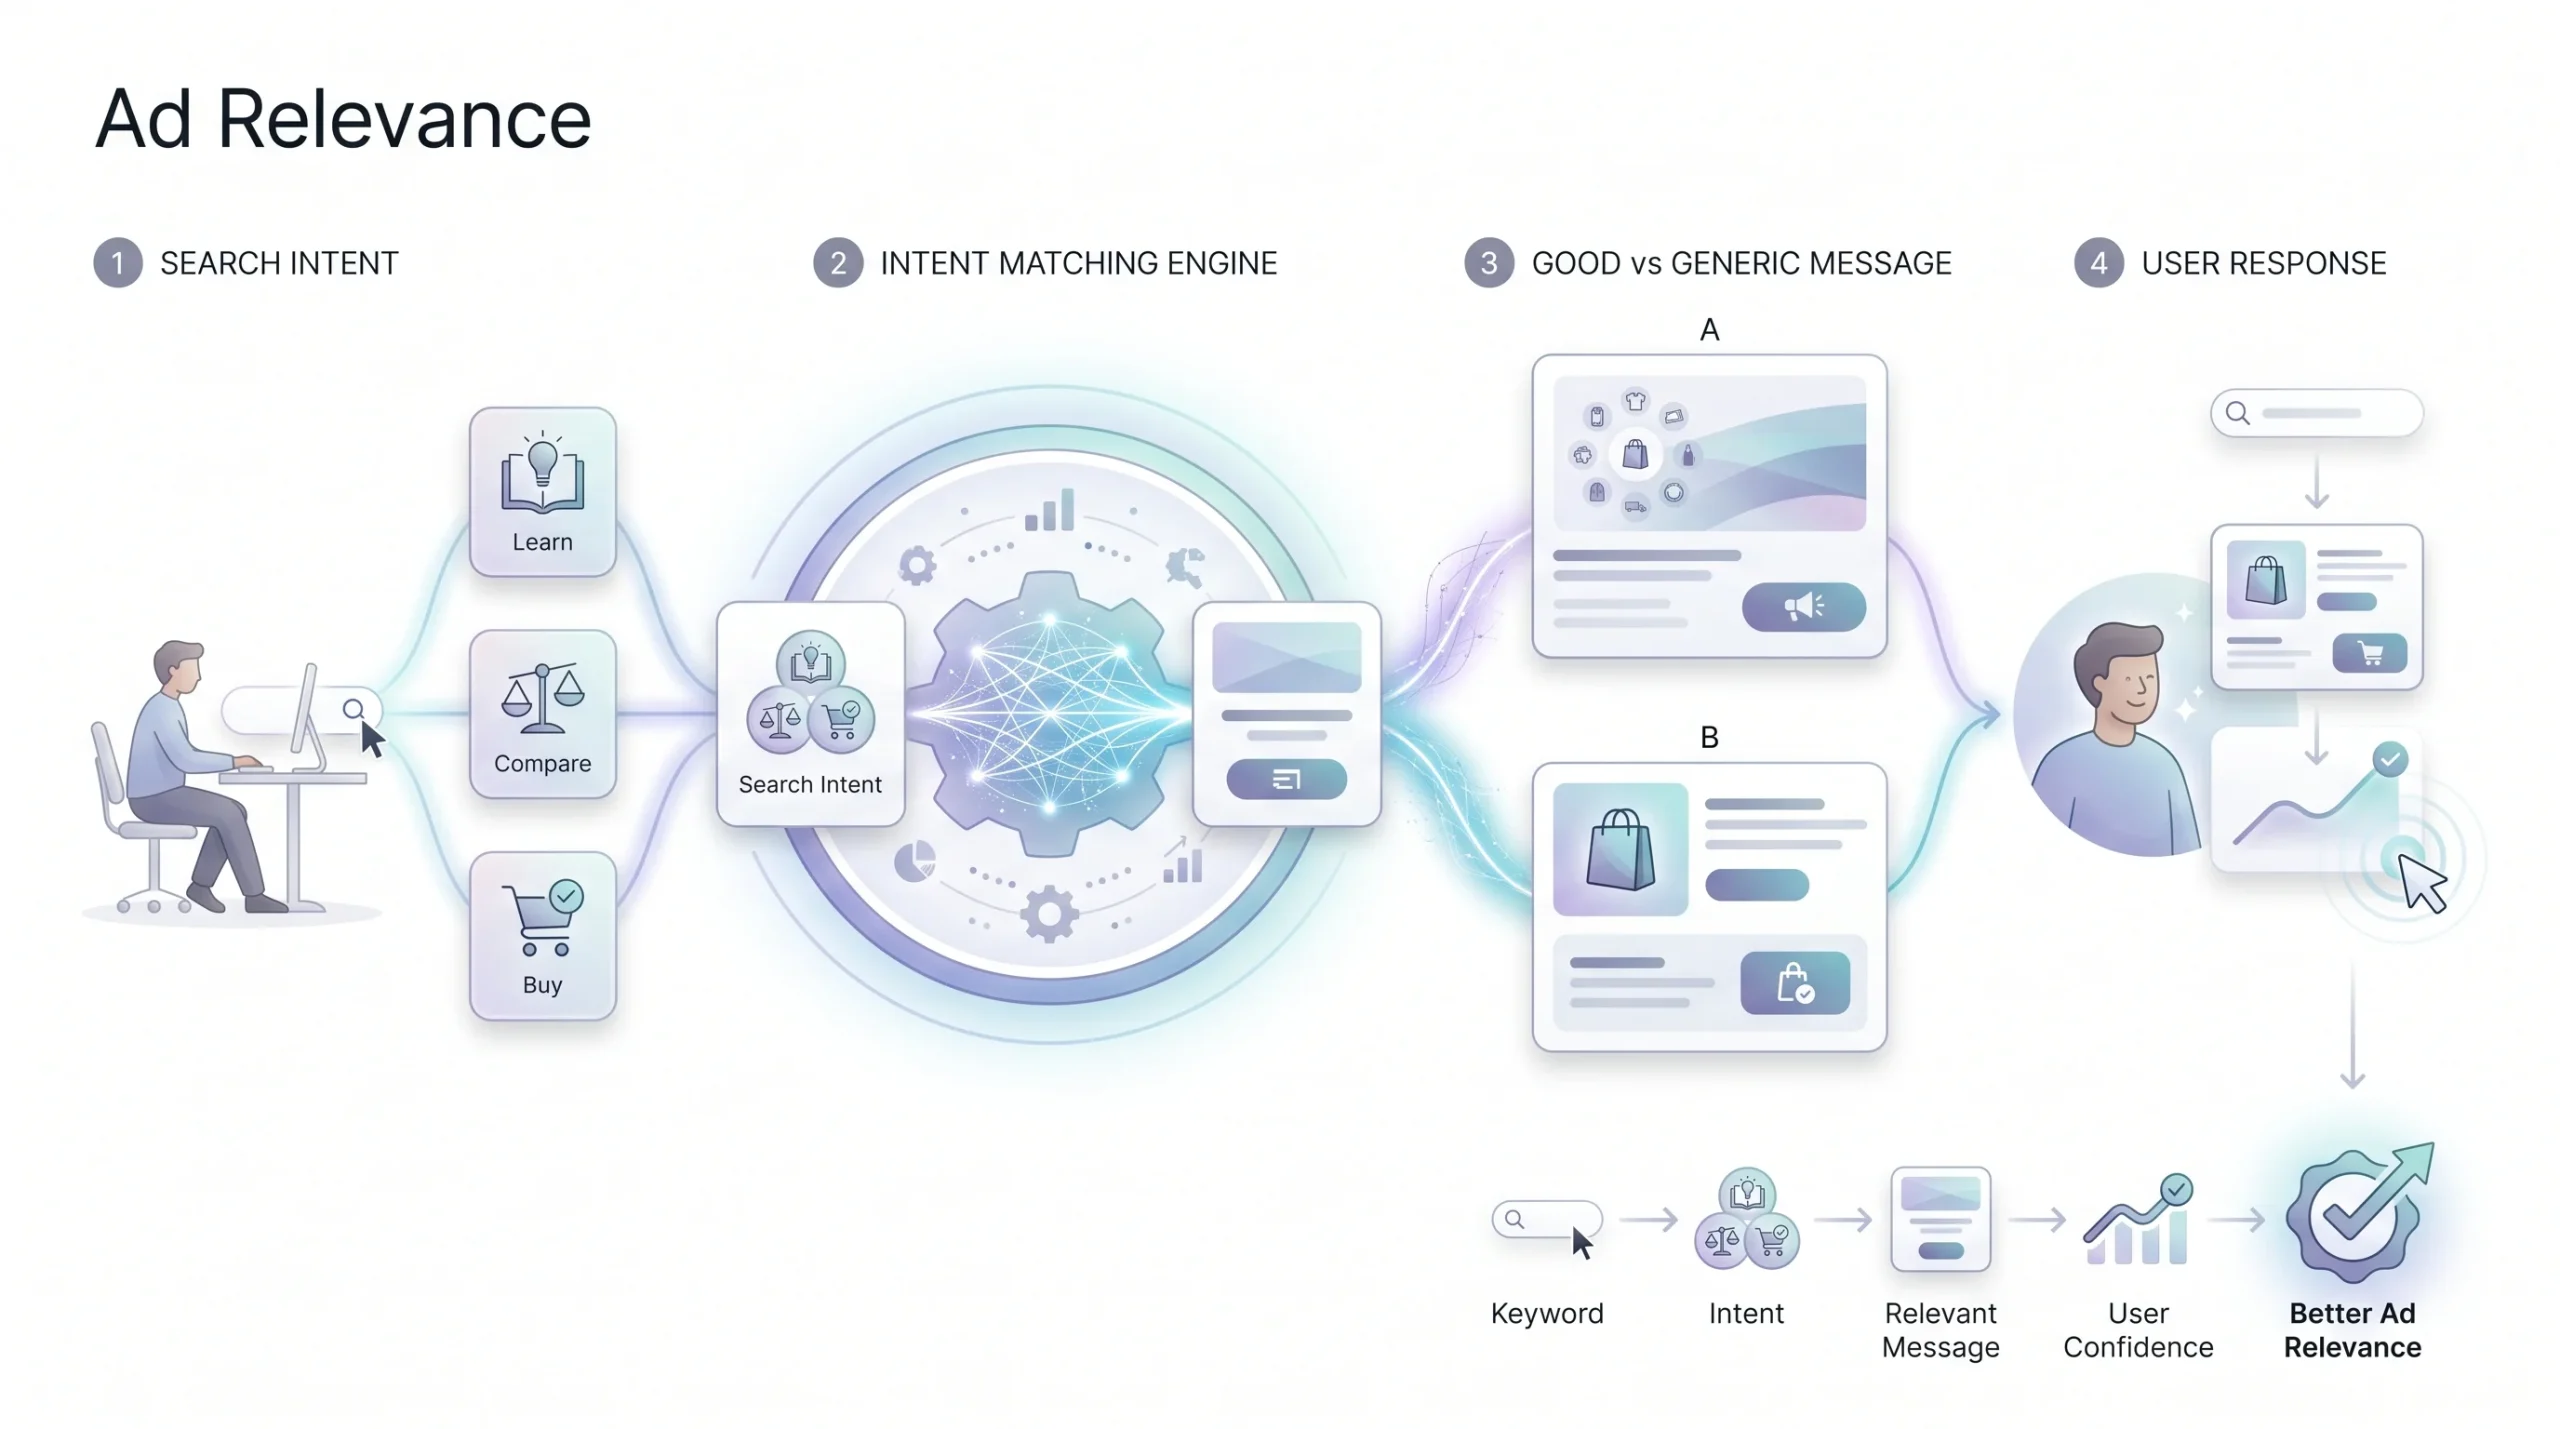
This one measures how closely your ad’s actual message matches the intent behind the search, not just whether the keyword shows up somewhere in your headline. That distinction sounds small until you see it play out in a real account.
Picture an ad group crammed with loosely related keywords, all pointing to one generic ad trying to speak to all of them at once. Compare that to a tightly built ad group focused on one clear intent, with copy written specifically for that intent. The second one wins on relevance every time, even when both technically “contain the keyword.”
And this matters more now than it did a few years back. Search behavior has shifted toward longer, more conversational queries as AI-assisted search has worked its way into how people type things into Google. “Relevance” today isn’t a keyword-matching exercise anymore. It’s whether your ad actually reflects the job the person is trying to get done. The same root keyword can carry three or four completely different intents behind it, and if your one ad tries to cover all of them, you’re not really relevant to any of them.
Landing Page Experience
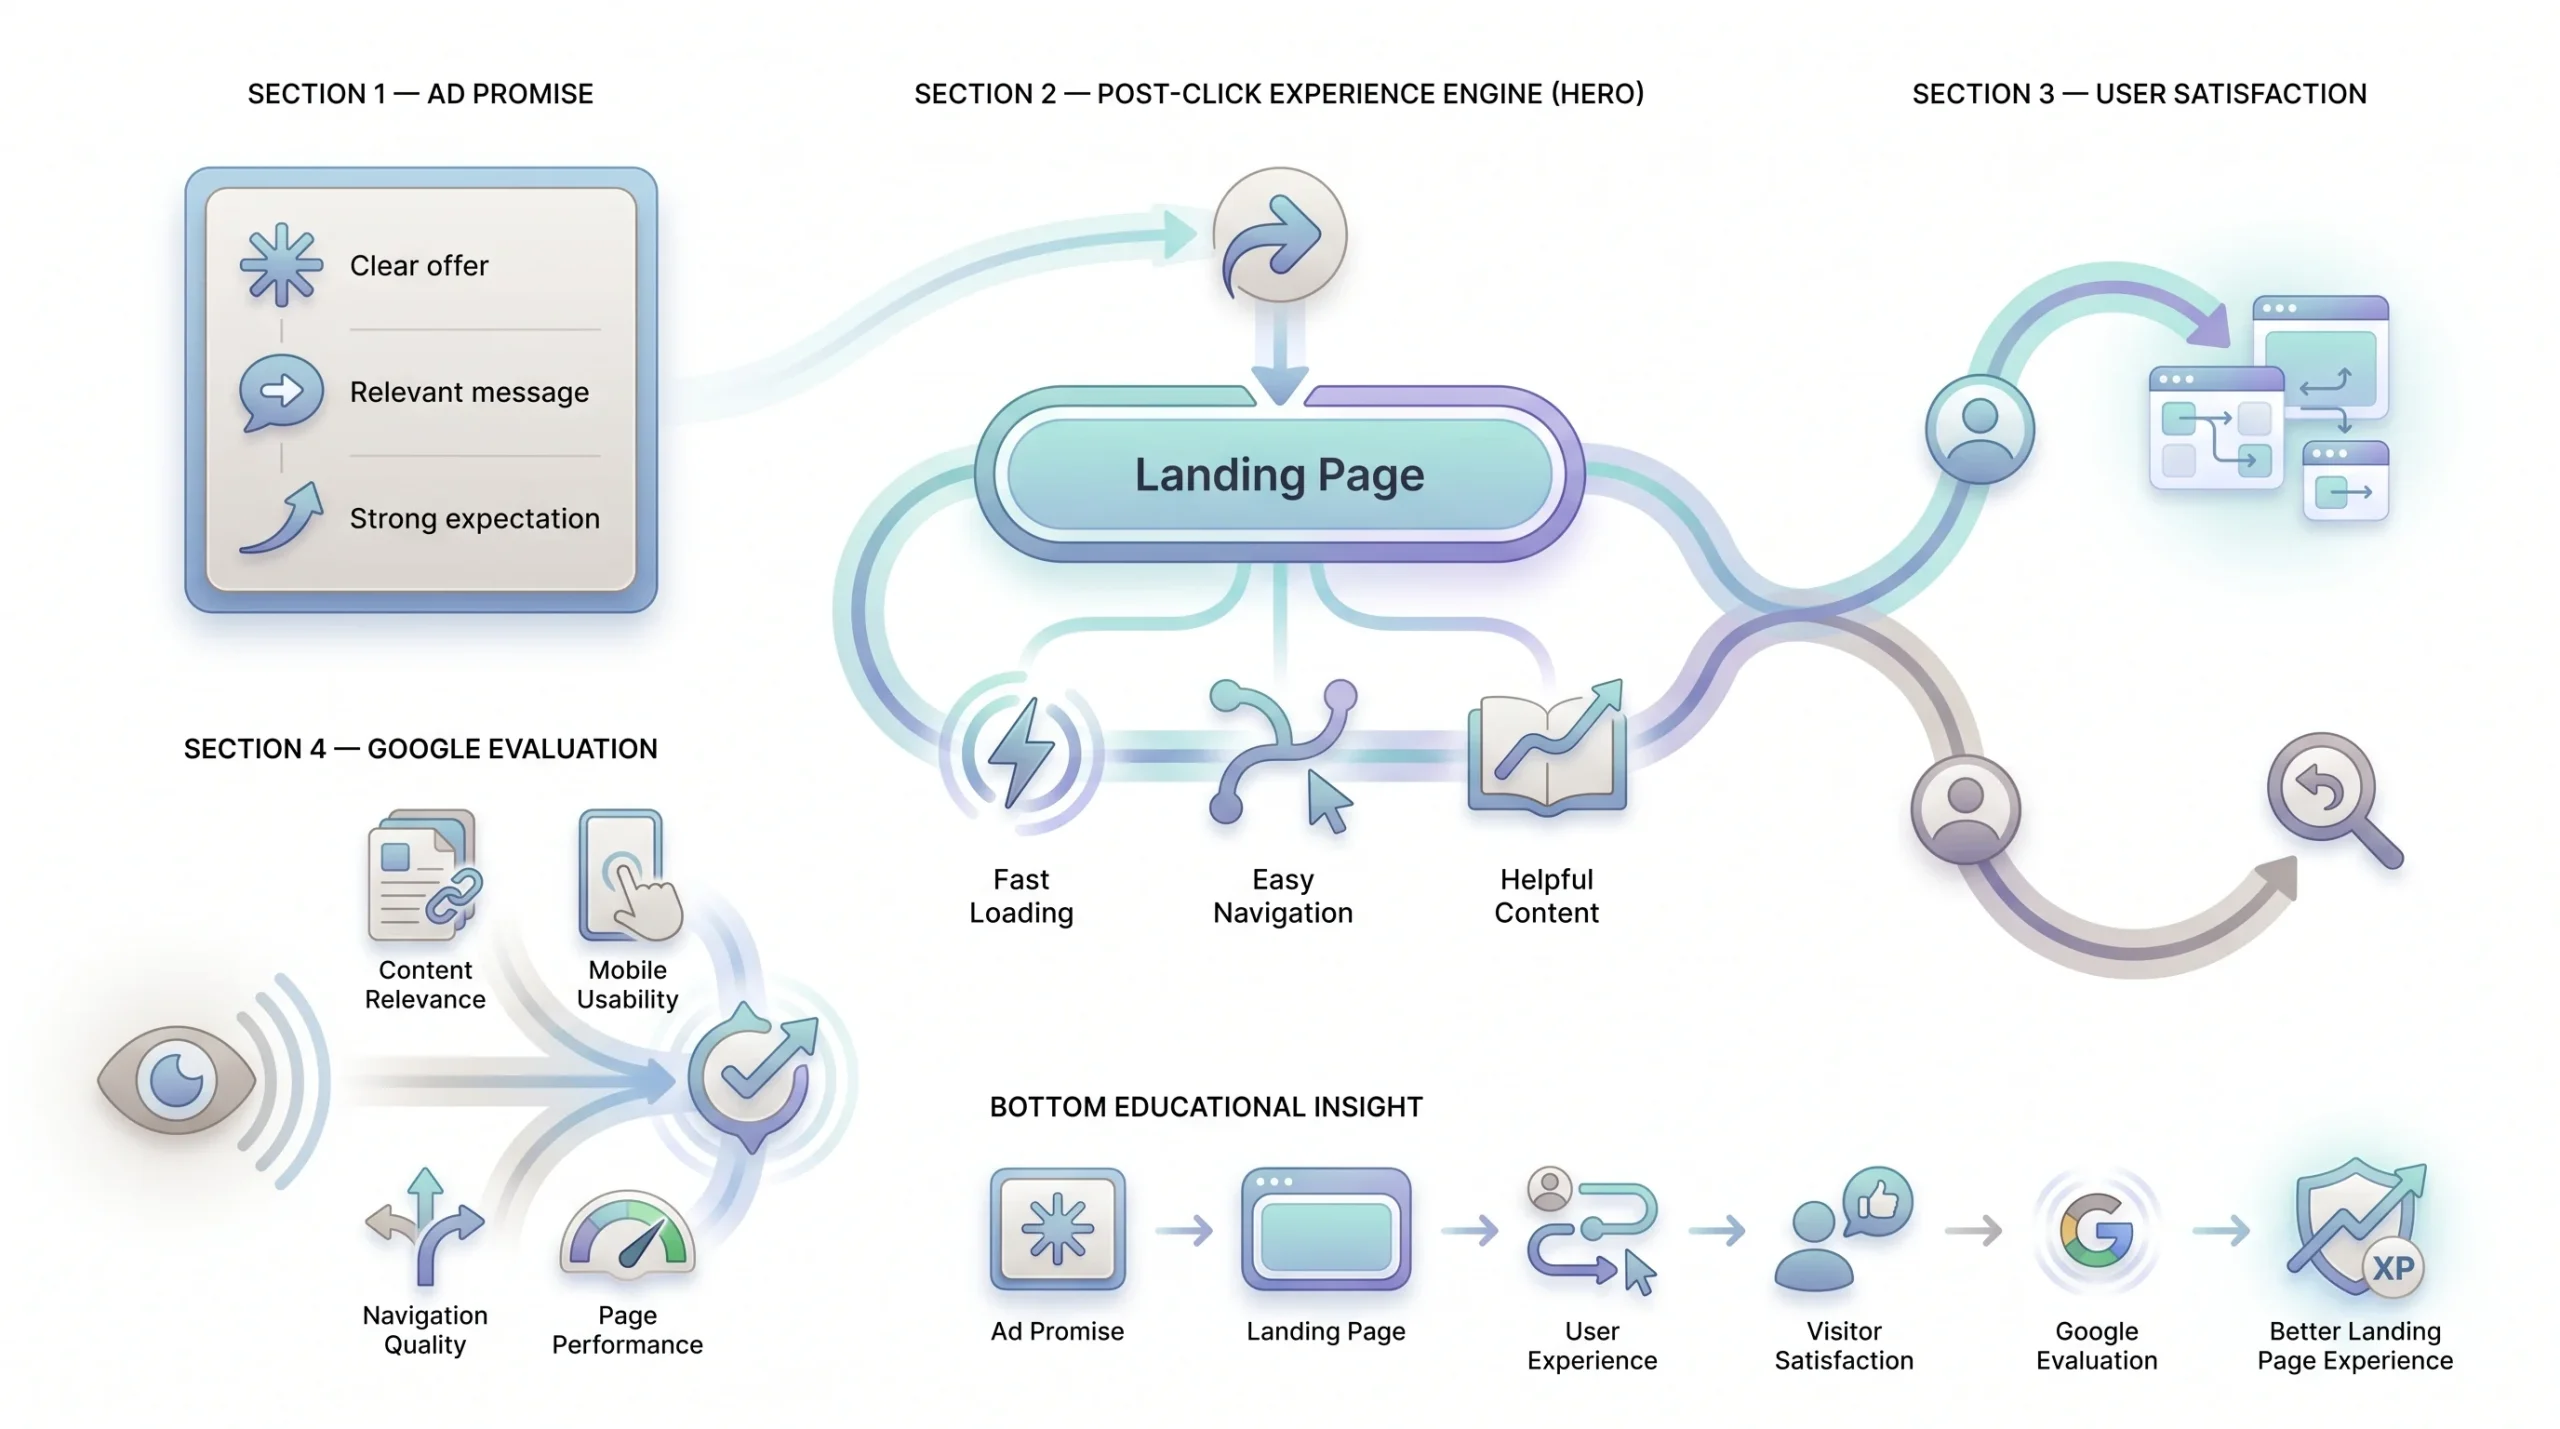
This is where Google looks at what happens after someone clicks. How relevant is the page. How useful. How easy is it to actually navigate. Specifically, Google’s looking at:
- Whether the page content actually matches what the ad promised
- Page load speed
- Mobile usability
- Whether the page is easy to navigate, with nothing deceptive or hidden
There’s a term worth knowing here: pogo-sticking. That’s when someone clicks your ad, lands on the page, doesn’t find what they expected, and bounces straight back to the search results within seconds. That behavior is a strong negative signal, and honestly, it should be, because it’s exactly the outcome Quality Score is trying to prevent. You’ll usually see it show up in your bounce rate or engagement rate numbers in GA4 too, so it’s not some invisible thing you just have to guess at.
| Component | What it measures | What moves it | How hard to fix |
|---|---|---|---|
| Expected CTR | Likelihood of a click, adjusted for position | Ad copy, tightly themed ad groups, ad assets | Moderate |
| Ad Relevance | How well your ad matches search intent | Keyword-to-ad group alignment, message match | Usually the easiest, mostly in your control |
| Landing Page Experience | Relevance, speed, mobile usability, navigability | Page content, load speed, mobile design | Takes the most work, but the biggest payoff |
Practitioner research that’s looked at thousands of accounts, groups like Adalysis and WordStream, has estimated that Expected CTR and Landing Page Experience each carry something close to 39% of the weight in the score, with Ad Relevance sitting lower at around 22%. Google has never published official weights, so treat those numbers as directional, not gospel. But the pattern shows up consistently in real accounts: fixing your landing page usually does more for your score than tweaking a headline for the tenth time.
How Quality Score Connects to Ad Rank and CPC
This is the part where a lot of beginner content just waves its hands, so let’s actually slow down and walk through it.
Ad Rank, the formula that decides where your ad shows and what you pay, comes down to your max CPC bid multiplied by quality-related factors, including the expected impact of your ad assets. Quality Score isn’t a badge sitting off to the side. It’s a multiplier baked directly into whether your ad shows at all, and where.
What that means in practice: a low score forces you to bid a lot higher just to land in the same spot a competitor reaches with a lower bid and a better score. And in some cases, no bid is high enough. That’s what’s behind the “Rarely shown due to low Quality Score” status a lot of advertisers stumble into and don’t understand.
Here’s the part that’s genuinely useful and gets skipped constantly: the relationship between score and CPC isn’t a straight line, and it’s not symmetrical either. Going from a 5 to a 6 helps a little. Going from a 7 to an 8 tends to help more than that same one-point jump lower down the scale. And below the average of 5, every point you drop gets progressively more expensive, not just proportionally more expensive.
| Quality Score | Estimated CPC vs. QS 5 baseline |
|---|---|
| 1 to 3 | Up to +400% |
| 4 | Roughly +25% |
| 5 | Baseline, neutral |
| 6 | Roughly -17% |
| 7 | Noticeably below baseline |
| 8 | Roughly -37% |
| 10 | Up to -50% |
Worth being straight about where these numbers come from. These are directional estimates from practitioners who’ve reverse-engineered patterns across large sets of real accounts, groups like Adalysis and the team behind SEISO, not figures Google has ever officially published. Google keeps its exact formula private. But even as rough estimates, they explain something that confuses almost everyone starting out: two advertisers can bid the exact same amount on the exact same keyword and end up in totally different positions, paying totally different prices. That’s Quality Score doing its job.
What a “Good” Quality Score Actually Looks Like
Let’s set expectations properly, because chasing a 10 on every single keyword is honestly a waste of your time.
Across accounts, the average Quality Score tends to sit around 5 to 6. If you’re at a 7 or higher, you’re already ahead of most advertisers out there. And squeezing a keyword from a 9 to a 10 usually isn’t worth the hours you’d spend on it, when a different keyword sitting at a 3 is quietly draining your budget the whole time.
The smarter move is prioritizing. Go fix the keywords dragging the average down before you spend another minute polishing the ones already doing fine.
Don’t treat Quality Score like report card you need straight A’s on. Treat it more like a smoke detector. A 3 or a 4 means go look at what’s actually broken. A 7 or higher means you’re fine, go put your attention somewhere else.
How to Check Your Quality Score
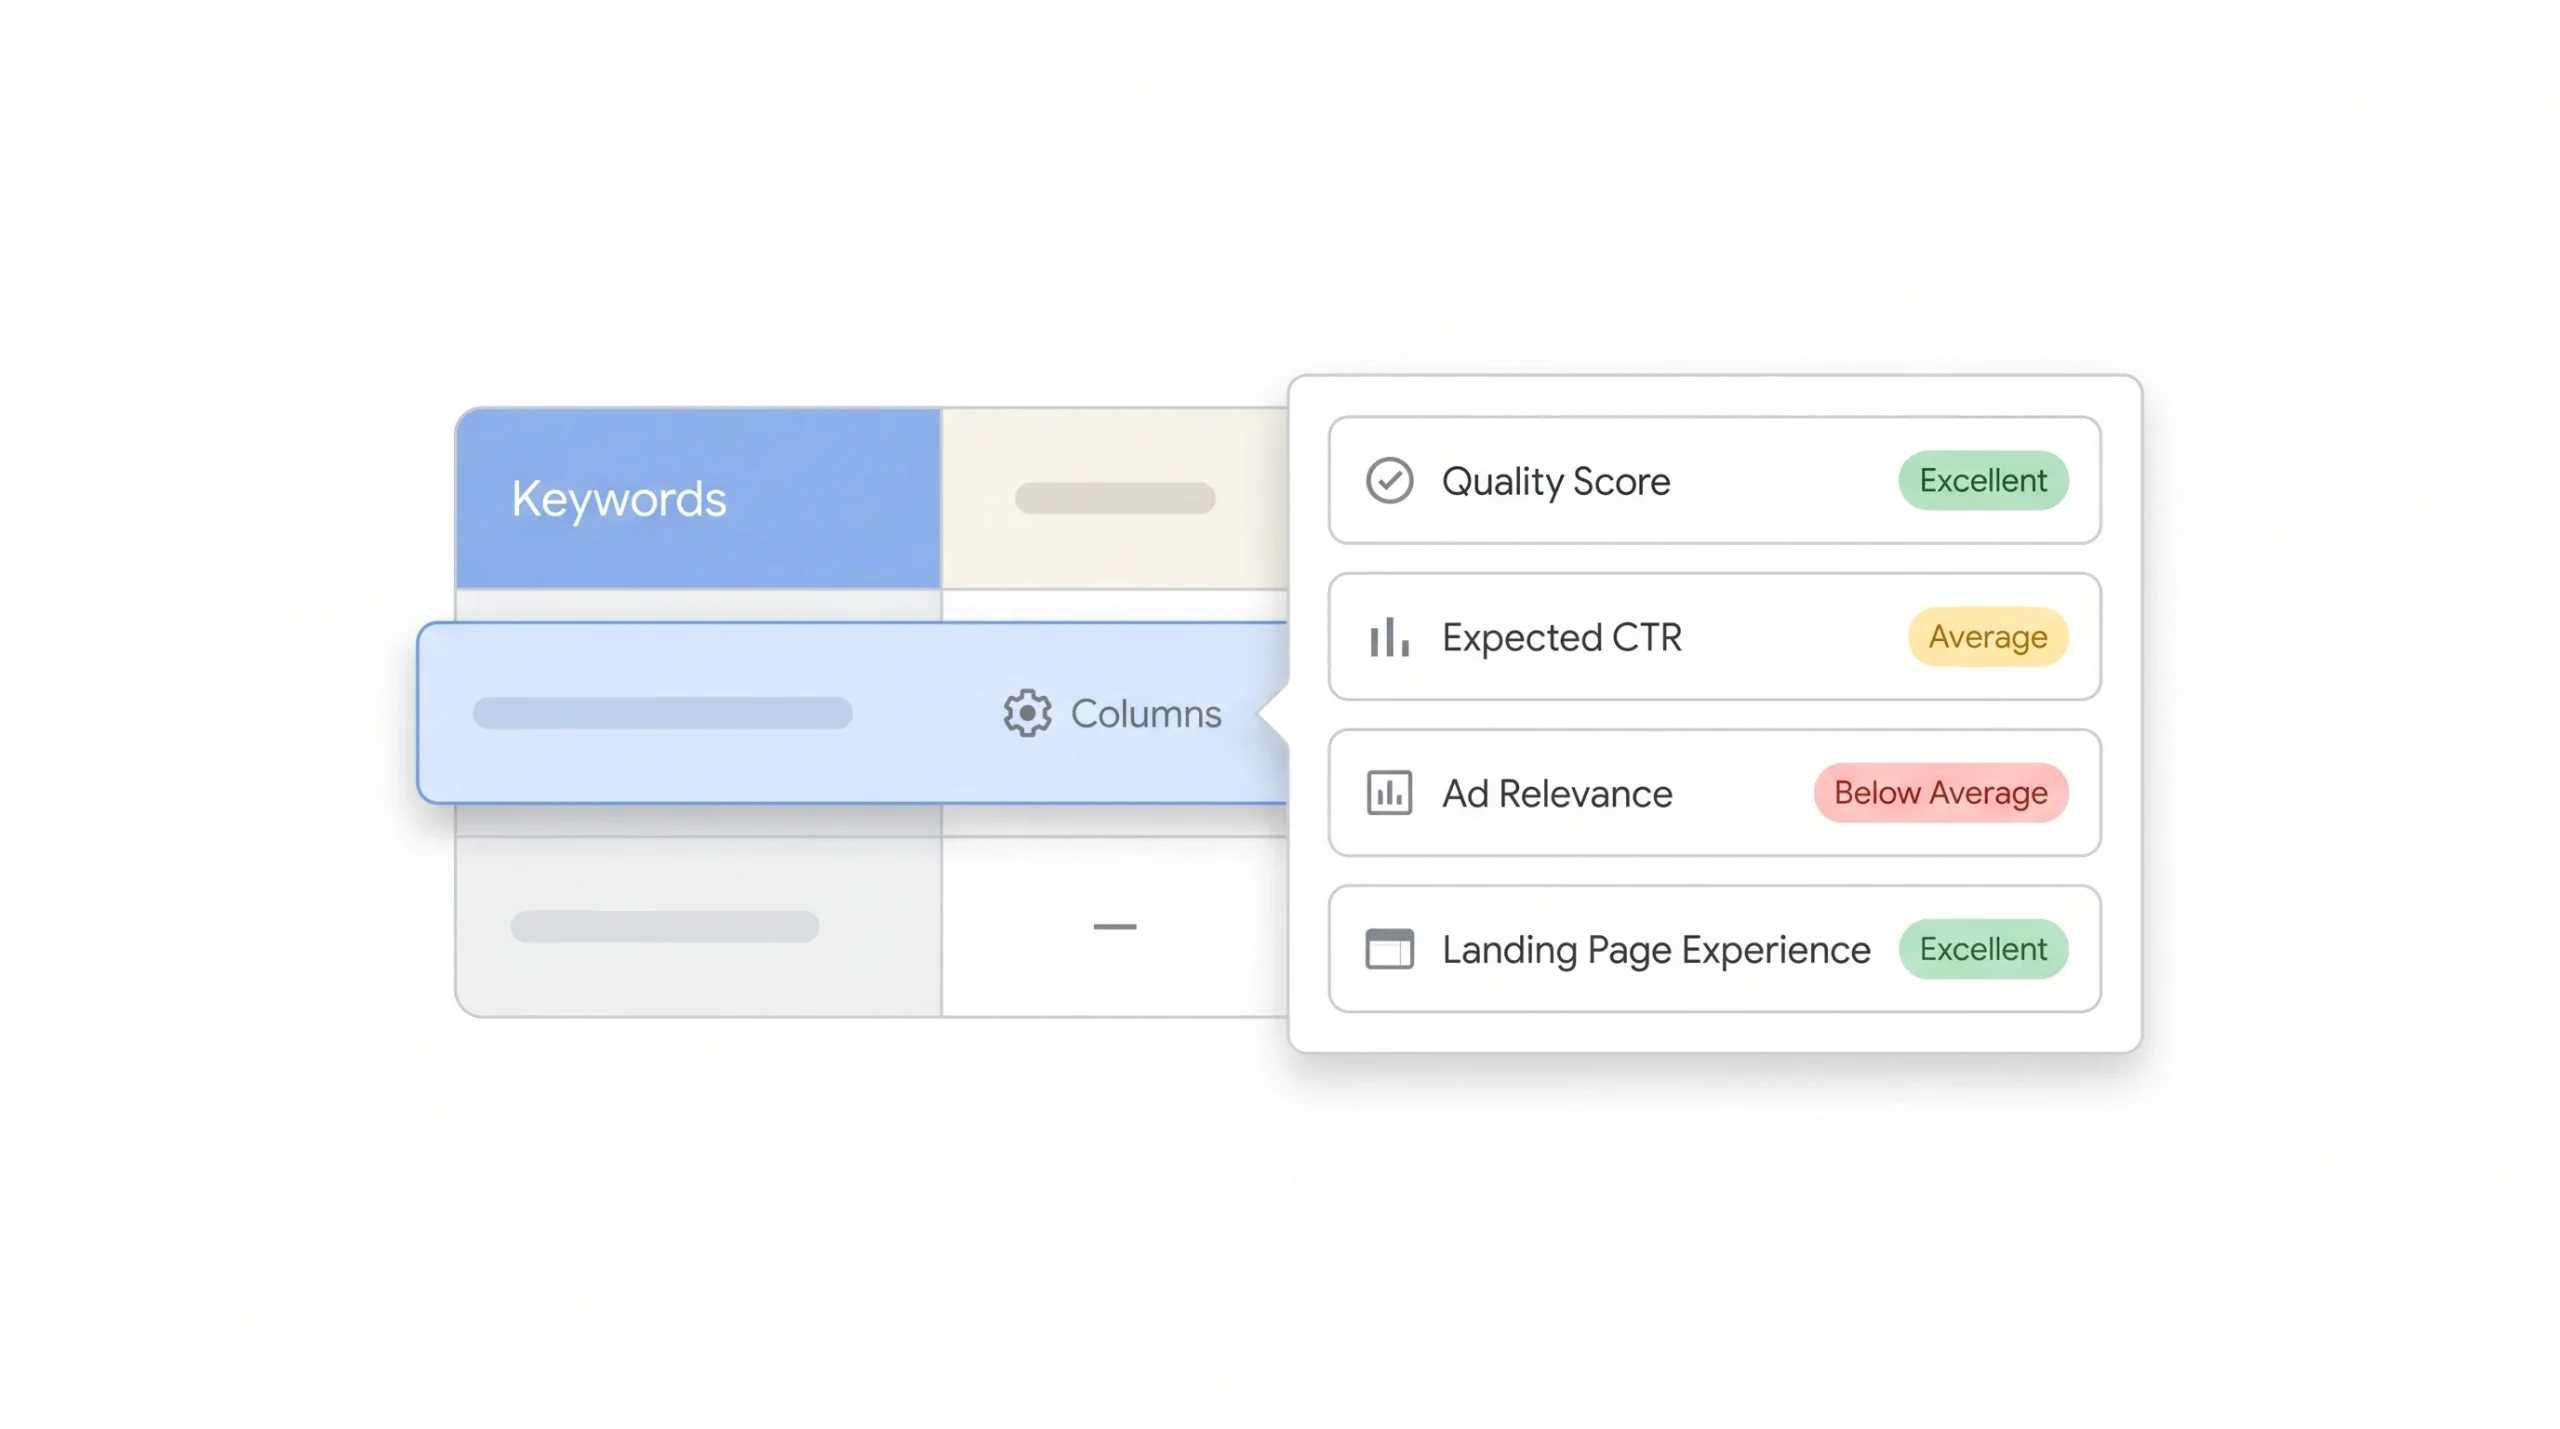
Not complicated, just a few clicks most people never bother finding.
- Log in to Google Ads and open the Search campaign you want to check
- Click Keywords in the left-hand menu
- Click the columns icon above the keyword table
- Under “Modify columns,” open the Quality Score section
- Add Quality Score, Expected CTR, Ad Relevance, and Landing Page Experience
- Click Apply. You can also add the historical versions of each metric if you want to see how the score has moved over your selected date range
One thing that confuses people the first time they see it: sometimes the Quality Score column just shows a dash instead of a number. That’s not an error and it’s not a zero. It means there isn’t enough exact-match search volume yet for that keyword to generate a score. Give it time, don’t force a fix on something that doesn’t have data behind it yet.
How to Improve Each Component
Don’t chase the number itself. Fix the actual account structure and the actual content behind it, and the score follows on its own. A sensible order to work in: fix your ad group structure and relevance first, then your ad copy and CTR, then your landing pages, because messy structure quietly undermines the other two no matter how good your copy is.
Improve Expected CTR
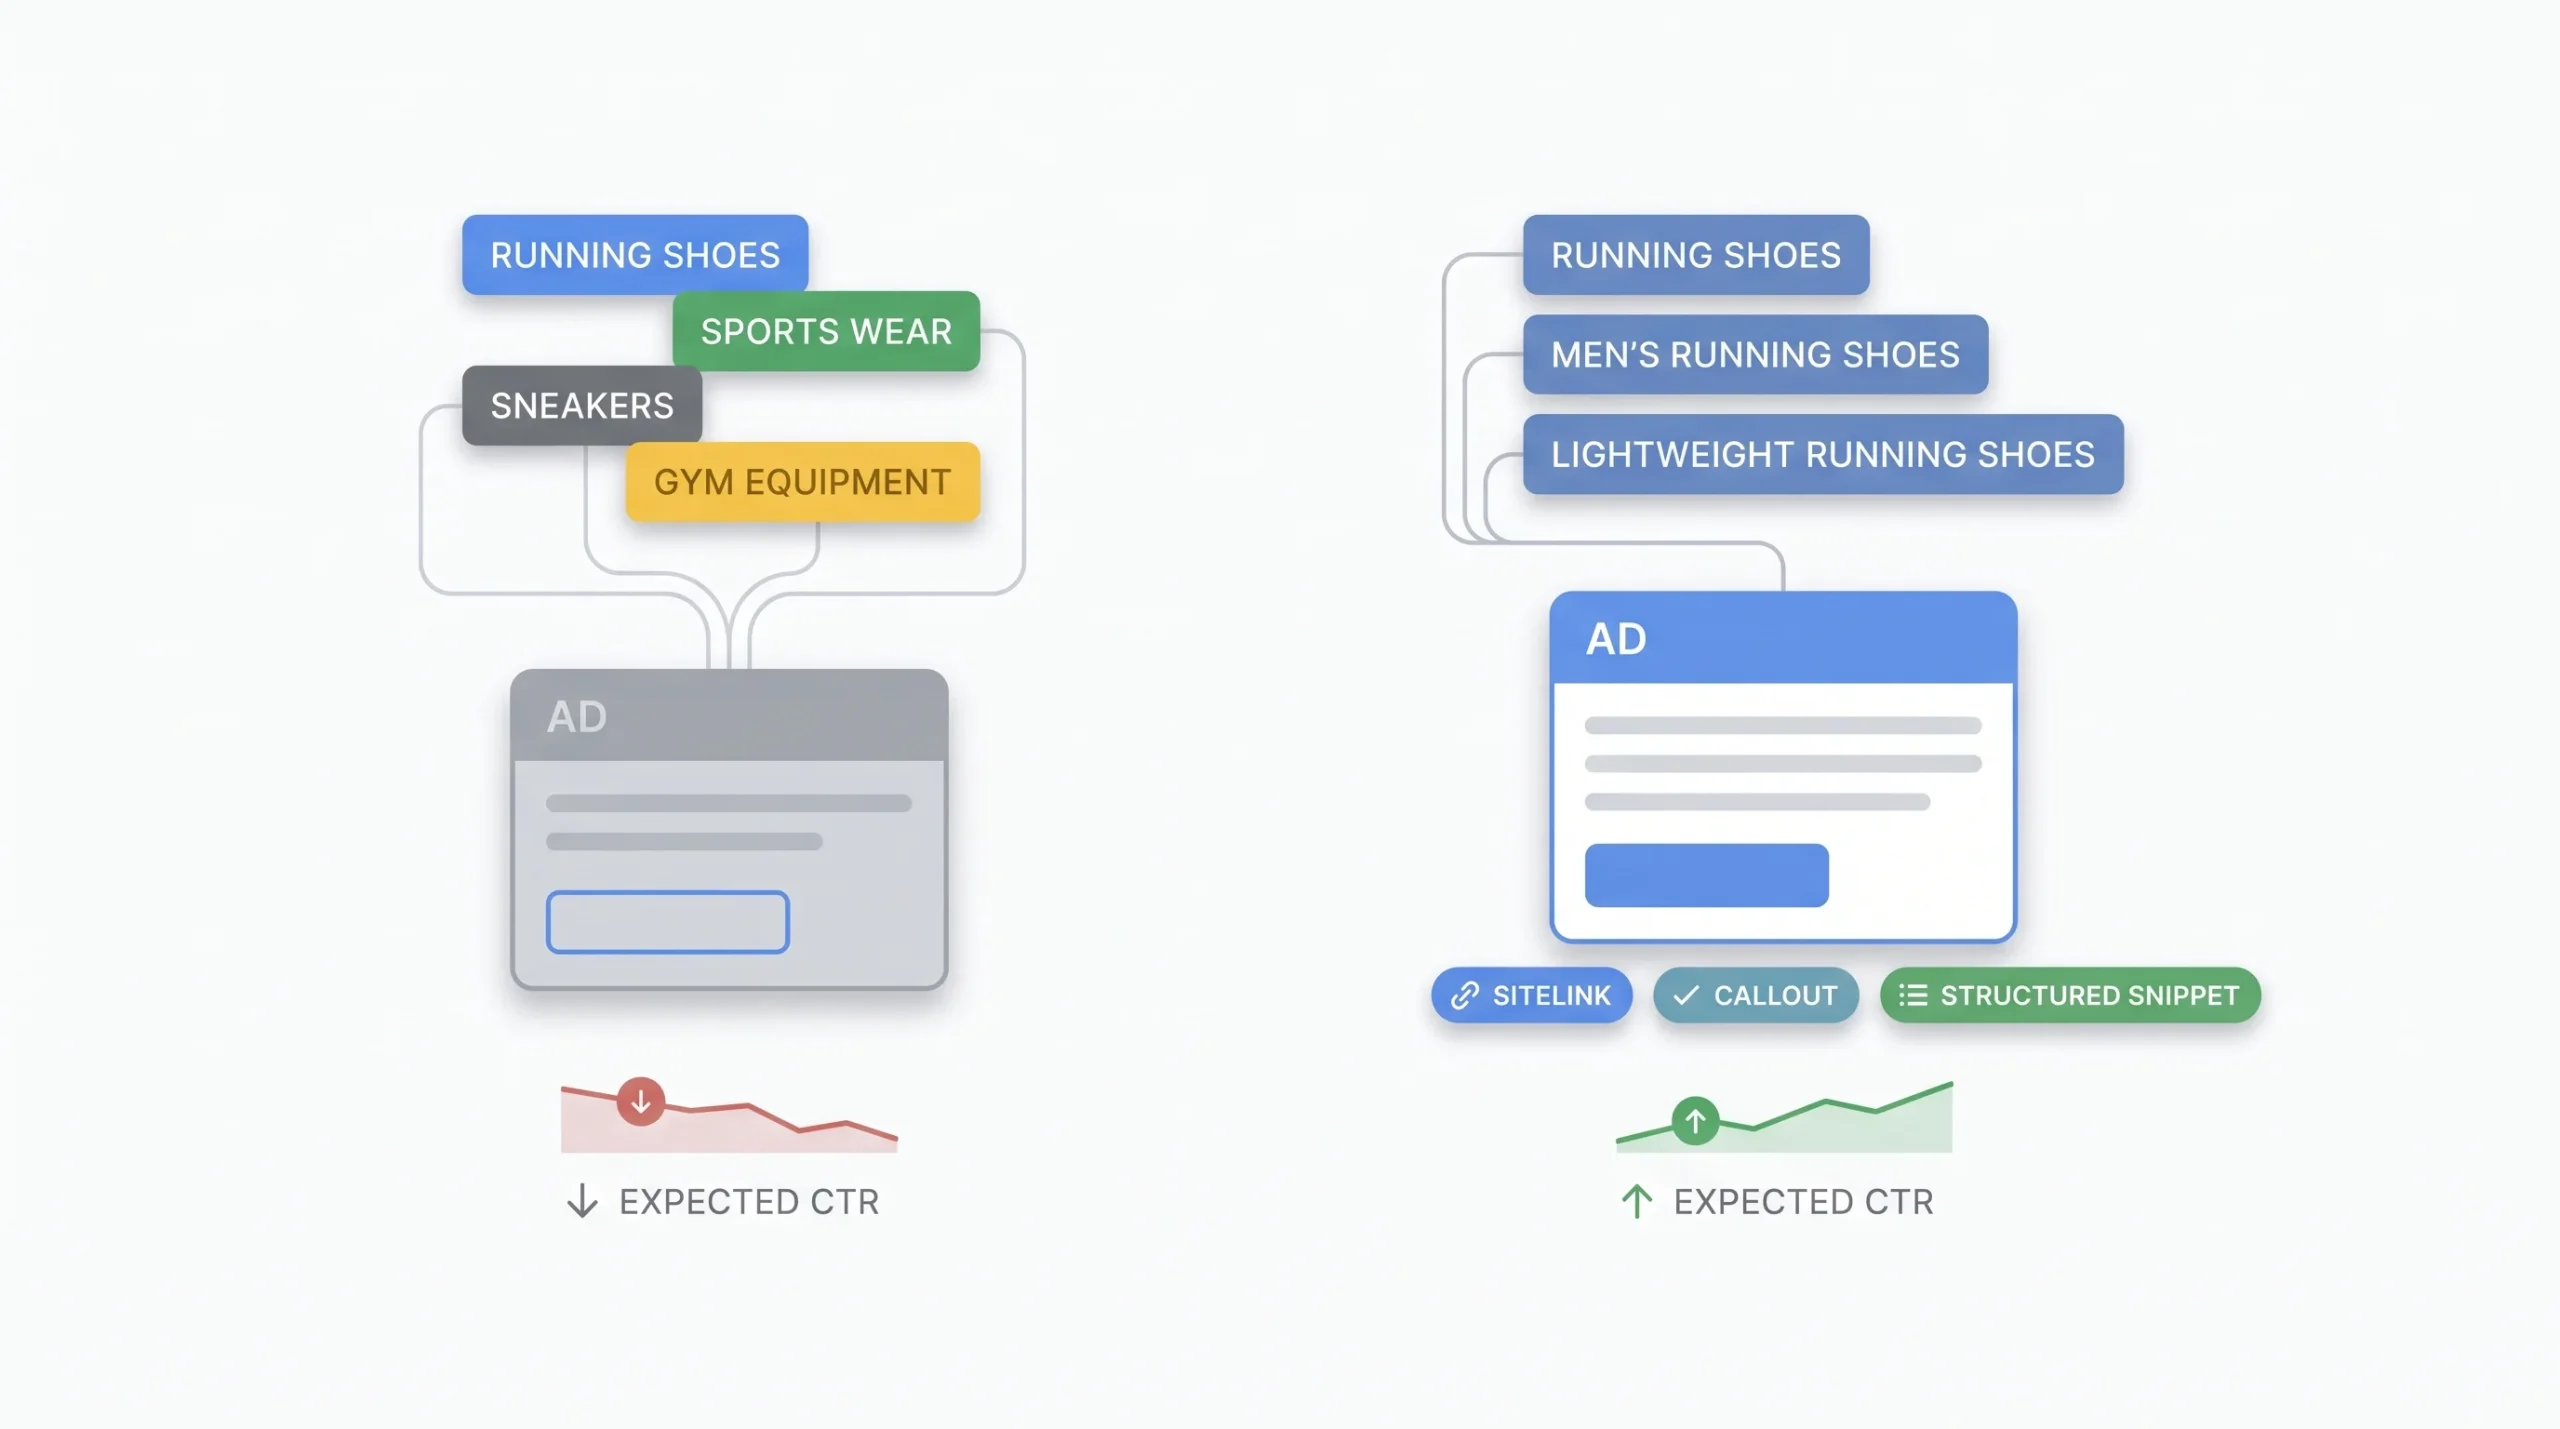
- Build tightly themed ad groups, sometimes down to single keyword ad groups, instead of dumping a bunch of loosely related terms into one bucket
- Write ad copy that speaks directly to that specific keyword’s intent, not generic brand messaging recycled across every group
- Test multiple headlines and descriptions inside Responsive Search Ads and let the performance data pick the winners instead of guessing
- Use specific, direct calls to action instead of vague ones like “Learn More” on everything
- Add relevant ad assets, sitelinks, callouts, structured snippets, images, since Google factors their predicted CTR lift into Ad Rank
- Pause or restructure keywords that keep drifting away from their ad group’s core theme
Improve Ad Relevance
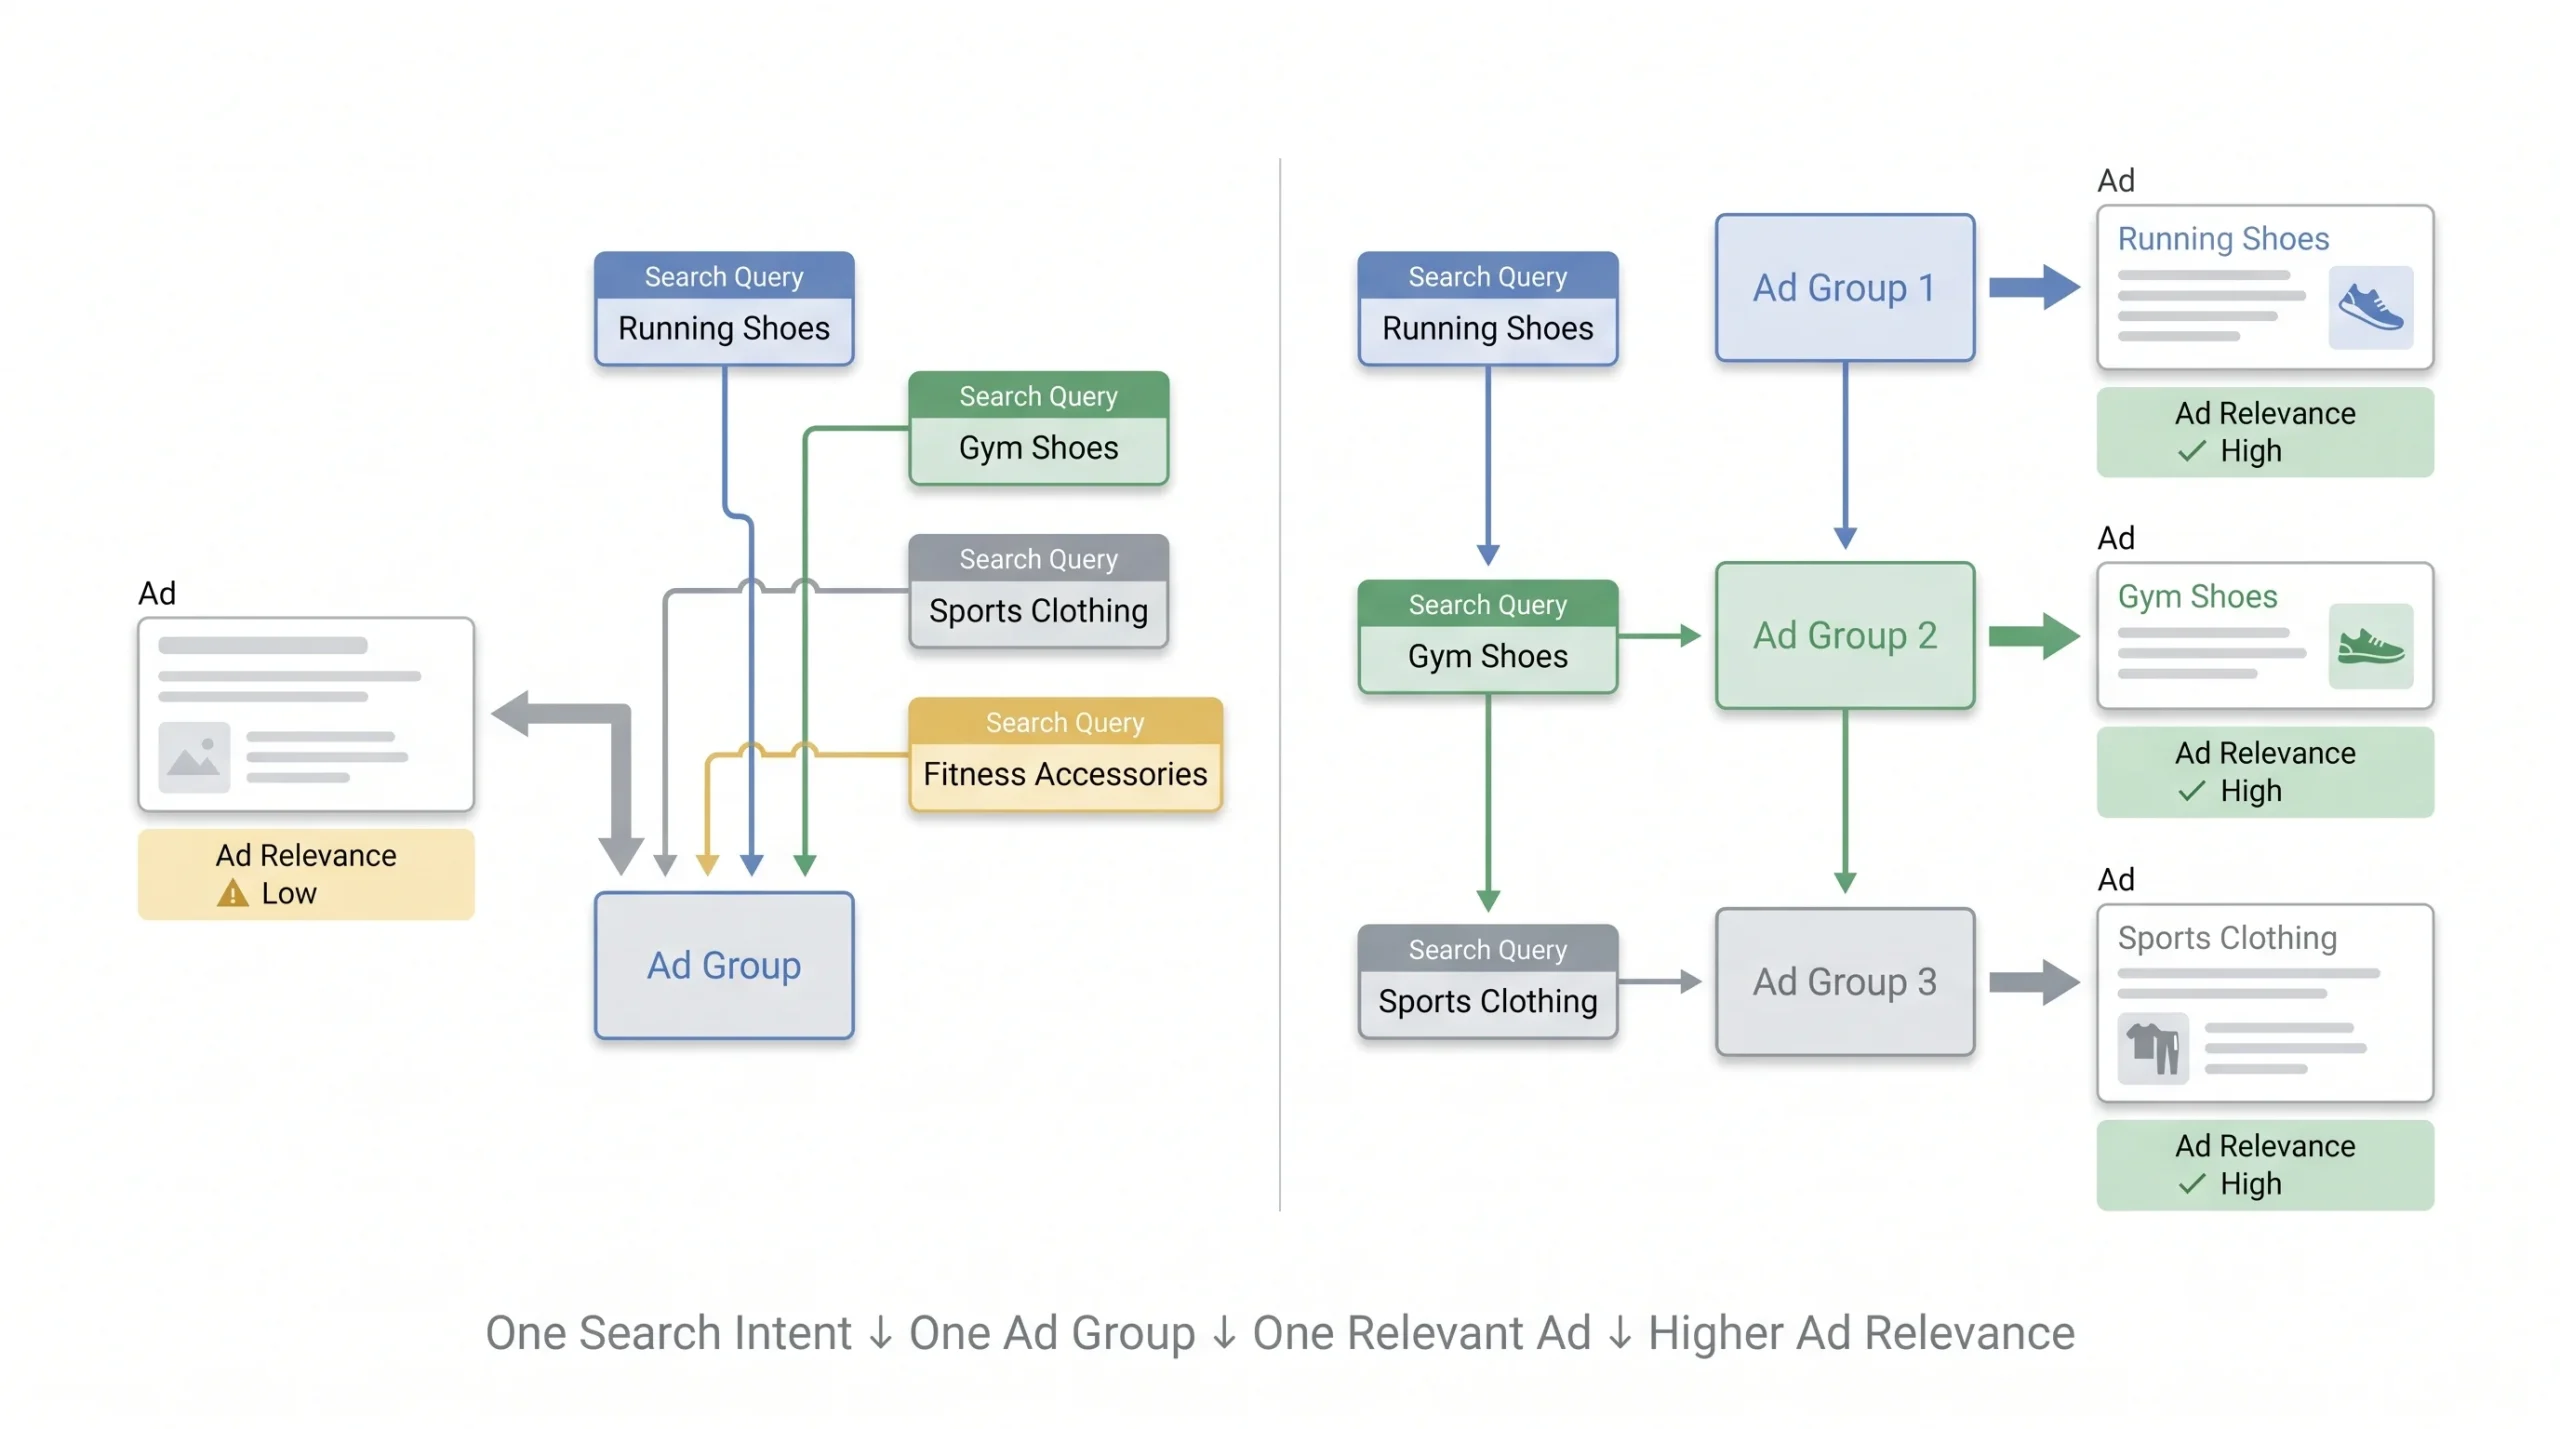
- Map one clear search intent to one ad group. Resist the urge to lump similar-but-different intents together just to save setup time
- Mirror the language of the keyword in your ad copy, but write it for the actual person reading it, not as a robotic keyword-stuffing exercise
- Check your Search Terms report regularly to catch keywords that have quietly drifted away from what the ad group was originally built around
- Split ad groups the moment you spot more than one distinct intent hiding under a single set of keywords
Improve Landing Page Experience
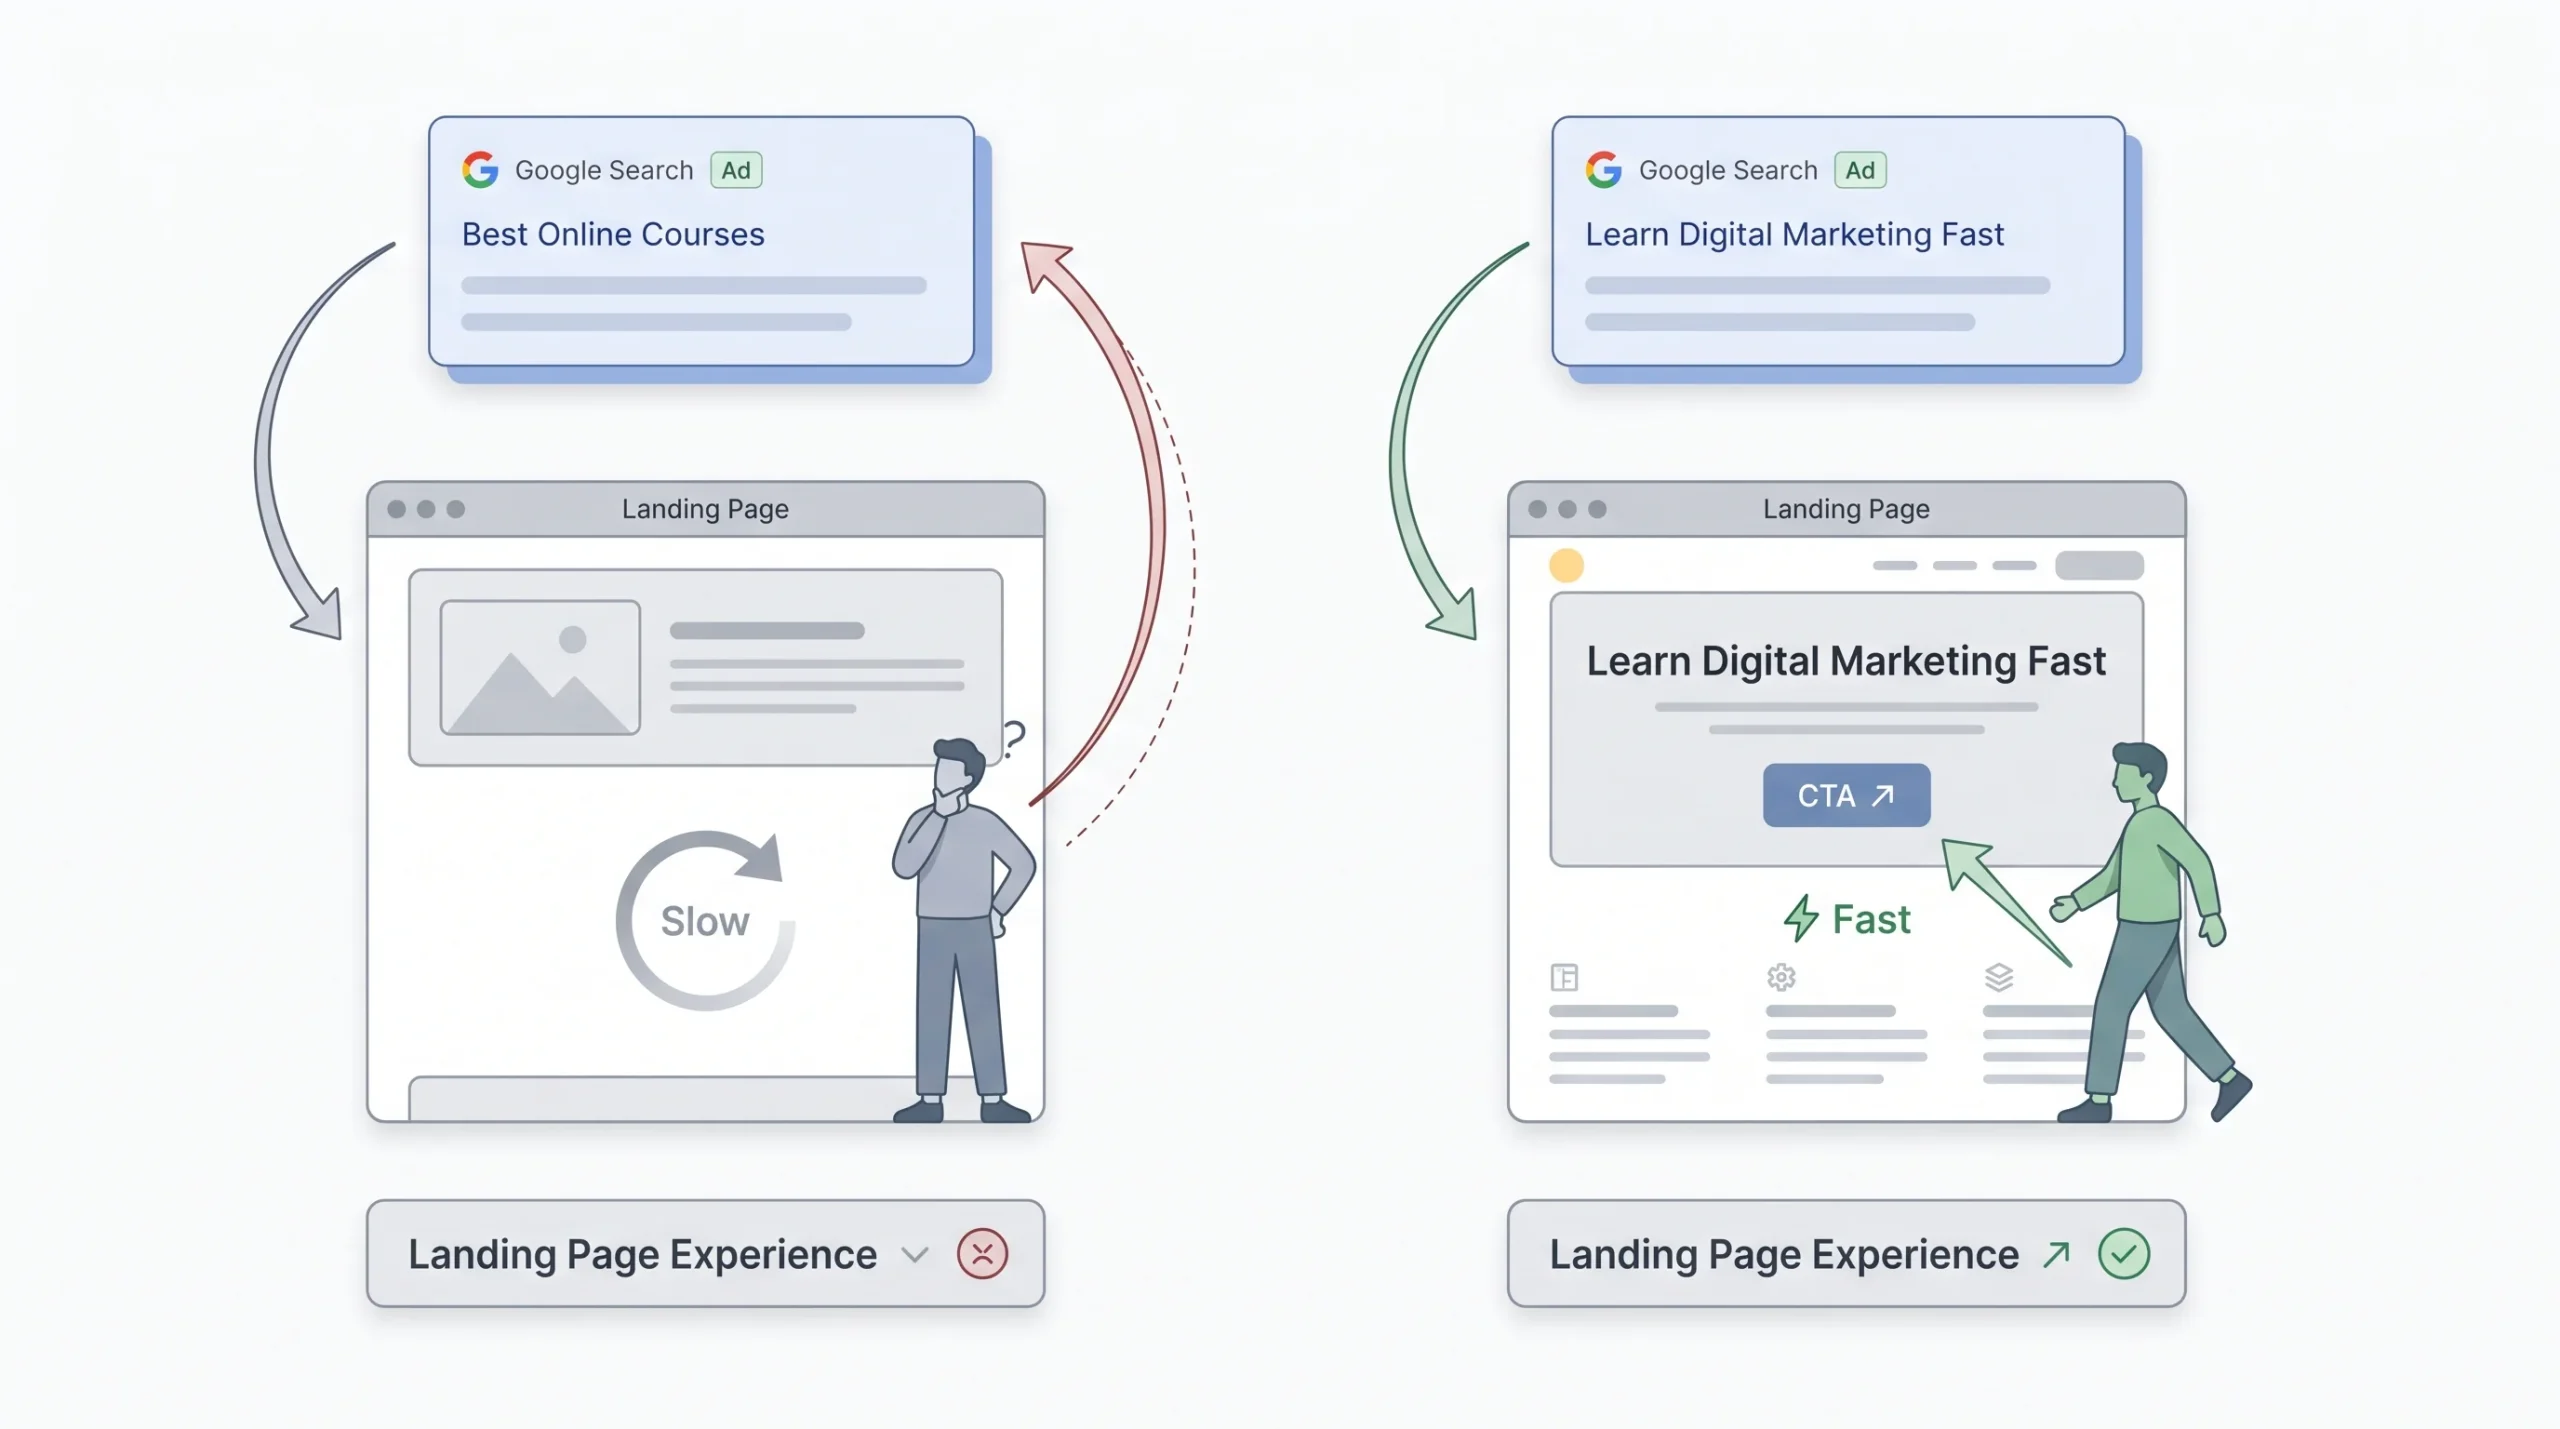
- Send traffic to the most specific, relevant page for that ad group. Never default to the homepage out of laziness
- Make sure the page delivers on the ad’s promise within the first screen. No vague hero sections, no bait-and-switch
- Fix page speed issues, especially on mobile, since slow load times are one of the most common things dragging this score down
- Improve mobile usability specifically. Don’t assume your desktop experience just carries over
- Make navigation and next steps obvious. Clear CTA, no dead ends, no intrusive pop-ups blocking the content someone actually clicked for
- Keep an eye on bounce and engagement rate by landing page in GA4 as a proxy for how much pogo-sticking is happening
If you only have time to fix one thing this month, fix the landing page. It’s consistently the most neglected of the three components, and by most weighting estimates, it carries just as much influence as Expected CTR does.
| Symptom you’re seeing | Likely component | First fix to try |
|---|---|---|
| Low impressions, “Rarely shown” status | Expected CTR or overall Quality Score | Tighten the ad group, rewrite the ad copy |
| High CTR but still an expensive CPC | Landing page experience | Audit page speed and content relevance |
| Ad shows up for oddly unrelated searches | Ad relevance | Review the search terms report, split ad groups |
| High bounce rate right after the click | Landing page experience | Match page content to what the ad promised |
| Dash instead of a score | Not enough data yet | Wait for volume, don’t force a fix |
Does Quality Score Still Matter in the Age of Smart Bidding and Broad Match?
Fair question, and honestly one worth asking directly instead of pretending nothing’s changed.
Google has been pushing advertisers toward automated bidding and broader targeting for a while now, and the visible 1-to-10 score doesn’t get nearly the airtime in Google’s own messaging that it used to. Smart Bidding optimizes toward conversion signals rather than keyword-level tweaks, and broad match casts a much wider net than the tight exact-match window Quality Score is actually measured against. So in an automation-heavy account, that visible score can start to feel disconnected from what’s actually happening in performance.
That said, here’s the thing people get wrong when they conclude it doesn’t matter anymore. The underlying signals, expected CTR, relevance, landing page experience, are still feeding the real-time quality estimate used in every single auction through Ad Rank. Whether or not you’re staring at the 1-to-10 number in your dashboard, those mechanics are still running in the background on every impression.
So the practical takeaway is this: treat the visible score as a diagnostic, not a KPI you optimize in isolation. If your account is healthy and hitting its targets, don’t spiral over a red “below average” label sitting on one keyword. But when something’s actually underperforming, the component breakdown is still one of the fastest ways to figure out where to start digging.
Common Quality Score Mistakes Beginners Make
- Treating Quality Score like a vanity metric and chasing a perfect 10 on every keyword instead of fixing the ones actually costing money
- Assuming any drop in score means something broke, when it might just be normal fluctuation inside that trailing 90-day window
- Dumping dozens of loosely related keywords into one ad group to save setup time, then wondering why relevance tanks
- Sending every single ad to the homepage instead of building out a matched landing page
- Obsessing over ad copy while completely ignoring page speed and mobile experience
- Assuming that switching a keyword’s match type will change its Quality Score. It won’t, since the score is based on historical exact-match search data, not the match type you’ve set
Conclusion
Quality Score was never meant to be a badge you chase for the sake of chasing it. It’s closer to a mirror, showing you whether your ads and your landing pages are actually doing right by the person on the other end of that search. Fix the relevance and the structure first. Get the ad copy and the click-through rate working next. And treat the landing page as the highest-leverage fix you can make, since it’s the one component most advertisers keep putting off. Go pull up your own account this week, sort your keywords by Quality Score, and look at whatever’s sitting at a 3 or a 4. That’s where the real money is being left on the table.
FAQs
What is a good Quality Score in Google Ads?
Anything at 7 or above is considered good and puts you ahead of most advertisers, since the average across accounts sits closer to 5 or 6.
Does Quality Score affect Performance Max or Display campaigns?
No. Quality Score only exists at the keyword level inside Search campaigns. Performance Max, Display, Shopping, and Video don’t have a visible Quality Score, even though the same underlying idea of ad and landing page quality still plays into how those campaign types perform.
Why did my Quality Score drop overnight?
Usually it’s normal movement inside the trailing 90-day data window, not a sign that something is suddenly broken. Look at the component breakdown before making any changes, and give it a little time before assuming it’s a real problem.
Can Quality Score be different for the same keyword in different ad groups?
Yes. Quality Score is calculated based on how that keyword performs alongside the specific ad and landing page it’s paired with in that ad group. Different ad group, different ad, different landing page, potentially a different score, even for the identical keyword.
Does Quality Score reset when I edit my ads?
Not instantly. Quality Score is tied to the keyword’s historical data, so the keyword holds onto its existing score until enough new performance data builds up under the new ad. Better ad copy will gradually pull the score up over time, but there’s no immediate reset the moment you hit save.
How long does it take to improve Quality Score after making changes?
There’s no fixed timeline, since it depends on how much exact-match search volume that keyword gets. Higher volume keywords can show movement within a couple weeks. Lower volume ones can take much longer simply because there isn’t enough fresh data coming in to shift the trailing average.
Is Quality Score the same as Ad Rank?
No, and this is one of the most common mix-ups. Quality Score is a diagnostic score you can actually see in your dashboard. Ad Rank is the real formula Google uses at auction time to decide where your ad shows and what you pay, and it’s built from your bid combined with a real-time quality estimate, one that uses the same kind of signals Quality Score reports on, but isn’t the same visible number.
Does bidding higher improve my Quality Score?
No. Bid amount has nothing to do with how Quality Score is calculated. You can raise your max CPC as much as you want and it won’t move a single one of the three components. What a higher bid does do is help you win a better position or beat a competitor in the auction despite a lower score, but that’s Ad Rank doing its job, not Quality Score improving. If your real goal is a lower CPC long term, throwing more money at the bid is the wrong lever to pull.
Does Quality Score affect my SEO or organic search rankings?
Not at all. Quality Score lives entirely inside the paid Google Ads system. Your organic rankings come from a completely separate set of signals Google uses for regular search results, and nothing about your paid campaigns, Quality Score included, has any pull on where your site lands organically. Plenty of advertisers assume running ads gives their organic listings a boost too. It doesn’t.
What’s the difference between Quality Score and Ad Strength?
They sound similar but they’re measuring different things. Quality Score is tied to a specific keyword and reflects expected CTR, ad relevance, and landing page experience together. Ad Strength is a separate rating, shown as Poor, Average, Good, or Excellent, that looks specifically at your Responsive Search Ad itself: how many headlines and descriptions you’ve written, how relevant they are, and how much variety you’ve given Google to work with. A strong Ad Strength rating can help feed a better Expected CTR, but it isn’t Quality Score, and improving one doesn’t automatically fix the other.
Do broad match keywords get their own Quality Score?
Sometimes, and this trips people up. A broad match keyword can carry a Quality Score even with zero impressions of its own, as long as there’s a corresponding exact match keyword in the same ad group that has picked up impressions for that exact search over the last 90 days. In that case, both keywords end up showing the same score. If there’s no matching exact-match data behind it, you’ll just see the dash again.