

Here’s the thing nobody tells you when you launch a website: speed isn’t just about how fast the spinner disappears. It’s about whether someone can actually tap that “Add to Cart” button without the whole page jumping half an inch to the left first. It’s about whether your blog post shows up in under two seconds or whether someone bounces before they even read your headline. Speed, in the modern sense, is an emotional experience as much as a technical one; it’s the difference between a visitor trusting your site enough to stick around and one who quietly closes the tab without ever telling you why.
For years, “fast website” meant one thing: total load time. You’d run a test, get a number in seconds, and call it a day. That’s not how Google thinks about speed anymore, and honestly, it’s not how real people experience websites either. Nobody sits there with a stopwatch. What they notice is stuff like: did the page feel janky? Did my click register? Did the image I was about to look at suddenly shove itself down the page? These are the micro-frustrations that add up into a macro decision to leave, and they’re exactly what old-school metrics failed to capture.
That shift from “how long did it take” to “how did it feel” is exactly why Google built Core Web Vitals. And look, this isn’t some minor technical footnote buried in a Search Console report. Page experience has become part of how Google evaluates sites, and it’s tangled up with bounce rate, conversions, and yes, rankings too, even if it’s not the silver bullet some SEO threads make it out to be. It’s one piece of a much bigger puzzle, but it’s a piece that touches nearly everything else on that puzzle board.
If you run a website, write code for one, or get paid to make one rank better, you need to understand these three metrics: LCP, INP, and CLS. Not memorise the thresholds and move on — actually understand what’s happening under the hood, why Google picked these specific three, and what breaks when they go wrong. This guide is built to take you from “I’ve heard of Core Web Vitals” to “I can diagnose and fix a failing score on any site I touch.”
What You Will Learn in This Guide
- What Core Web Vitals actually are and why Google introduced them in the first place
- The full story on LCP, INP, and CLS — what each one measures and why it matters
- Realistic, non-generic ways to fix bad scores for each metric
- The difference between lab data and field data, and why your PageSpeed score never matches Search Console
- How Google actually collects this data through CrUX and RUM
- Every major tool you can use to measure Core Web Vitals, and when to use which one
- Vital-specific advice for WordPress sites, eCommerce stores, SaaS platforms, and more
- Common mistakes that quietly wreck your scores even when you think you’ve “fixed” everything
- A real case study showing before-and-after numbers
- A closer look at whether Core Web Vitals actually move the needle for SEO
- Advanced techniques like SSR, edge caching, and performance budgets
- A big FAQ section answering the questions people actually type into Google
Let’s get into it.
What Are Core Web Vitals?
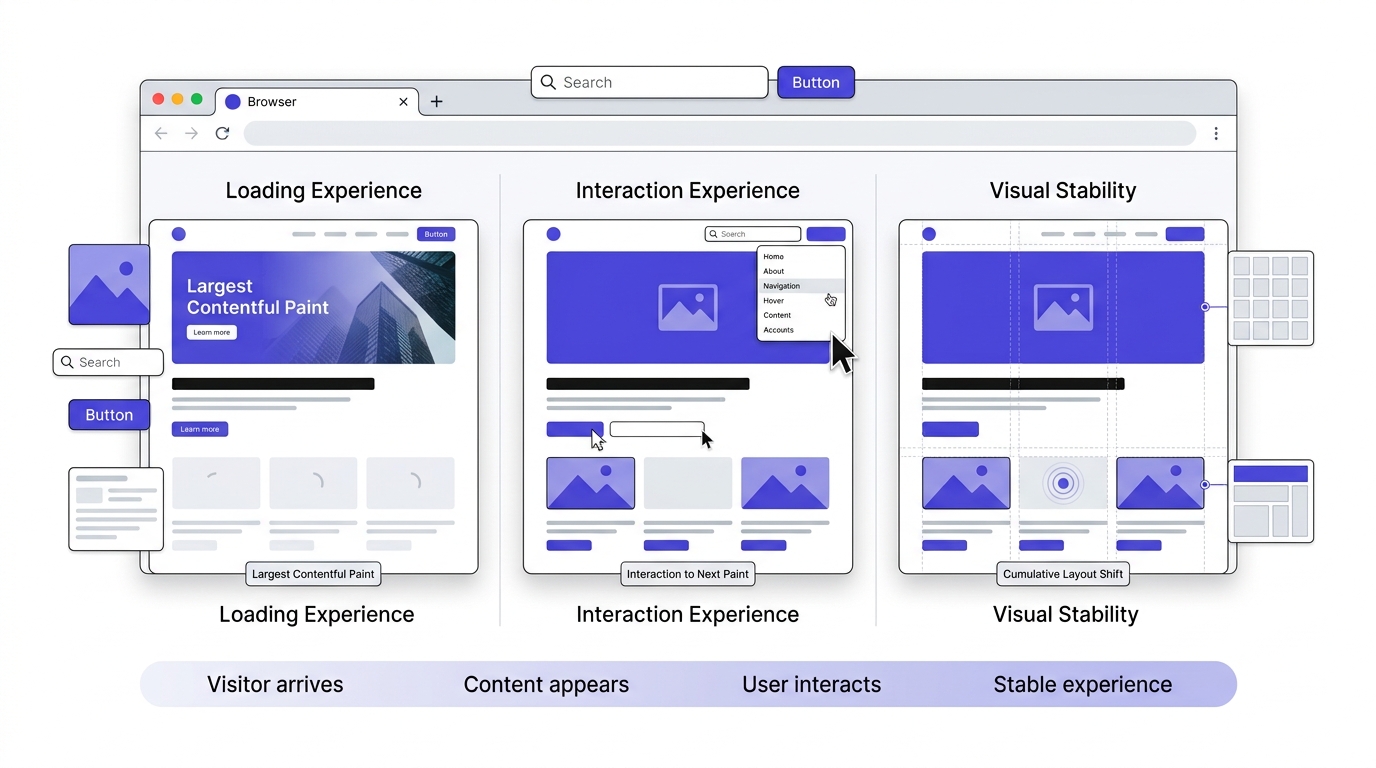
Core Web Vitals are a set of three specific metrics Google uses to measure real-world user experience on a webpage: Largest Contentful Paint (loading), Interaction to Next Paint (responsiveness), and Cumulative Layout Shift (visual stability). They’re a subset of a bigger group of “web vitals,” but these three got promoted to “core” status because Google decided they matter most for how a page actually feels to use. Think of them as the three questions a frustrated user would ask without even realizing they’re asking them.
Notice what’s missing from that list — total load time isn’t one of them. Neither is “time to first byte” on its own, or number of requests, or page weight in megabytes. Those things still matter; sure, they influence the core vitals, but they’re not what gets measured directly. This distinction trips a lot of developers up early on, because they’ll spend hours shaving kilobytes off a page without touching the specific rendering and interaction events Google is actually watching.
Google picked three moments in a user’s journey: when do I see something useful, when I click does something happen quickly, and does the page hold still while I’m trying to read or interact with it. Each of these maps to a distinct phase of a visit, and together they cover nearly the entire emotional arc of “does this website feel good to use.” That’s really the underlying philosophy — measure the feeling, not just the mechanics.
Why Google Introduced Core Web Vitals
Before 2020, page speed advice was kind of a mess. You’d get told to reduce load time, minify your CSS, use a CDN — all true, all useful — but there was no unified standard for what “fast” even meant from a user’s perspective. Different tools measured different things, which meant two developers could both claim their site was “optimized” while using completely different, sometimes contradictory, benchmarks to prove it.
A site could score 95 on one speed test and feel horrible to actually use because that test wasn’t capturing things like layout jank or slow button responses. This gap between “the number looks good” and “the experience feels bad” was the core problem Google needed to solve, because it meant site owners were often optimizing for the wrong thing entirely — chasing a score instead of chasing an actual improvement in how visitors experienced the page.
Google introduced Core Web Vitals in May 2020 to fix that. The idea was simple: stop measuring server-side numbers that don’t map to human experience, and start measuring things people actually notice. So instead of “page load time,” you get “time until the biggest visible element renders.” Instead of vague responsiveness claims, you get an actual measurement of the delay between a click and the next visual update. It was a deliberate move away from server-centric thinking toward user-centric thinking, and it reshaped how the entire web performance industry talks about speed.
Evolution of Google’s Page Experience Signals
Page Experience as a ranking signal didn’t appear overnight either. Google had already been experimenting with mobile-friendliness as a ranking factor, then HTTPS, then intrusive interstitial penalties. Each of these was, in its own way, an early attempt at measuring “does this page respect the user,” long before Core Web Vitals gave that idea a precise, quantifiable shape.
Core Web Vitals folded into that lineage in 2021 as part of the broader Page Experience update, which combined Core Web Vitals with mobile usability, HTTPS security, and safe browsing status. This wasn’t Google inventing a brand-new philosophy out of nowhere — it was Google consolidating years of scattered signals into one coherent framework that developers and SEOs could actually act on.
Then in 2024, Google made a big change: they swapped out First Input Delay (FID) for Interaction to Next Paint (INP) as the responsiveness metric. That wasn’t a small tweak — INP measures something fundamentally different and, frankly, more useful, which we’ll get into later. This swap represented Google admitting that its original responsiveness metric had a real blind spot, and fixing it required years of data collection and testing before INP was ready to take FID’s place.
Core Web Vitals vs Traditional Page Speed Metrics
Old-school metrics like Time to First Byte, DOMContentLoaded, or fully loaded time tell you about the server and the browser’s technical process. They don’t tell you what the user actually experienced while sitting there waiting. These metrics are useful diagnostically — they tell developers where time is being spent — but they were never designed to represent a human’s subjective sense of “is this fast.”
A page might technically “finish loading” in 1.2 seconds but the actual content the user cares about — the hero image, the headline, the product photo — might not show up until 4 seconds in, buried behind ads and trackers that loaded first. This is a classic case where the technical finish line and the perceived finish line are completely different points in time, and only one of them actually matters to the person sitting there waiting.
Core Web Vitals fix that gap by focusing on perceived experience instead of technical completion. That’s the whole point. Instead of asking “when did the browser stop working,” Core Web Vitals ask “when did the human stop waiting,” which is a far more honest and far more useful question for anyone trying to build a site people actually enjoy using.
Why Core Web Vitals Matter for SEO
Google has said, more than once, that Core Web Vitals are a ranking signal — a small one, sitting alongside hundreds of other factors, but a real one. It’s easy to either overestimate or dismiss this entirely, and both reactions miss the nuance: it’s not a magic lever, but it’s also not nothing, and ignoring it entirely leaves potential ranking gains on the table.
More importantly, they correlate strongly with things that do matter a ton for SEO indirectly: bounce rate, session duration, conversion rate. A page that loads slow and jumps around loses visitors before Google even gets a chance to rank it for anything, which means the ranking impact isn’t just direct — it’s also baked into every downstream behavioral signal Google collects about how people actually use your site.
A page that fails Core Web Vitals badly enough will often show weak engagement metrics regardless of how good the content is, simply because visitors never stick around long enough to engage with that content in the first place. So even setting aside the direct ranking signal, fixing Core Web Vitals is really about protecting every other SEO effort you’re already making from being undermined by a bad technical experience.
How Core Web Vitals Impact User Experience
Think about the last time you tried to read an article on your phone and an ad loaded halfway through, shoving the paragraph you were reading down the screen. Annoying, right? That single moment of disorientation is enough to break someone’s trust in a site, even if they can’t articulate exactly why they suddenly feel like leaving.
Or you tapped a menu button and nothing happened for two full seconds, so you tapped again, and then both taps registered and opened two menus. That’s INP and CLS failing in real time, and it’s the kind of failure that doesn’t show up in a load-time number at all — it only shows up when you’re actually trying to use the page like a real person would.
These aren’t rare edge cases either. They happen constantly across the web, on sites that would otherwise look “fast” by traditional standards, which is exactly why Google needed metrics specifically designed to catch this category of frustration. The gap between “technically loaded” and “actually usable” is where most of the modern web’s worst experiences live.
Real-World Examples of Good vs Poor User Experience
A poor experience: you land on an eCommerce product page, the price and “Buy Now” button are visible immediately, but then a promotional banner loads above it and pushes everything down just as you’re about to tap. You end up clicking on the banner instead. That’s a CLS failure costing a sale, and it’s the kind of thing that happens thousands of times a day across the web without site owners ever realizing why their conversion rate quietly underperforms.
A good experience: you land on a blog post, the hero image and headline render almost instantly because they were preloaded, the page doesn’t shift as ads and fonts finish loading because space was reserved for them, and when you tap a “read more” link, the content expands within milliseconds. This kind of experience feels almost invisible — which is exactly the goal, because good performance shouldn’t draw attention to itself.
Nothing jumps, nothing lags. You don’t even think about the technology — which is exactly the point. The best compliment a fast, stable page can get is that nobody notices it at all, because their entire attention stayed on the content instead of fighting with the interface.
Understanding Google’s Page Experience Update
The Page Experience update, rolled out through 2021, bundled Core Web Vitals together with existing signals — mobile-friendliness, safe-browsing status, HTTPS usage, and the absence of intrusive interstitials — into one combined “page experience” signal used in ranking systems. This bundling mattered because it signaled that Google was treating the overall quality of visiting a page as a single connected concept rather than a handful of isolated checkboxes.
It wasn’t a single overnight algorithm flip; Google rolled it out gradually across mobile first, then desktop in 2022. This staged rollout gave site owners time to adjust, and it also gave Google time to observe how the signal behaved across a huge diversity of real-world sites before applying it more broadly.
The gradual approach also meant that panic reactions — sites making drastic, rushed changes the moment the update was announced — were often unnecessary, since the actual ranking impact phased in slowly rather than hitting all at once.
Timeline of Core Web Vitals
| Year | Event |
|---|---|
| 2020 (May) | Core Web Vitals officially introduced by Google |
| 2021 (June–Aug) | Page Experience update rolls out for mobile search |
| 2022 (Feb) | Page Experience signal extended to desktop |
| 2023 | Google begins deprecating FID in favor of INP in reporting tools |
| 2024 (March) | INP officially replaces FID as the third Core Web Vital |
This timeline shows a pattern worth noticing: Google rarely makes abrupt changes to these systems. Each major shift was preceded by months, sometimes years, of public data collection, beta testing, and community feedback before becoming an official part of the ranking framework, which is a useful thing to remember the next time a new “core web vital” rumor starts circulating.
How Page Experience Fits Into Google’s Ranking Systems
Page experience is one signal among hundreds Google’s ranking systems weigh. It doesn’t override content quality, relevance, or authority. This is probably the single most misunderstood part of the entire topic, because it’s tempting to treat a ranking factor as if it operates in isolation, when in reality it’s one voice in a very large chorus of signals.
Google has repeatedly said that a page with genuinely useful, relevant content will still outrank a technically “faster” page with thin content. This should be reassuring to site owners who are strong on content but weaker on technical polish — it means the fix-everything-or-fail-completely anxiety around Core Web Vitals is largely unfounded.
Page experience acts more like a tiebreaker among similarly relevant results. When two pages are roughly equal in terms of how well they answer a search query, the one that’s faster and more stable to use gets a nudge ahead — but it’s rarely, if ever, the deciding factor on its own.
Does Passing Core Web Vitals Guarantee Higher Rankings?
Nope. This is honestly one of the most misunderstood parts of the whole topic. Passing all three Core Web Vitals thresholds doesn’t guarantee anything, and treating a “Good” score as a finish line rather than a baseline is one of the most common strategic mistakes site owners make.
Plenty of sites with perfect scores rank poorly because their content just isn’t as good as competitors’. A blazing-fast page built around thin, unhelpful content will still lose to a slower page that actually answers the searcher’s question thoroughly and credibly.
Meanwhile, sites with mediocre vitals scores can rank #1 because everything else about them is stronger. Core Web Vitals are a floor, not a ceiling — they remove a potential obstacle to ranking well, but they don’t actively push you to the top on their own. Understanding this distinction keeps expectations realistic and keeps effort focused where it actually pays off.
Common Myths About Page Experience
A few myths keep circulating, and each one causes real, avoidable mistakes. One: “100/100 PageSpeed score means guaranteed top rankings” — false, PageSpeed score and Core Web Vitals pass/fail status aren’t even the same thing, and chasing a perfect Lighthouse number often wastes time that would be better spent elsewhere.
Two: “Core Web Vitals only matter for mobile” — false, desktop has its own thresholds and gets evaluated too, and while mobile does tend to get more attention because of traffic share, ignoring desktop entirely leaves a real gap in your performance strategy.
Three: “installing a caching plugin fixes everything” — also false, plugins help but can’t fix fundamentally bloated page structures or bad JavaScript. A caching plugin is a patch over deeper architectural issues, not a substitute for actually addressing why a page is slow or unstable in the first place.
The Three Core Web Vitals at a Glance
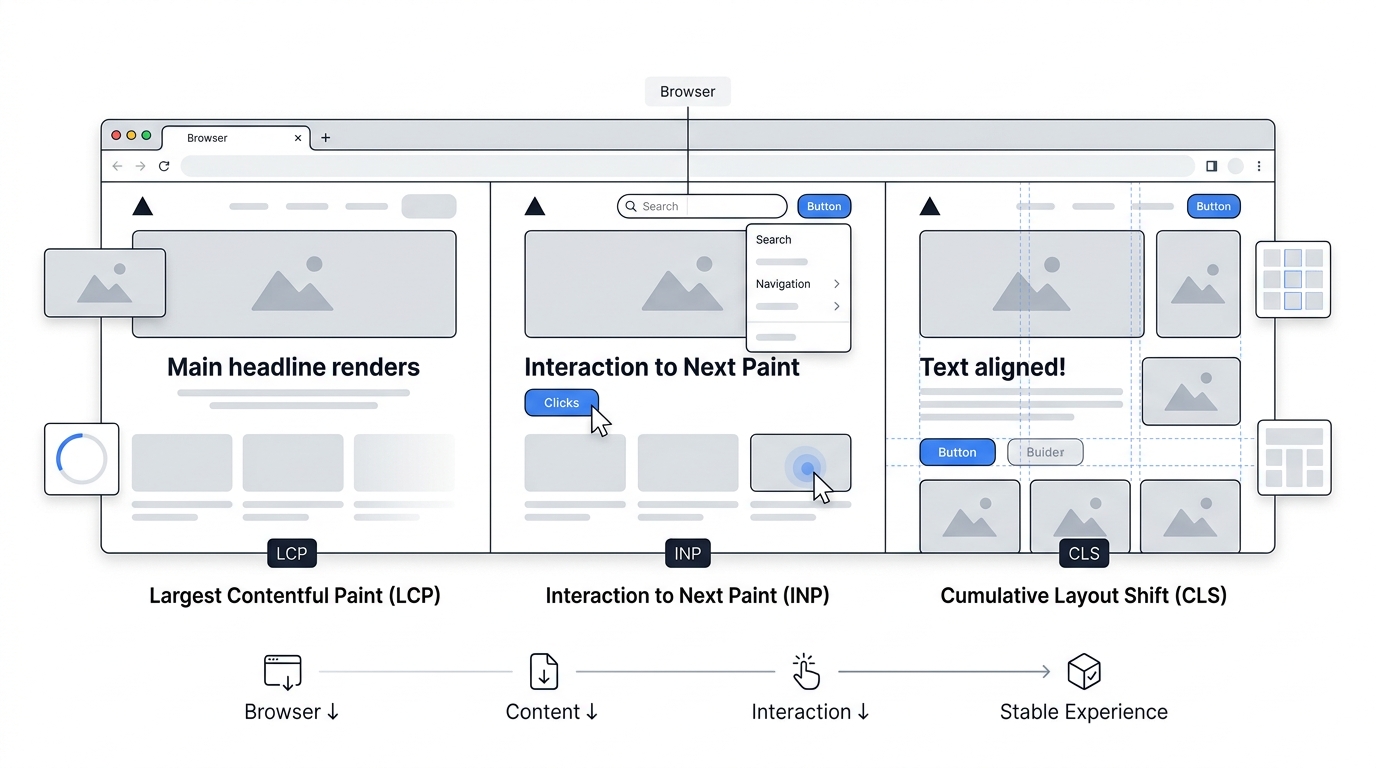
Largest Contentful Paint (LCP)
LCP measures loading performance. Specifically, it tracks the render time of the largest image or text block visible within the viewport, from the moment the page starts loading. It’s designed to represent the single most meaningful “arrival” moment on a page — the point where the user finally sees the thing they actually came for.
Good LCP is 2.5 seconds or less. This threshold isn’t arbitrary; it reflects extensive research into how quickly a delay starts to feel noticeable and frustrating to a real person sitting on a real device, rather than a number picked to be conveniently round.
Because LCP is often driven by a single dominant element — a hero image, a big headline — it tends to be one of the more diagnosable and fixable of the three vitals once you know exactly which element is being measured on a given page.
Interaction to Next Paint (INP)
INP measures responsiveness across the entire page visit, not just the first interaction. This is a crucial distinction from its predecessor metric, because a site can feel great on the very first click and still be a nightmare to use by the tenth interaction, once JavaScript workloads and memory pressure build up.
It looks at the delay between when a user interacts with the page — clicking, tapping, typing — and when the browser actually paints the next frame reflecting that interaction. This end-to-end view captures the full experience of “I did something, now what happens,” which is exactly the moment where users start to feel like a site is broken or sluggish.
Good INP is 200 milliseconds or less. Because INP samples across an entire visit rather than a single moment, it tends to be one of the harder vitals to fully control, since it depends on everything a user might click throughout their time on the page.
Cumulative Layout Shift (CLS)
CLS measures visual stability. It calculates how much visible content shifts unexpectedly during the page’s lifecycle, capturing a type of frustration that’s uniquely visual and uniquely disruptive compared to the other two metrics.
Good CLS is a score of 0.1 or less. Unlike LCP and INP, CLS isn’t measured in time — it’s a unitless score derived from how much of the screen moved and how far, which makes it a bit more abstract to reason about at first but no less important in practice.
CLS failures are often the easiest to notice as a user and, once you understand the mechanics, some of the easiest to prevent as a developer, since most shifts trace back to a small handful of predictable causes like unsized images or late-loading banners.
Recommended Thresholds
| Metric | Good | Needs Improvement | Poor |
|---|---|---|---|
| LCP | ≤ 2.5s | 2.5s – 4s | > 4s |
| INP | ≤ 200ms | 200ms – 500ms | > 500ms |
| CLS | ≤ 0.1 | 0.1 – 0.25 | > 0.25 |
These thresholds aren’t just numbers to memorize — they represent the boundary between “the user probably didn’t notice a problem” and “the user is now actively frustrated.” Google recalibrates and validates these thresholds against real usability research rather than picking them arbitrarily, which is why they’ve held up reasonably well since being introduced, aside from the FID-to-INP swap. Treat “Good” as your minimum bar, “Needs Improvement” as a warning sign worth investigating soon, and “Poor” as an active problem actively costing you visitors and, potentially, rankings.
Why These Three Metrics Were Chosen
Google didn’t pick these at random. They represent three distinct phases of a page visit: arrival (does content show up), interaction (does the page respond), and stability (does it stay put). This three-phase framing is elegant precisely because it’s exhaustive — almost any performance complaint a real user might have falls neatly into one of these buckets.
Nearly every bad web experience falls into one of those three buckets, which is why these three were enough to cover the majority of real user complaints without overcomplicating things with a dozen metrics nobody would actually track. Google could have chosen to track a much wider set of granular metrics, but doing so would have made the framework harder to act on and harder to communicate to the average developer or business owner.
By narrowing the focus to three well-chosen metrics, Google made it possible for non-specialists to understand, at a glance, roughly what’s wrong with a page and roughly what kind of fix is needed — which is a big part of why Core Web Vitals caught on as broadly as they did across the industry.
How They Work Together
These metrics aren’t independent silos — they interact, and understanding those interactions is often the key to fixing multiple problems with a single change instead of treating each vital as its own separate project.
A page with heavy JavaScript execution can hurt both LCP (delaying render) and INP (delaying interaction response). This is because the browser’s main thread is a shared, finite resource — every millisecond spent parsing and executing unnecessary scripts is a millisecond not spent painting content or responding to clicks.
A page that lazy-loads images incorrectly can hurt both LCP (delayed hero image) and CLS (images popping in without reserved space). Fixing one often improves the others, and ignoring one can quietly sabotage your progress on the rest, which is why the most effective optimization strategies tend to target root causes — like bloated JavaScript or unreserved layout space — rather than chasing each metric in isolation.
Largest Contentful Paint (LCP)
What Is LCP?
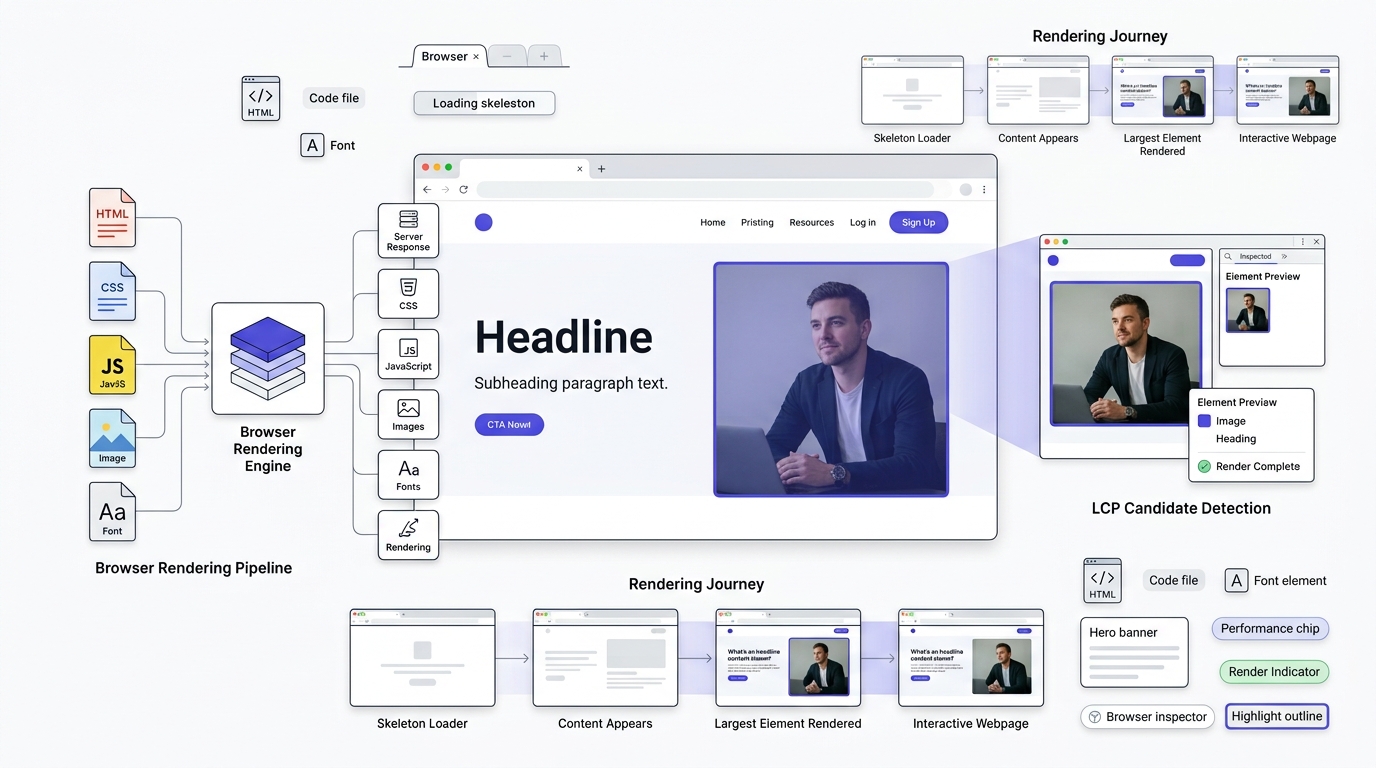
LCP identifies the largest visible element in the viewport — usually a hero image, a big heading, or a background image — and measures how long it takes to render after the user starts loading the page. The logic behind focusing on the “largest” element is that it’s usually the piece of content the user is most likely to be waiting for, whether that’s a product photo, an article’s featured image, or a prominent headline.
It’s meant to represent “when does the main content actually show up,” which is way more meaningful to users than “when did every single asset on the page finish loading.” A page can technically still be downloading fonts, tracking scripts, and footer content in the background while LCP has already been satisfied, because none of that matters to the user’s immediate sense of “did the page load.”
This focus on the dominant visual element is what makes LCP such a useful proxy for perceived loading speed — it aligns closely with what a person would actually point to if you asked them “when did this page finish loading” in casual conversation.
How LCP Is Measured
The browser continuously watches for render events and keeps updating which element is the “largest” candidate until the page becomes interactive or the user interacts with it, whichever comes first. This means the “largest element” isn’t fixed in advance — it can change several times as the page loads, especially if a bigger image or block of text renders later than an initially larger placeholder.
Once that’s locked in, LCP is the timestamp of when that final largest element finished rendering. Because the browser stops updating the candidate once the user interacts with the page, early interactions can sometimes freeze the LCP calculation before the “real” largest element has even appeared, which is a subtlety worth knowing when debugging unexpected LCP values.
Understanding this measurement process matters practically, because it means developers should check exactly which element Chrome has flagged as the LCP candidate before trying to optimize it — optimizing the wrong element wastes time and won’t move the score.
What Counts as the Largest Content Element?
Typically it’s an <img> tag, a <video> poster frame, a background image set via CSS, or a block-level text element like a paragraph or heading. This range of eligible element types means LCP isn’t exclusively an “image problem” — text-heavy pages can just as easily have their LCP element be a large heading or intro paragraph.
Things like <svg> backgrounds sometimes get excluded depending on browser implementation, which trips people up when they’re debugging why their LCP element isn’t what they expected. This is a common source of confusion during audits, where a developer assumes the hero banner is the LCP element only to discover Chrome has actually flagged a different piece of content entirely.
The safest approach is always to check directly using DevTools or a measurement tool rather than assuming which element is being tracked, since guessing wrong means optimizing the wrong part of the page.
Good vs Needs Improvement vs Poor LCP Scores
Under 2.5 seconds is good. Between 2.5 and 4 seconds needs improvement. Anything past 4 seconds is poor, and honestly at that point, users are already leaving before they see anything.
These bands matter because user tolerance for delay isn’t linear — the frustration a person feels doesn’t grow gradually and evenly as seconds pass, it tends to spike sharply once a certain threshold is crossed, which is part of why Google’s bands aren’t evenly spaced either.
Treat the “Needs Improvement” range as an early warning rather than a passing grade — pages sitting in that zone are typically one small regression away from tipping into “Poor,” especially as content, ads, and scripts get added over time.
Common Causes of Poor LCP
Slow server response. If your server takes 2 seconds just to respond with the initial HTML, you’ve already blown your LCP budget before a single image loads. Every millisecond spent waiting on the server is a millisecond the browser can’t even begin working on rendering anything, which makes this the single most foundational bottleneck to check first.
Render-blocking resources. CSS and JavaScript files that the browser has to download and process before it can paint anything will delay LCP directly. These files effectively put a pause on rendering until they’re fully handled, regardless of how fast the rest of the page’s assets are.
Large images. A 4MB hero image sitting uncompressed at the top of the page is one of the single most common LCP killers out there, and it’s also one of the easiest to fix once identified, since compression tools can often cut file size by 70-90% with no visible quality loss.
Slow fonts. Custom web fonts that block text rendering until they download can delay your LCP text element significantly, especially on font-heavy designs using several weights and styles simultaneously.
Heavy JavaScript. If your LCP element gets injected by JavaScript rather than present in the initial HTML, the browser has to wait for scripts to execute first, which adds an entire extra layer of delay compared to content that’s already in the raw HTML response.
Client-side rendering delays. Single-page apps that render everything client-side often show a blank screen for a second or two before any content appears — a classic LCP trap that’s especially common in modern JavaScript framework-heavy builds.
How LCP Affects SEO and User Experience
A slow LCP means visitors are staring at a blank or half-loaded screen for several seconds. That waiting period is dead time from the user’s perspective — no content, no feedback, nothing to engage with, which is exactly the kind of experience that erodes patience fastest.
That’s exactly the kind of experience that drives people to hit the back button, and high bounce rates paired with low dwell time send a pretty clear signal that something’s off with the page. Search engines interpret these behavioral patterns as indirect evidence of a poor experience, even beyond the direct LCP measurement itself.
Beyond the SEO angle, slow LCP has a very real business cost — every extra second of loading delay has been shown across countless studies to correlate with measurable drops in conversion rate, particularly on mobile devices and slower networks.
How to Improve Largest Contentful Paint
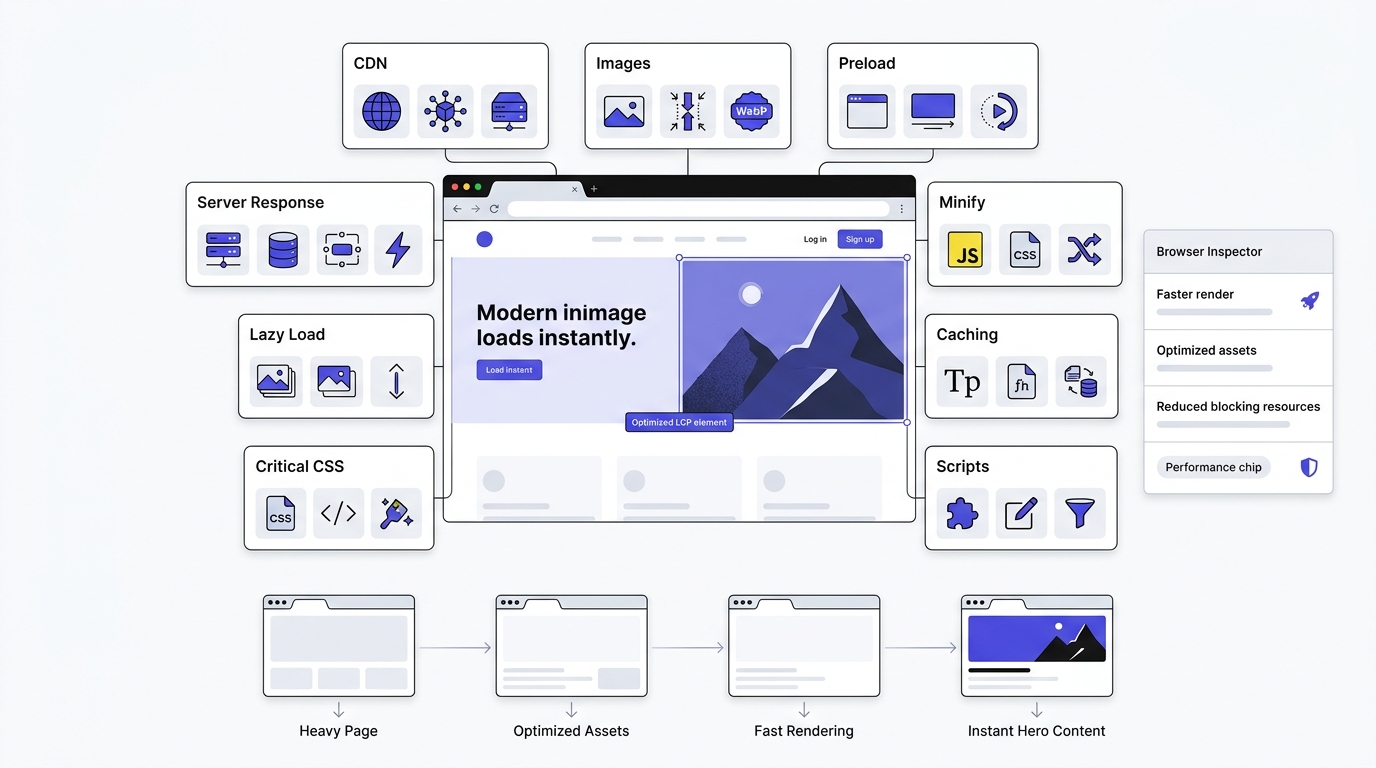
Optimize Server Response Time
Look at your Time to First Byte first. If your server is slow — bad hosting, unoptimized database queries, no server-side caching — nothing downstream matters. Fix this before touching anything else, because every other LCP optimization technique is essentially fighting for milliseconds against a foundation that’s already lost seconds.
Server response time is often overlooked because it’s less visible than front-end issues like image size, but it’s frequently the single biggest lever available, especially on sites running on cheap shared hosting or poorly optimized database-driven platforms like WordPress with bloated plugins.
Start by measuring TTFB directly, identify whether the bottleneck is hosting infrastructure, database queries, or application logic, and address whichever layer is actually causing the delay rather than guessing.
Use a CDN
Serving assets from servers geographically close to your users cuts latency dramatically. If your visitors are in India and your server’s in Virginia, that round trip adds real, measurable delay to every request, and that delay compounds across every single asset the page needs to fetch.
A CDN essentially creates copies of your static content distributed across servers worldwide, so instead of every visitor reaching back to one origin server, they’re served from whichever node is physically closest to them.
This is one of the highest-leverage, lowest-effort changes most sites can make, since modern CDN setup has become dramatically simpler than it used to be, often requiring little more than a DNS change or a plugin integration.
Compress Images
This sounds basic because it is, and yet it’s still the number one issue on most sites. Despite being one of the oldest and most well-known performance tips in existence, unoptimized images remain shockingly common across live production websites.
Use tools to compress JPEGs and PNGs without visible quality loss before they ever touch production. Building compression into your upload or deployment pipeline, rather than relying on manual effort each time, ensures this fix stays in place as your site grows and content gets added over time.
The visual quality tradeoff at reasonable compression levels is nearly imperceptible to the human eye, which makes this one of the rare optimizations with essentially zero downside.
Serve Next-Gen Image Formats
WebP and AVIF produce dramatically smaller file sizes than JPEG or PNG at similar visual quality. These newer formats use more advanced compression algorithms specifically designed for the web, squeezing out file size savings that older formats simply can’t match.
Switching your hero images to these formats alone can shave a full second off LCP on image-heavy pages, particularly for sites like eCommerce stores or photography portfolios where large, detailed images are central to the experience.
Browser support for these formats has become nearly universal, which means there’s very little reason left to avoid adopting them, especially with fallback mechanisms available for the rare older browser that doesn’t support them.
Lazy Load Non-Critical Images
Images below the fold shouldn’t load immediately — that’s bandwidth stolen from your LCP element. Every byte the browser spends downloading an image the user hasn’t scrolled to yet is a byte not spent getting the visible, important content in front of them faster.
Lazy loading defers them until they’re needed, typically triggering the download only as the user scrolls near that part of the page. This technique has become so standard that most modern browsers now support native lazy loading through a simple HTML attribute, removing the need for a heavier JavaScript library in many cases.
The key caveat is making sure this technique is applied correctly and never to the LCP element itself, which we’ll cover more in the mistakes section later.
Preload Hero Images
If your LCP element is a specific image, add a <link rel="preload"> tag for it in the document head so the browser starts fetching it immediately instead of discovering it late in the parsing process. Without this hint, the browser might not discover the image URL until it parses much further down the HTML or even until CSS has been processed, wasting valuable early loading time.
Preloading essentially jumps the queue for that one critical resource, telling the browser “fetch this one first, above everything else that isn’t strictly necessary for the initial paint.”
This is a small, surgical change that can produce a disproportionately large improvement, especially on pages where the LCP image is buried deep in the markup or loaded via CSS background properties.
Reduce CSS Blocking
Inline your critical, above-the-fold CSS directly in the HTML and defer the rest. This lets the browser paint immediately instead of waiting on an external stylesheet download and parse cycle before it can render anything visible at all.
The idea is to give the browser just enough styling information to render what’s initially visible, while everything needed for content further down the page loads in a way that doesn’t block that first paint.
This technique requires some build-process tooling to extract and inline the right CSS automatically, but many modern frameworks and build tools now offer this as a built-in or plugin-supported feature.
Minify CSS and JavaScript
Stripping whitespace, comments, and unnecessary characters from your code reduces file size and parse time. On its own, minification of a single file produces a small gain, but across dozens of CSS and JavaScript files on a typical modern site, those small gains add up into a meaningful overall reduction.
Minification is typically automated as part of a build pipeline these days, so it’s less about manual effort and more about making sure your deployment process actually includes this step rather than shipping raw, unminified source files to production.
Combined with compression like Brotli or Gzip, minified files see even greater size reductions, since minified code tends to compress more efficiently than code full of whitespace and repeated formatting patterns.
Remove Unused Code
Most sites ship way more CSS and JavaScript than they actually use. This bloat tends to accumulate gradually — a plugin here, a library there, a feature that was tested but never fully removed — until the total codebase is carrying significant dead weight.
Auditing and removing dead code reduces both file size and parsing overhead, since browsers still have to download and, in the case of JavaScript, at least partially parse code even if it’s never executed.
Tools like coverage reports in Chrome DevTools can show exactly which portions of your CSS and JavaScript are actually being used on a given page, making it much easier to identify and safely remove the rest.
Optimize Web Fonts
Use font-display: swap so text renders with a fallback font immediately instead of staying invisible while custom fonts download. Without this setting, browsers often hide text entirely until the custom font finishes loading, creating an invisible-text period that directly delays LCP if your text is the largest element.
With swap, users see readable content immediately using a system font, and the custom font gracefully takes over once it’s ready, giving you the best of both worlds — fast initial content and eventual brand-consistent typography.
Subsetting fonts to only the character sets you actually need, and self-hosting rather than relying on third-party font services, can further cut down on font-related loading delays.
Improve Caching
Proper cache headers mean returning visitors don’t re-download assets they already have, which speeds up every subsequent page load dramatically. First-time visitors still have to download everything, but caching transforms every return visit into a noticeably faster experience.
This matters more than people often realize for sites with high repeat traffic — blogs with regular readers, SaaS dashboards used daily, eCommerce stores visited across multiple sessions before a purchase — since caching compounds its benefit across every subsequent visit.
Setting appropriate cache expiration times for different asset types, and using cache-busting techniques for files that do change, keeps this system working reliably as your site is updated over time.
Reduce Third-Party Scripts
Every ad network, analytics tool, and chat widget adds its own network requests and JavaScript execution. Each of these third-party integrations was likely added for a good reason at some point, but they rarely get revisited once installed, leading to a slow accumulation of performance overhead.
Audit these regularly — most sites are running scripts nobody remembers adding, sometimes leftover from a marketing campaign, an old A/B test, or a vendor relationship that ended long ago but whose tracking code never got removed.
A periodic third-party script audit, ideally every few months, is one of the highest-value maintenance tasks a site owner can do, since these scripts are often responsible for a disproportionate share of both LCP and INP problems.
Interaction to Next Paint (INP) Explained
What Is INP?
INP measures how responsive a page is throughout the entire visit. It captures the time between a user’s interaction — a click, tap, or keypress — and when the browser visually updates in response. This full-visit scope is what sets INP apart from simpler, single-moment responsiveness metrics used in the past.
Unlike older metrics that only measured the first interaction, INP considers all interactions during a session and reports the worst (or near-worst) one. This design choice reflects a simple truth: a user’s frustration doesn’t stop mattering just because it happened on their fifth click instead of their first.
By capturing responsiveness across an entire session, INP gives a much more honest picture of whether a page actually holds up under real, sustained use rather than just making a good first impression.
Why INP Replaced First Input Delay (FID)
FID only measured the delay before the browser started processing the first input — it completely ignored how long that processing actually took, and it ignored every interaction after the first one. This was a significant blind spot, because a site could technically pass FID with flying colors while still being genuinely painful to use in practice.
So a page could have a great FID score and still feel completely broken if, say, clicking “Add to Cart” on the fifth product froze the page for a full second. This kind of scenario was common on JavaScript-heavy eCommerce and SaaS sites, where early interactions felt fine but performance degraded as more scripts loaded and more state accumulated in the page.
INP fixes that blind spot by looking at the whole picture, measuring not just whether the browser started responding but how long the entire interaction — start to visual update — actually took, and doing so across the full duration of a user’s visit rather than a single early moment.
How INP Measures Responsiveness
INP tracks the full lifecycle of an interaction: input delay (time before the event handler starts running), processing time (how long the handler and resulting work takes), and presentation delay (time until the browser paints the next frame). Breaking the interaction into these three distinct phases lets developers pinpoint exactly where within an interaction the slowdown is actually happening.
All three combined make up the interaction’s latency, and INP reports roughly the worst interaction observed during the page visit. This “worst interaction” framing is intentional — it ensures that even a single severely broken interaction can’t hide behind a bunch of otherwise fast, snappy ones.
Understanding this three-phase breakdown is genuinely useful for debugging, since a long input delay points to main-thread congestion, a long processing time points to inefficient event handler code, and a long presentation delay often points to expensive rendering or layout work happening after the handler finishes.
What Is Considered a User Interaction?
Clicks, taps, and key presses count. These are the discrete, intentional actions a user takes when they expect something specific to happen in direct response — pressing a button, typing into a field, tapping a menu item.
Scrolling and hovering do not — those are treated as continuous gestures rather than discrete interactions, which is why scroll jank isn’t captured by INP directly. This distinction exists because scrolling and hovering don’t have a clean, single “start and expected response” structure the way a click or keypress does.
Though scroll jank isn’t captured by INP directly, it can still hurt user experience in other ways, and it’s worth monitoring separately even though it won’t show up in your official Core Web Vitals score.
Good vs Needs Improvement vs Poor INP Scores
Under 200ms is good. Between 200ms and 500ms needs improvement. Over 500ms is poor — and at that point, users genuinely feel like the site is broken or frozen.
These thresholds are grounded in human perception research showing that responses under roughly 100-200ms feel instantaneous to most people, while delays beyond that start to register consciously as lag, and delays beyond 500ms start to feel like something has actually gone wrong.
Because INP is measured across all interactions, achieving consistently good scores requires attention not just to your busiest, most obvious interactive elements but to every single clickable or tappable thing on the page, since any one of them can become the “worst” interaction that determines your score.
Real-World Examples of Poor INP
A dropdown menu that takes a full second to open after you tap it. This kind of delay is especially jarring because dropdown menus are expected to feel instantaneous — there’s no loading state the user is mentally prepared to wait through, so any lag feels like an outright malfunction.
A search box where typing feels laggy because a heavy autocomplete function runs on every keystroke. This is a particularly common INP trap in modern web apps, where developers wire up expensive filtering or API calls directly to every single character typed, without any debouncing or throttling to ease the load.
An “Add to Cart” button that shows no feedback for nearly a second, so users tap it three or four times, sometimes accidentally adding multiple units. This example shows how INP failures don’t just annoy users — they can create genuine functional problems and business costs, like accidental duplicate orders or confused customers.
Why INP Matters for SEO and UX
A slow, unresponsive page frustrates users in a way that’s honestly worse than slow loading — at least with slow loading you’re waiting for something to start. There’s a psychological difference between passive waiting and active frustration, and INP failures fall squarely into the latter, more damaging category.
With bad INP, you’re actively trying to use the page and it’s fighting you. This sense of the interface actively resisting the user’s intent tends to generate stronger negative feelings than passive waiting does, because it feels less like “the internet is slow” and more like “this website is broken.”
That frustration shows up in abandoned carts, rage clicks, and people leaving mid-task, all of which are exactly the kind of behavioral signals that damage both conversion rates directly and, indirectly, the broader engagement metrics that feed into how search engines evaluate page quality.
How to Improve Interaction to Next Paint
Reduce JavaScript Execution Time
The biggest single lever for INP. Audit your JavaScript bundles and find what’s actually running heavy computation on the main thread during interactions, since the main thread is the shared resource that both your event handlers and the browser’s rendering work have to compete for.
Profiling tools in Chrome DevTools can show exactly which functions are consuming the most time during a given interaction, letting you target your optimization efforts at the actual bottlenecks rather than guessing.
Often, a small number of expensive functions are responsible for the majority of INP problems, which means targeted fixes can produce outsized improvements compared to broad, unfocused optimization efforts.
Break Long Tasks
Any JavaScript task running longer than 50ms blocks the main thread and delays interaction responses. During that block, the browser literally cannot respond to any user input, no matter how simple that input might be, because the single main thread is fully occupied.
Break large functions into smaller chunks using techniques like setTimeout scheduling or the Scheduler API so the browser can breathe between them. This effectively creates small windows of opportunity where the browser can process pending user interactions before continuing with the rest of the computational work.
This technique requires some restructuring of existing code but tends to produce very tangible, measurable improvements in perceived responsiveness once implemented correctly.
Optimize Event Handlers
Click and input handlers should do the minimum work necessary immediately, deferring anything non-critical (like analytics tracking) to run after the visual update happens. The user’s expectation is that the visible response to their action happens first — anything that doesn’t need to happen before that visual feedback should be pushed later.
A common pattern is to update the UI state immediately, then handle logging, tracking, or secondary side effects asynchronously afterward, so the user never has to wait on work they don’t actually care about seeing.
This reordering of priorities within event handlers is often a low-effort, high-impact change, since it doesn’t necessarily reduce total work, just reorders when that work happens relative to what the user perceives.
Remove Unnecessary Scripts
Old tracking pixels, unused A/B testing tools, abandoned chat widgets — these accumulate over time on most sites and quietly eat into your interaction budget. Much like the LCP-related third-party script problem, this bloat tends to build up silently over months and years of incremental additions.
A periodic audit specifically looking for scripts that are no longer actively used or needed can uncover surprising amounts of dead weight, especially on sites that have gone through multiple redesigns, marketing campaigns, or vendor changes over their lifetime.
Removing these scripts doesn’t just help INP — it also tends to improve LCP and overall page weight, making it one of the more broadly beneficial maintenance tasks available.
Defer Non-Critical JavaScript
Scripts that aren’t needed for the initial interaction should load with defer or async attributes so they don’t compete with critical interaction handlers for main thread time. This ensures the browser prioritizes parsing and executing the scripts that actually matter for the page’s core functionality first.
Non-critical scripts — things like social share widgets, secondary analytics tools, or below-the-fold interactive elements — can safely load later without the user noticing any difference in their initial experience.
Properly categorizing scripts into “critical” and “non-critical” buckets is a foundational step that makes all subsequent JavaScript optimization work significantly more effective.
Use Code Splitting
Instead of shipping one giant JavaScript bundle, split code so only what’s needed for the current page or interaction gets loaded and parsed. A single monolithic bundle forces every visitor to download and parse code for features they may never even use during their visit.
Modern build tools make code splitting relatively straightforward to implement, automatically breaking bundles apart based on routes, components, or dynamic import statements within the codebase.
This technique pays off especially well on larger, feature-rich sites and applications, where the gap between “total possible functionality” and “what a typical visitor actually uses” tends to be largest.
Optimize Third-Party Libraries
Heavy frameworks and libraries loaded just for one small widget are a common INP killer. It’s surprisingly common to see an entire large charting library loaded just to render one simple graph, or a full animation framework included just for a single fade-in effect.
Audit whether you actually need the full library or just a lightweight alternative, since many popular libraries have smaller, purpose-built alternatives that cover the specific functionality actually being used without the extra overhead.
This kind of audit often reveals that a significant portion of a site’s JavaScript weight comes from a small number of oversized dependencies rather than the site’s own custom code.
Improve Browser Rendering
Avoid forcing synchronous layout recalculations (called “layout thrashing”) by batching DOM reads and writes instead of interleaving them. Layout thrashing happens when code repeatedly alternates between reading layout properties and writing changes that affect layout, forcing the browser to recalculate positions over and over unnecessarily.
Batching all your reads together, then all your writes together, avoids this repeated recalculation cycle and can produce dramatic improvements in scripts that manipulate the DOM extensively.
This is a more advanced technique that typically requires careful code review and sometimes restructuring of how DOM manipulation logic is organized within an application.
Use Web Workers
Move heavy computational work off the main thread entirely using Web Workers, so it doesn’t block user interactions while it runs. Web Workers run in a separate thread from the main UI thread, meaning even genuinely expensive computation — parsing large datasets, complex calculations, image processing — doesn’t have to compete with the user’s ability to click and interact.
This is particularly valuable for data-heavy applications, dashboards, or tools that need to process meaningful amounts of information client-side without freezing the interface while doing so.
Implementing Web Workers does add architectural complexity, since data has to be passed between the main thread and the worker thread asynchronously, but for the right use cases the responsiveness payoff is substantial.
Optimize Framework Performance
If you’re using React, Vue, or similar frameworks, watch for excessive re-renders. Modern frameworks are powerful but can also make it easy to accidentally trigger far more rendering work than is actually necessary for a given state change.
Memoization and proper state management reduce unnecessary work triggered by every interaction, ensuring that a small state change doesn’t cascade into re-rendering large portions of the page that didn’t actually need to change.
Framework-specific profiling tools, like the React DevTools Profiler, can help pinpoint exactly which components are re-rendering unnecessarily, making targeted optimization far more efficient than guessing.
Cumulative Layout Shift (CLS) Explained
What Is CLS?
CLS measures unexpected movement of visible page content. Every time an element shifts position without user input causing it, that shift gets scored and added to a running total for the page. The word “unexpected” is key here — shifts that happen directly because of a user’s own action, like expanding an accordion they clicked, aren’t counted against CLS.
This distinction exists because the frustration CLS is meant to capture is specifically the surprise of content moving when the user wasn’t expecting it, not the natural, expected movement that comes from something the user themselves triggered.
Understanding this nuance helps avoid unnecessary anxiety over intentional, user-triggered layout changes, while keeping focus on the genuinely disruptive, unpredictable shifts that actually hurt the experience.
How CLS Is Calculated
CLS multiplies two factors: the impact fraction (how much of the viewport was affected by the shift) and the distance fraction (how far the elements moved relative to the viewport). This formula ensures that both the size of the shift and its magnitude matter — a tiny shift affecting a huge portion of the screen and a large shift affecting a small portion can both contribute meaningfully to the score.
These get summed across “session windows” of shifts that happen close together in time, and the largest window’s score becomes the page’s CLS. This “windowing” approach exists so that a series of small, related shifts happening in quick succession get evaluated together as a single event, rather than each one being scored in complete isolation.
The math behind CLS can feel abstract compared to time-based metrics like LCP and INP, but the practical takeaway is simple: bigger, more disruptive visual jumps produce a worse score than small, contained ones.
Good vs Needs Improvement vs Poor CLS Scores
0.1 or below is good. Between 0.1 and 0.25 needs improvement. Above 0.25 is poor, and users at that level are actively getting frustrated by content jumping around while they try to read or click.
Because CLS accumulates across the entire page lifecycle rather than measuring a single moment, even several small, individually minor shifts can add up into a poor overall score if they happen frequently enough throughout a page visit.
This makes CLS somewhat unique among the three vitals — fixing it often means addressing several smaller, scattered issues across a page rather than one single dominant culprit, unlike LCP which is often tied to one specific element.
Examples of Layout Shifts
An ad loading above an article paragraph and pushing it down mid-read. This is one of the most common and most disruptive CLS violations, because it happens exactly while the user is actively engaged in reading, making the interruption maximally jarring.
A web font swapping in and changing text width, shifting everything below it. Even a subtle difference in character width between a fallback font and the final custom font can cascade into noticeable shifts, especially across paragraphs of running text.
A “cookie consent” banner appearing after a delay and shoving the whole page down just as someone’s about to tap something. This particular example is so common and so disruptive that it has become something of a running joke in web development circles, precisely because it combines poor timing with poor layout planning.
Why Layout Stability Matters
Nothing kills trust in a website faster than clicking the wrong thing because content moved right as you tapped. This kind of misclick doesn’t just cause momentary annoyance — it can lead to genuinely costly mistakes, like tapping an ad instead of a product link, or accidentally navigating away from a page entirely.
It’s not just annoying — it actively causes mistakes, like accidentally clicking an ad instead of a “close” button. These aren’t hypothetical scenarios; they’re extremely common real-world occurrences on poorly built pages, and they directly damage both user trust and, often, advertiser relationships when accidental ad clicks inflate click-through metrics artificially.
Layout instability essentially breaks the fundamental contract of a webpage — that what you see is what you can reliably interact with — and once that trust is broken, users become noticeably more hesitant and cautious in their interactions going forward.
How CLS Impacts User Experience
Beyond misclicks, unstable layouts make reading genuinely uncomfortable. Your eyes lose their place, you re-read paragraphs, and the whole page starts feeling unreliable even if the content itself is great. This kind of friction accumulates subtly but steadily, wearing down a reader’s patience even if they can’t pinpoint exactly why the experience feels off.
The discomfort isn’t purely cosmetic either — repeated, unpredictable shifts genuinely disrupt the cognitive process of reading and comprehension, since the brain has to keep re-orienting itself to content that keeps moving.
Over time, sites with chronically poor CLS tend to develop a reputation, even if an unconscious one, among repeat visitors as being “annoying” or “unreliable” to use, which can quietly erode brand trust well beyond the immediate technical issue.
How to Improve Cumulative Layout Shift
Set Width and Height for Images
Always specify explicit width and height attributes (or aspect-ratio in CSS) on images so the browser reserves space before the image finishes loading. Without these dimensions, the browser has no way of knowing how much space to allocate for an image until it has actually finished downloading, which is exactly what causes the surrounding content to jump once it arrives.
This is one of the single most impactful and simplest fixes for CLS available, since it requires only a small markup change but prevents an entire category of shift from ever occurring in the first place.
Modern responsive image techniques, using aspect-ratio in CSS alongside flexible width settings, allow this space reservation to work correctly even across varying screen sizes and device orientations.
Reserve Space for Ads
Ad slots should have a fixed minimum height reserved in the layout from the start, even before the ad network delivers content, so nothing shifts when it loads. Since ad content is typically controlled by a third party and can vary in size, reserving a consistent container size upfront prevents that variability from translating into visible shifts.
This requires some coordination with your ad network’s typical unit sizes, ensuring your reserved space matches or reasonably accommodates the range of ad formats you’re likely to receive.
Publishers who rely heavily on ad revenue, like news sites and blogs, often find this to be one of their highest-priority CLS fixes, since ad-related shifts tend to be some of the largest and most frequent on ad-heavy pages.
Avoid Injecting Content Above Existing Content
Never insert new elements above content the user is already viewing unless it’s in direct response to user interaction. This is one of the most common CLS violations on news and blog sites, particularly when breaking news banners, notification bars, or promotional messages get inserted dynamically at the top of the page after initial load.
If new content genuinely needs to appear, consider alternatives like sliding it in below the fold, using a fixed-position overlay that doesn’t push content, or reserving space for it from the very start of the page load.
This principle is really about respecting the user’s current reading position — once they’ve started engaging with content at a certain point on the page, that content shouldn’t suddenly move out from under them.
Optimize Font Loading
Use font-display strategies and font metric overrides so fallback fonts closely match the dimensions of custom fonts, minimizing the shift when the real font swaps in. Even with font-display: swap solving the LCP-related invisible text problem, the swap itself can still cause a CLS issue if the fallback and final fonts have significantly different character widths.
Font metric override tools and CSS properties allow developers to adjust a fallback font’s sizing characteristics to closely approximate the final custom font, minimizing the visual jump that happens during the swap.
This is a more nuanced, advanced fix compared to the more obvious image-sizing fix, but it’s increasingly important on typography-heavy sites where large amounts of text are affected by font swaps.
Prevent Dynamic Layout Changes
Avoid animations that change layout properties like height, width, or position. Animating these properties forces the browser to recalculate layout on every single animation frame, which is both a performance drain and a direct source of visible content shifting.
Use transform and opacity instead, which don’t trigger layout recalculation. These properties can be animated efficiently by the browser’s compositor without touching the underlying page layout at all, achieving similar visual effects — sliding, fading, scaling — without the CLS penalty.
This is a foundational best practice in modern front-end animation work generally, valuable well beyond just its CLS benefits, since compositor-friendly animations also tend to run more smoothly overall.
Handle Embeds Correctly
Third-party embeds like YouTube videos or social media posts often load asynchronously and don’t reserve space upfront. These embeds are especially prone to causing shifts because their final dimensions are often controlled by external scripts loading on their own schedule, outside the direct control of your page’s code.
Wrap them in containers with fixed aspect ratios, ensuring the space is reserved from the moment the page renders, regardless of how long the actual embedded content takes to load.
This technique is essential for content-heavy sites that frequently embed social posts, videos, or interactive third-party widgets, since these embeds are otherwise a near-guaranteed source of noticeable layout shift.
Optimize Animations
Animations built on layout-affecting properties cause visible jank. Beyond CLS specifically, poorly built animations can also contribute to general perceived sluggishness, since the browser has to work harder to keep them smooth.
Stick to compositor-friendly properties that the browser can animate without recalculating the whole page layout, which keeps animations both visually smooth and free of layout-shift side effects.
Testing animations specifically for their CLS impact, not just their visual appeal, should be a standard part of any front-end review process on sites that use animation extensively.
Maintain Stable Responsive Layouts
Test your responsive breakpoints carefully — a common mistake is layouts that look fine at one width but shift awkwardly during the resize transition on tablets or foldable devices. Responsive design introduces its own category of layout shift risk, since content that reflows differently across breakpoints can create visible jumps during the transition itself.
This is particularly relevant with the growing popularity of foldable and multi-form-factor devices, where a page might need to gracefully handle a viewport that changes size dynamically during an active session, not just on initial load.
Thorough testing across a range of real devices and screen sizes, rather than just a couple of standard desktop and mobile breakpoints, helps catch these more subtle, situational CLS issues before they reach real users.
Understanding Core Web Vitals Scoring
Good Thresholds
As covered above: LCP ≤ 2.5s, INP ≤ 200ms, CLS ≤ 0.1. Hitting all three at the 75th percentile is what “passing” Core Web Vitals actually means. This combined requirement is important to understand — passing on two out of three metrics doesn’t count as an overall pass, since Google evaluates and reports each vital independently within its scoring system.
Reaching “Good” across all three simultaneously is a genuinely meaningful technical achievement, since improvements to one metric can sometimes create tension with another if not implemented carefully, such as aggressive lazy loading helping LCP budget but risking CLS if not sized correctly.
Treating “Good” as an ongoing target rather than a one-time achievement is important too, since new content, features, and third-party additions can quietly erode a passing score over time if left unmonitored.
Needs Improvement Thresholds
LCP between 2.5–4s, INP between 200–500ms, CLS between 0.1–0.25. Pages here aren’t failing outright, but they’re leaving real user experience on the table, and they represent the most common zone that mid-sized, moderately optimized sites tend to fall into.
This middle band is often where the most cost-effective optimization opportunities live, since pages here are usually not fundamentally broken — they just have a handful of specific, fixable issues holding them back from a full pass.
Prioritizing pages in this range, especially high-traffic ones, tends to offer a better return on optimization effort than either leaving well-performing pages alone or trying to rescue severely broken ones first.
Poor Thresholds
LCP above 4s, INP above 500ms, CLS above 0.25. These pages are actively delivering a bad experience and it’ll show up in your bounce and engagement metrics, often quite dramatically compared to pages in the other two bands.
Pages that fall into “Poor” across multiple metrics simultaneously usually share common root causes — bloated JavaScript, slow hosting, unoptimized images — meaning a focused round of fixes can often move several metrics out of the poor range together rather than requiring entirely separate remediation efforts for each one.
Given the severity of impact at this level, pages in the “Poor” bucket should generally be treated as the highest priority in any Core Web Vitals improvement project, since they represent the most acute pain points for both users and search visibility.
Field Data vs Lab Data
Field data comes from real users visiting your site in the wild, captured through Chrome. This data reflects the full messiness of real-world conditions — varying devices, network speeds, browser extensions, and usage patterns that no controlled test could fully replicate.
Lab data comes from simulated tests run in controlled conditions, like Lighthouse. This kind of testing offers consistency and repeatability, letting developers isolate the effect of a specific change without the noise introduced by real-world variability.
They can and often do disagree, sometimes significantly, and understanding why is important for interpreting your performance reports correctly rather than being confused or misled by seemingly conflicting numbers.
Origin-Level vs URL-Level Data
Origin-level data aggregates every page on your domain together. This broader view is useful for understanding overall site health but can mask significant variation between individual page templates or sections of a site.
URL-level data is specific to one exact page, offering much more precise insight but requiring sufficient individual traffic to that specific URL before Google can generate reliable data for it.
Search Console often shows origin-level data grouped by similar page types when individual URLs don’t have enough traffic for their own data, which is why product pages, blog posts, or category pages on the same platform often get bundled together into template-level groupings for reporting purposes.
75th Percentile Explained
Google evaluates the 75th percentile of page loads, not the average. This choice matters significantly, because an average can be skewed or hidden by a mix of very fast and very slow experiences, while the 75th percentile gives a much more honest picture of what the majority of real visits actually experienced.
This means 75% of your visits need to meet the threshold for the page to “pass” — a handful of slow outliers won’t tank your score, but a genuinely widespread issue will, ensuring the metric reflects systemic problems rather than rare edge cases.
Understanding this statistical approach helps explain why fixing performance for a small subset of unusually slow visits — say, users on an extremely poor network in a remote location — won’t meaningfully move your official score, while addressing issues affecting the bulk of your typical traffic will.
Why Scores Can Differ Between Tools
Different tools test from different locations, different device profiles, different network throttling settings, and sometimes different Chrome versions. Each of these variables can independently produce meaningfully different results, even when testing the exact same URL at nearly the same moment in time.
That’s why your PageSpeed Insights score and your GTmetrix score for the same URL can look wildly different — they’re not measuring under identical conditions, and comparing scores across different tools without accounting for these differences is a common source of confusion and misplaced concern.
The practical takeaway is to pick one or two primary tools for consistent tracking over time, rather than jumping between tools and treating every discrepancy as a sign something has gone wrong.
Lab Data vs Real User Data (Field Data)
What Is Lab Data?
Lab data is generated by running an automated test against your page in a controlled, simulated environment — fixed network speed, fixed device specs, no real user variability. This controlled nature is precisely what makes lab data so valuable for development work, since it isolates the effect of a specific code change without the noise of varying real-world conditions.
Lighthouse is the most common source of this, running a standardized battery of tests against a page and producing detailed, actionable scoring alongside specific recommendations for improvement.
Because lab tests run under fixed, predictable conditions, they’re ideal for quick before-and-after comparisons during active development work, giving near-instant feedback on whether a specific change actually helped.
What Is Field Data?
Field data comes from actual Chrome users visiting your page with their real devices, real networks, and real conditions — collected anonymously and aggregated into the Chrome User Experience Report. This is fundamentally different from lab data in that it reflects the genuine diversity of your actual audience, rather than a single simulated scenario.
Field data captures everything lab testing can’t — the visitor on an old Android phone over spotty 4G, the visitor on a top-of-the-line desktop over fiber, and everyone in between, all contributing to the aggregate picture Google uses for ranking purposes.
Because field data is what Google actually uses for its official Core Web Vitals assessment and reporting in Search Console, it should ultimately be treated as the source of truth for whether your optimization efforts are genuinely paying off for real visitors.
Advantages of Each
Lab data is reproducible and lets you debug specific issues in a controlled way, testing changes before and after immediately. This immediacy makes it indispensable during active development, where waiting weeks for field data to update would make iterative improvement painfully slow.
Field data reflects reality — what your actual users experience — but it’s slower to update and can’t isolate individual causes as easily, since it represents an aggregate of countless different sessions rather than one controlled test run.
The ideal approach uses both together — lab data for fast iteration during development, and field data for confirming that those iterations actually translated into real-world improvement once deployed.
When to Use Each
Use lab data during development and debugging, when you need instant feedback on a specific change. This is especially valuable when working through a long list of potential fixes, since it lets a developer quickly confirm each change is producing the expected direction of improvement before moving to the next one.
Use field data to understand what’s actually happening for real visitors and to know whether your site is passing Core Web Vitals in Google’s eyes, since this is ultimately the number that matters for both ranking purposes and genuine user experience validation.
A disciplined workflow treats lab data as a fast feedback loop during the build phase and field data as the final confirmation once changes have been live long enough to accumulate meaningful real-world traffic.
Common Misunderstandings
People often chase a perfect lab score and assume their field data will follow automatically. It doesn’t always work that way — real users have slower devices, worse networks, and browser extensions that lab tests don’t account for, meaning a perfect Lighthouse score is no guarantee of a perfect field data outcome.
This gap catches many developers off guard, especially those working primarily on fast development machines with excellent internet connections, since their personal testing conditions look nothing like a meaningful portion of their actual audience’s real-world conditions.
Recognizing this gap early prevents the frustrating experience of “fixing” a page according to lab data only to see little to no corresponding improvement show up in Search Console weeks later.
How Google Collects Core Web Vitals Data
Chrome User Experience Report (CrUX)
CrUX is Google’s public dataset of real-world performance data collected from opted-in Chrome users. It’s the backbone of field data shown in PageSpeed Insights and Search Console, essentially serving as the authoritative source that both tools pull from when displaying real-world metrics for a given URL or origin.
Being a public dataset also means developers, researchers, and SEOs can query CrUX data directly for their own analysis purposes, going beyond the standard reporting interfaces Google provides through its own tools.
Because CrUX aggregates data across an enormous volume of real Chrome usage globally, it represents one of the largest and most reliable sources of genuine, real-world web performance data available anywhere.
Chrome Browser Data
Chrome itself collects anonymous performance metrics from users who haven’t opted out, covering an enormous number of page visits across the web, which is what feeds into CrUX. This collection happens as a background function of the browser itself, rather than requiring any special code or tracking script to be installed on the website being measured.
This is part of why CrUX data exists even for sites that haven’t implemented their own performance monitoring — as long as enough real Chrome users are visiting a URL, Google has visibility into how that page actually performs for them.
The scale of this collection is genuinely massive, spanning billions of page visits across the web, which gives CrUX a level of statistical reliability that would be nearly impossible for any individual site to replicate on its own through self-collected data.
Real User Monitoring (RUM)
Beyond Google’s own data, many sites implement their own RUM scripts to collect Core Web Vitals directly from their visitors in real time, giving them faster and more granular feedback than waiting on CrUX’s 28-day rolling window. This self-implemented monitoring closes the gap between “when a change was deployed” and “when its real-world impact becomes visible.”
RUM tools can also capture more granular detail than CrUX’s public dataset provides, such as performance broken down by specific user segments, referral sources, or device categories relevant to a particular business.
Many third-party performance monitoring services build their offerings specifically around providing this kind of enhanced, real-time RUM data layered on top of or alongside what Google’s own CrUX dataset offers.
Privacy Considerations
CrUX data is anonymized and aggregated — it doesn’t tie performance data back to individual identifiable users, and participation is opt-in at the Chrome level. This design reflects a deliberate balance between collecting useful, large-scale performance data and respecting individual user privacy.
Because the data is aggregated rather than tied to specific individuals, developers and site owners get valuable insight into overall trends and patterns without ever having access to information that could identify or track a specific visitor.
This privacy-conscious design is part of why CrUX has become a broadly trusted and widely used dataset within the web development and SEO communities, without the ethical and legal complications that more invasive tracking approaches would raise.
Why New Websites May Not Have Enough Data
Google requires a minimum threshold of traffic and eligible page views before it publishes CrUX data for a URL or origin. This threshold exists to ensure the data reported is statistically meaningful, rather than based on a handful of visits that could easily be unrepresentative outliers.
Brand-new or low-traffic sites often show “insufficient data” in Search Console simply because not enough real Chrome users have visited yet, which can be a source of confusion for site owners expecting to see performance data immediately after launch.
In these cases, relying more heavily on lab data and self-implemented RUM tools becomes especially important, since Google’s own field data reporting simply won’t be available until organic traffic accumulates to a sufficient level over time.
How to Measure Core Web Vitals
Google PageSpeed Insights
Combines both lab data (via Lighthouse) and field data (via CrUX) for a given URL, giving you both a synthetic score and real-world numbers side by side. This dual presentation is genuinely useful, letting you compare how a page performs in a controlled test against how it’s actually performing for real visitors in one single report.
It’s typically the first stop for most developers and site owners checking Core Web Vitals, given its accessibility, ease of use, and direct connection to the same data sources Google uses for its own official assessments.
The recommendations section within PageSpeed Insights also provides specific, actionable guidance tailored to whatever issues are detected on the particular page being tested.
Google Search Console Core Web Vitals Report
Shows field data aggregated across your entire site, grouped by similar URLs, flagging which groups are “Good,” “Needs Improvement,” or “Poor” — this is the report Google actually uses to communicate ranking-relevant status. This report is particularly valuable for site owners managing larger sites, since it identifies patterns across page templates rather than requiring a page-by-page manual check.
Because it’s grouped by similar URL patterns, fixing a template-level issue — like a shared header component causing CLS — can often move an entire group of URLs from “Poor” to “Good” simultaneously once the fix is deployed.
Regularly checking this report should be a standard part of ongoing site maintenance, since it directly reflects the exact data source Google factors into its page experience evaluation.
Lighthouse
The auditing engine built into Chrome DevTools and available as a standalone tool, giving detailed lab-based performance scores along with specific, actionable recommendations. Lighthouse doesn’t just report scores — it explains, in plain language, exactly what’s contributing to a poor result and often links directly to relevant documentation for fixing it.
Because it’s built directly into Chrome DevTools, it’s immediately accessible to any developer without needing to install additional software or rely on an external web service.
Lighthouse can also be run programmatically as part of an automated testing or CI/CD pipeline, allowing performance regressions to be caught automatically before they ever reach production.
Chrome DevTools
The Performance panel lets you record and inspect exactly what’s happening during page load and interactions, down to individual JavaScript function calls and paint events. This level of granular detail makes it the go-to tool for genuinely deep debugging work, well beyond what summary scoring tools like Lighthouse or PageSpeed Insights can offer.
Recording a performance trace during a specific interaction, for example, can reveal exactly which function call is responsible for a long INP delay, down to the specific line of code involved.
This tool has a steeper learning curve than the more surface-level scoring tools, but for developers serious about performance work, it’s often indispensable for actually solving stubborn, hard-to-diagnose issues.
Chrome UX Report
A public BigQuery dataset and API that lets developers query raw CrUX data directly for deeper analysis than the standard reporting tools provide. This raw access opens up possibilities for custom analysis — comparing performance across competitor sites, tracking historical trends in greater detail, or building custom internal dashboards.
Because it requires some familiarity with SQL and BigQuery, this option tends to be used more by data-savvy developers and performance specialists rather than casual site owners just checking their own scores.
For agencies or teams managing performance across many client sites, this level of raw data access can be genuinely valuable for building standardized, comparative reporting systems.
Web Vitals Chrome Extension
A lightweight browser extension that shows live Core Web Vitals scores as you browse any site, useful for quick spot-checks without running a full audit. This kind of immediate, in-browser feedback is particularly handy during everyday browsing, letting a developer casually notice performance issues on their own site or competitors’ sites without deliberately running a formal test.
Because it runs live as you interact with a page, it can also give a real sense of INP performance specifically, since you’re generating genuine interactions rather than relying on a simulated test.
It’s a convenient, low-friction tool for building an intuitive sense of performance issues over time, complementing the more formal, detailed reporting tools rather than replacing them.
GTmetrix
A popular third-party tool offering detailed waterfall charts and historical tracking, useful for visualizing exactly what’s loading and when. The waterfall visualization in particular is excellent for understanding the sequential and parallel loading behavior of every single resource on a page.
Historical tracking features allow site owners to monitor performance trends over weeks or months, making it easier to spot gradual regressions before they become severe problems.
GTmetrix also offers testing from multiple global locations and device profiles, giving flexibility similar to some of the more specialized testing tools in this list.
DebugBear
A monitoring tool built specifically around Core Web Vitals tracking over time, with alerting when scores regress after a deployment. This proactive alerting capability is particularly valuable for teams that want to catch performance regressions immediately after a deploy, rather than discovering them weeks later through a routine check.
Because it’s purpose-built around ongoing Core Web Vitals monitoring rather than being a general-purpose speed testing tool, its reporting and alerting features tend to align very closely with exactly the metrics Google itself cares about.
This kind of continuous monitoring tool is especially valuable for larger teams or agencies managing performance across many pages or sites simultaneously.
WebPageTest
One of the most detailed testing tools available, letting you test from specific global locations, specific devices, and specific connection speeds, with a full filmstrip view of the page rendering process. This filmstrip feature, showing a frame-by-frame visual of exactly how the page rendered over time, is uniquely useful for spotting subtle rendering issues that summary scores alone wouldn’t reveal.
The ability to test from very specific real-world conditions — a particular city, a particular mobile device model, a throttled 3G connection — makes it especially valuable for diagnosing issues affecting specific audience segments.
Its depth of detail comes with a steeper learning curve compared to simpler tools, but for serious performance debugging, it remains one of the most powerful free options available.
Core Web Vitals Optimization Checklist
Optimize Images
Compress, resize, and serve next-gen formats for every image on the page — this alone fixes more Core Web Vitals problems than almost anything else on this list. Images tend to be the single largest contributor to page weight on most sites, which means they also tend to offer the largest single opportunity for improvement.
A systematic approach — compressing on upload, serving appropriately sized images for each device, and using modern formats like WebP — can be automated to ensure this fix stays in place permanently rather than requiring constant manual vigilance.
Given how consistently impactful image optimization is across virtually every type of site, it should generally be treated as the first item to check in any Core Web Vitals audit.
Improve Hosting
Cheap shared hosting with overloaded servers is a silent killer of every single Core Web Vital. Upgrade if your TTFB is consistently over 500ms, since server response time forms the foundation that every subsequent loading and rendering step builds upon.
Hosting quality is often underestimated as a performance factor because it’s less visible and less “hands-on” than front-end optimizations, but its impact can dwarf many other individual fixes combined.
Migrating to managed or higher-quality hosting is sometimes the single highest-leverage change available, particularly for sites currently running on budget shared hosting plans with heavy server contention.
Enable Browser Caching
Set proper cache headers so returning visitors aren’t re-downloading assets they already have stored locally. This creates a compounding benefit over time, since every repeat visitor experiences meaningfully faster load times once their browser has cached your site’s static assets.
Getting cache headers configured correctly requires some care, balancing long cache durations for rarely-changing assets against appropriate cache-busting mechanisms for content that updates more frequently.
Most modern hosting platforms and CDNs offer straightforward configuration options for this, making it a relatively accessible fix even for site owners without deep technical expertise.
Use a CDN
Distribute static assets geographically to cut latency for visitors far from your origin server. As covered earlier, this is one of the more foundational and broadly beneficial infrastructure changes a site can make, particularly for sites serving a geographically diverse audience.
Modern CDN services have made setup dramatically easier than in years past, often requiring little more than updating DNS records or installing a plugin integration.
Combined with proper caching configuration, a CDN can dramatically reduce both initial load times for new visitors and repeat load times for returning ones.
Reduce CSS
Remove unused stylesheets and rules, and split critical from non-critical CSS. Much like unused JavaScript, unused CSS accumulates over time as designs evolve, themes change, and features get added and removed without a full cleanup of the associated styling code.
Tools that analyze actual CSS usage across a live site’s pages can help identify exactly which rules are genuinely being applied versus which ones are dead weight left over from previous iterations of the design.
Splitting critical, above-the-fold CSS from the rest, as discussed in the LCP section, remains one of the most effective CSS-related optimizations available for improving initial render speed.
Optimize JavaScript
Minify, defer, split, and audit third-party scripts regularly — this is an ongoing task, not a one-time fix. JavaScript tends to be the most frequently changing part of a site’s codebase, which means performance issues here can creep back in relatively quickly even after an initial cleanup.
Building JavaScript performance checks into a regular maintenance cadence, rather than treating it as a single project to complete and forget, helps keep scores stable over the long term.
Given how directly JavaScript execution ties into both LCP and INP specifically, this category of optimization tends to offer some of the broadest cross-metric benefits available.
Compress Files
Enable Brotli or Gzip compression on your server for text-based assets like HTML, CSS, and JavaScript. This server-level compression can dramatically reduce the size of text-based files in transit, often by 70% or more, without requiring any changes to the actual content of those files.
Brotli generally offers better compression ratios than Gzip for most text content, though both are widely supported and represent a significant improvement over serving uncompressed files.
This is typically a one-time server configuration change rather than an ongoing task, making it one of the more “set it and forget it” items on this checklist.
Eliminate Render-Blocking Resources
Move non-critical CSS and JS out of the render path so the browser can paint content sooner. Every resource that blocks initial rendering adds directly to the delay before a user sees anything meaningful on the page.
Identifying which specific resources are currently render-blocking, using tools like Lighthouse’s diagnostics, is the necessary first step before deciding how to defer or restructure their loading.
This optimization category often overlaps significantly with the specific LCP-focused techniques covered earlier, since render-blocking resources are one of the most direct contributors to a delayed LCP.
Remove Unused Plugins
Especially relevant for CMS platforms — every inactive or bloated plugin adds unnecessary weight even if it’s rarely used. Even plugins that appear “deactivated” can sometimes still leave residual scripts, database entries, or scheduled tasks running in the background.
A thorough plugin audit, removing anything not actively contributing clear value, is a task worth revisiting periodically as a site’s plugin ecosystem naturally grows and changes over time.
This is particularly important on platforms like WordPress, where plugin proliferation is an extremely common and well-documented source of performance degradation.
Improve Mobile Performance
Test everything on actual mid-range mobile devices and throttled connections, not just your development machine on fiber internet. Development environments are almost always dramatically faster than the real-world conditions a meaningful portion of actual visitors experience.
Since Google evaluates mobile performance particularly closely given mobile-first indexing, ensuring genuinely representative mobile testing is arguably more important than desktop testing for most sites today.
Using device emulation and network throttling tools built into Chrome DevTools is a reasonable starting point, but testing on actual physical mid-range devices remains the gold standard for catching real-world mobile performance issues.
Core Web Vitals for WordPress
Common WordPress Performance Problems
Bloated themes with unused features, plugin overload, unoptimized database queries from years of accumulated post revisions, and render-blocking scripts injected by page builders are the recurring offenders. WordPress’s flexibility and massive plugin ecosystem are simultaneously its greatest strength and its most common performance liability.
Page builder plugins in particular, while convenient for design flexibility, often inject significantly more CSS and JavaScript than a hand-coded theme would, which can quietly undermine Core Web Vitals scores even on otherwise well-built sites.
Because WordPress sites are so often built and extended incrementally by multiple people over time, performance issues tend to accumulate gradually rather than appearing all at once, making periodic audits especially important on this platform.
Best Caching Plugins
Plugins like WP Rocket, W3 Total Cache, and WP Super Cache handle page caching, minification, and lazy loading in one place, drastically reducing server load and improving LCP. These tools essentially bundle together several of the individual optimization techniques covered earlier into a single, more accessible package suited to the WordPress ecosystem.
Page caching in particular can produce dramatic improvements, since it allows the server to serve a pre-rendered version of a page instead of rebuilding it from scratch — querying the database, running PHP logic — on every single visit.
Choosing the right caching plugin, and configuring it correctly for a specific site’s needs, matters more than simply installing the most popular option, since misconfigured caching can sometimes cause its own issues with dynamic content.
Image Optimization Plugins
Tools like ShortPixel or Imagify automatically compress and convert uploaded images to next-gen formats without manual work every time you upload media. This automation is particularly valuable on content-heavy WordPress sites where images are uploaded frequently by multiple contributors who may not think about optimization themselves.
These plugins typically also offer bulk optimization features for existing media libraries, allowing a site to retroactively clean up years of previously unoptimized image uploads in one pass.
Combined with next-gen format conversion, these tools directly address one of the most consistently impactful LCP-related fixes available on any WordPress site.
Lazy Loading
Most modern WordPress versions have native lazy loading built in, but plugins can extend it to background images and iframes that core WordPress doesn’t handle automatically. WordPress core added native lazy loading support several years back, which means many sites already benefit from at least a baseline level of this optimization without any additional configuration.
However, native support doesn’t cover every possible case, particularly CSS background images and embedded iframes, which is where dedicated lazy loading plugins or manual implementation can fill the remaining gaps.
As always, care needs to be taken to exclude the LCP element itself from lazy loading, regardless of whether native or plugin-based lazy loading is being used.
Database Optimization
Years of post revisions, spam comments, and transient options bloat the database over time. Regular cleanup keeps queries fast, which directly helps server response time. WordPress’s database can grow substantially larger than necessary if left unmaintained, particularly on sites with a long publishing history and heavy editing activity.
Database cleanup plugins can automate the removal of old revisions, expired transients, and spam comment data, though periodic manual review is also worthwhile for sites with particularly complex or heavily customized database structures.
A leaner, well-optimized database directly translates into faster query execution, which flows through to improved TTFB and, consequently, improved LCP.
Theme Optimization
Heavy multipurpose themes packed with unused features slow everything down. Lightweight, purpose-built themes consistently outperform bloated ones on Core Web Vitals. Multipurpose themes are popular because of their flexibility, but that flexibility often comes at the cost of shipping code and features for dozens of use cases a given site will never actually use.
Switching to a more focused, lightweight theme — or stripping down an existing theme’s unused features — can produce noticeable improvements across all three Core Web Vitals simultaneously.
This is a more involved change than a simple plugin installation, but for sites with severe theme-related bloat, it can be one of the most impactful single changes available.
Plugin Cleanup
Every additional plugin adds its own scripts and stylesheets. Regularly audit and remove ones that aren’t actively needed. This applies not just to obviously unused plugins but also to plugins providing overlapping functionality, where consolidating to a single, well-built solution can reduce overall overhead.
A useful practice is periodically reviewing the full plugin list and asking, for each one, whether it’s still actively delivering value proportional to its performance cost — a question that’s easy to skip but valuable to revisit regularly.
Plugin cleanup pairs particularly well with database optimization, since removing a plugin doesn’t always fully remove its associated database entries without some additional cleanup effort.
CDN Integration
Plugins like Cloudflare’s WordPress integration make CDN setup straightforward without touching DNS manually. This kind of integrated, plugin-based setup significantly lowers the technical barrier to adopting a CDN, making it accessible even to site owners without deep infrastructure experience.
Beyond just serving static assets faster, many of these integrations also offer additional performance and security features bundled together, adding further value beyond the core CDN functionality.
Given how broadly beneficial CDN adoption tends to be across LCP and general loading performance, this is generally one of the higher-priority WordPress-specific optimizations to implement early in an optimization project.
Hosting Recommendations
Managed WordPress hosting providers with server-level caching and optimized configurations for WordPress specifically tend to outperform generic shared hosting by a wide margin. These specialized hosting environments are built with WordPress’s particular architecture and common bottlenecks in mind, rather than being generic hosting environments retrofitted to run any type of site.
Server-level caching, in particular, tends to be more robust and reliable than plugin-based caching alone, since it operates closer to the infrastructure layer rather than within the WordPress application itself.
For sites experiencing persistent performance issues despite plugin-level optimization efforts, a hosting upgrade or migration is often the change that finally moves the needle significantly.
Core Web Vitals for Different Website Types
Blogs
Focus heavily on image optimization and font loading since blogs are typically text-and-image heavy with minimal interactivity — LCP and CLS matter most here. Because blogs are primarily about reading, layout stability during that reading experience is especially critical to get right.
INP still matters for blogs with comment sections, search functionality, or interactive elements, but it’s typically a lower relative priority compared to ensuring images and text render quickly and stay put once they do.
Given blogs’ heavy reliance on featured images and embedded media, applying the image and font optimization techniques covered earlier tends to produce outsized benefits specifically for this type of site.
eCommerce Websites
Product pages with multiple images, reviews widgets, and add-to-cart interactions need attention across all three metrics, with INP being especially critical during checkout flows. Unlike simpler content sites, eCommerce platforms tend to be genuinely demanding across the full spectrum of Core Web Vitals due to their combination of rich media and heavy interactivity.
The checkout flow deserves particular attention, since any friction or lag during this specific sequence directly threatens conversion and revenue in a way that’s easy to measure and easy to justify prioritizing.
Given how directly performance has been shown to correlate with conversion rate in eCommerce specifically, Core Web Vitals optimization on these sites often has a clearer, more immediately measurable business case than on other site types.
SaaS Platforms
Heavy JavaScript applications with complex dashboards need serious INP attention, since these are highly interactive interfaces where every click needs to feel instant. SaaS products are often used repeatedly by the same users throughout their workday, meaning even small responsiveness issues compound into significant cumulative frustration over time.
Because these platforms are typically single-page applications with extensive client-side logic, they’re particularly susceptible to the kind of main-thread congestion issues that specifically damage INP scores.
Given the highly interactive nature of these interfaces, investing heavily in the JavaScript optimization and Web Worker techniques covered earlier tends to be especially worthwhile for this category of site.
Local Business Websites
Usually simpler sites, but often built on templated platforms with unnecessary bloat. Stripping down to essentials usually solves most issues quickly. These sites frequently suffer less from genuinely complex technical problems and more from generic template bloat that was never tailored to the specific site’s actual needs.
Because local business sites typically have simpler content and interaction requirements than eCommerce or SaaS platforms, achieving good Core Web Vitals scores is often more straightforward and requires less specialized technical expertise.
A relatively modest investment in cleanup — removing unused template features, optimizing a handful of key images, upgrading basic hosting — often produces disproportionately large improvements for this category of site.
News Websites
High ad density makes CLS the biggest challenge here — reserving space for every ad unit is non-negotiable for news publishers. News sites face a particularly acute version of the CLS challenge given their reliance on advertising revenue and the sheer volume of ad units typically present across a single page.
Because news content is often read quickly and repeatedly throughout the day by returning visitors, layout stability directly affects reader trust and willingness to return for future visits.
Balancing advertising revenue needs against genuine layout stability is an ongoing challenge specific to this category, requiring close collaboration between technical and advertising operations teams.
Portfolio Websites
Often image and video heavy with custom animations, meaning LCP and careful animation choices (avoiding layout-triggering properties) matter most. Portfolio sites are frequently built to showcase visually striking work, which creates an inherent tension between rich visual presentation and lean, fast-loading performance.
The techniques around compositor-friendly animation properties covered in the CLS section are particularly relevant here, given how central custom animation and visual flourish tend to be to this type of site’s design goals.
Careful, deliberate image optimization becomes especially important on portfolio sites, since the visual quality of showcased work is central to the site’s purpose, making a blanket approach to compression less appropriate than a more curated, quality-conscious optimization strategy.
Enterprise Websites
Large, complex sites with many stakeholders and third-party integrations tend to accumulate script bloat over time — ongoing governance and script audits are essential. The organizational complexity behind enterprise sites often means performance issues arise not from any single bad decision but from the cumulative effect of many different teams adding their own tools and integrations independently over time.
Establishing clear internal governance processes — requiring performance review before new third-party scripts are added, for example — can prevent much of this bloat from accumulating in the first place rather than requiring periodic cleanup after the fact.
Given the scale and complexity typically involved, enterprise Core Web Vitals work often benefits significantly from dedicated performance budgets and automated monitoring, both covered in more detail later in this guide.
Best Tools for Core Web Vitals Optimization
Google PageSpeed Insights
Free, combines lab and field data, and gives specific actionable recommendations tied directly to Google’s own scoring criteria. Because it’s directly maintained by Google and pulls from the same data sources used for official ranking evaluation, it remains one of the most authoritative and trustworthy tools available for this purpose.
Its accessibility — free, web-based, no installation required — makes it a natural starting point for site owners and developers at any level of technical expertise.
Regularly checking this tool as part of an ongoing maintenance routine helps catch both regressions and opportunities for further improvement over time.
Lighthouse
Available in Chrome DevTools and as a CLI tool, great for detailed lab audits during development. Its dual availability — built into the browser for casual checks, and available as a command-line tool for automated integration — makes it flexible enough to fit into nearly any development workflow.
The CLI version in particular is valuable for teams wanting to integrate performance checks directly into their continuous integration pipelines, catching issues automatically before they reach production.
Given its depth of actionable recommendations alongside its scoring, Lighthouse often serves as the primary diagnostic tool developers reach for once an issue has been identified through broader monitoring.
Chrome DevTools
Essential for deep debugging — the Performance and Network panels let you see exactly what’s slowing things down frame by frame. This tool is less about generating a summary score and more about genuinely understanding, at a granular level, exactly what’s happening during a page load or interaction.
For stubborn performance issues that resist simpler fixes, dropping into DevTools for a detailed performance trace is often the only way to truly pinpoint the specific root cause.
Investing time in genuinely learning this tool’s capabilities pays dividends for anyone doing serious, ongoing performance optimization work, well beyond what surface-level scoring tools alone can offer.
GTmetrix
Good for waterfall visualization and historical performance tracking over time. Its waterfall charts provide an intuitive, visual way to understand exactly how and when each resource on a page loads relative to every other resource.
Historical tracking capabilities make it easy to spot gradual performance regressions that might otherwise go unnoticed until they’ve become significant problems.
It strikes a reasonable balance between depth of detail and ease of use, making it accessible to a broader range of users than some of the more advanced, technically demanding tools in this list.
DebugBear
Purpose-built for ongoing Core Web Vitals monitoring with alerting on regressions. Its focus specifically on Core Web Vitals, rather than being a general-purpose speed testing tool, means its features and reporting align very closely with exactly what matters most for this particular aspect of performance.
The alerting functionality is particularly valuable for catching issues immediately after a deployment, rather than discovering them much later through periodic manual checks.
For teams managing performance across multiple sites or pages at scale, this kind of dedicated monitoring tool tends to offer significant efficiency advantages over manual, ad-hoc checking.
WebPageTest
The most granular option, letting you test from specific locations and connection types with detailed filmstrips. Its combination of geographic testing flexibility and detailed visual rendering timelines makes it uniquely suited for diagnosing issues affecting specific audience segments.
Because it’s free and offers this level of depth, it remains a favorite among performance specialists despite its somewhat steeper learning curve compared to more streamlined tools.
For particularly stubborn or geographically-specific performance issues, WebPageTest’s detailed testing options often reveal insights that simpler, more generalized tools might miss entirely.
Cloudflare
CDN and edge caching platform that also offers built-in performance optimization features like automatic minification and image optimization. Beyond its core CDN functionality, Cloudflare bundles in a range of additional performance features that can be enabled with minimal configuration effort.
Its broad adoption and relatively simple setup process have made it one of the more accessible ways for site owners to gain CDN and edge caching benefits without needing deep infrastructure expertise.
Combined with its security features, Cloudflare often serves a dual purpose for site owners, addressing both performance and protection concerns through a single platform.
NitroPack
An all-in-one performance optimization service popular with WordPress and Shopify sites, handling caching, image optimization, and code minification together. Its all-in-one approach appeals particularly to site owners who want comprehensive optimization without needing to individually configure and manage several separate tools.
This kind of bundled service trades some granular control for convenience, which can be a reasonable tradeoff for smaller sites or teams without dedicated performance engineering resources.
Given its popularity specifically within the WordPress and Shopify ecosystems, it’s worth evaluating alongside the more platform-specific plugin options covered earlier in the WordPress section.
WP Rocket
A premium WordPress caching plugin known for being relatively easy to configure compared to some of its free alternatives. Its reputation for ease of use has made it a popular choice among WordPress site owners who want strong caching and optimization results without needing deep technical configuration knowledge.
Beyond basic page caching, it typically bundles in additional features like lazy loading, minification, and database cleanup, covering several of the WordPress-specific optimizations discussed earlier in a single package.
Its premium, paid nature is often justified by the time saved compared to configuring several separate free plugins to achieve similar results.
Perfmatters
A lightweight WordPress performance plugin focused on disabling unnecessary scripts and features rather than adding new caching layers. Its philosophy differs somewhat from caching-focused plugins, concentrating instead on trimming away unnecessary WordPress core features and scripts that many sites don’t actually need.
This makes it a natural complement to a dedicated caching plugin rather than a direct competitor, since the two tools address somewhat different categories of performance improvement.
Its lightweight nature and specific focus make it a good fit for site owners who already have caching handled and are looking for additional, more surgical performance gains.
Monitoring Core Web Vitals Over Time
Set Performance Benchmarks
Establish clear internal targets for each metric before you start optimizing, so you know what “success” actually looks like for your specific site. Without clear benchmarks established upfront, it becomes difficult to know whether ongoing optimization efforts are actually succeeding or simply generating activity without meaningful progress.
Benchmarks should ideally go beyond just Google’s official “Good” thresholds, potentially including more ambitious internal targets if your site’s specific business goals or audience expectations warrant a higher bar.
Revisiting and adjusting these benchmarks periodically, as the site evolves and as industry standards shift, keeps the target genuinely relevant rather than becoming a stale, outdated reference point.
Monitor Search Console Reports
Check the Core Web Vitals report regularly, since it reflects real field data and shows trends over rolling time windows. Because this report uses the exact same data source Google factors into its ranking evaluation, it should be treated as one of the more authoritative ongoing checkpoints in any monitoring routine.
Given the rolling 28-day nature of this data, changes won’t show up immediately, which means patience and consistent, regular checking — rather than obsessive daily monitoring — is the more appropriate cadence for this particular tool.
Setting a recurring calendar reminder to review this report, rather than relying on remembering to check it, helps ensure it doesn’t get overlooked amid other day-to-day priorities.
Track Real User Metrics
Implement your own RUM tracking if you have enough traffic, since it gives faster feedback than waiting on Google’s reporting cycle. For sites with significant traffic volume, this faster feedback loop can be genuinely valuable for catching and diagnosing issues well before they’d otherwise surface in Search Console’s slower reporting cycle.
RUM implementation does require some technical setup, typically involving a small tracking script and a system for collecting and analyzing the resulting data, but numerous third-party services exist to simplify this process considerably.
Combining self-implemented RUM with Google’s own CrUX-based reporting provides both the speed of real-time feedback and the authority of the official data source Google actually uses for ranking purposes.
Schedule Regular Performance Audits
Set a recurring cadence — monthly or quarterly depending on how often your site changes — to catch regressions before they become serious problems. Performance tends to degrade gradually rather than suddenly, which means infrequent, ad-hoc checking often misses the slow accumulation of small issues until they’ve compounded into a genuinely significant problem.
The right cadence depends heavily on how frequently a given site changes — a rapidly evolving eCommerce platform with frequent feature releases likely needs more frequent checking than a relatively static portfolio site that rarely changes.
Treating these audits as a non-negotiable, scheduled activity, rather than something done only when a problem is already suspected, is key to genuinely staying ahead of performance regressions rather than constantly playing catch-up.
Test After Every Major Website Update
New themes, plugins, redesigns, or ad placements should always get a performance check before and after deployment. This kind of targeted, change-specific testing is far more efficient than waiting for a scheduled audit to catch an issue that a specific recent change actually introduced.
Building this check into a standard deployment or release checklist ensures it happens consistently, rather than depending on any individual team member remembering to do it manually each time.
Catching a regression immediately after it’s introduced, while the specific change is still fresh and easy to identify, is dramatically easier than trying to diagnose a mysterious performance drop weeks later after several other changes have also been made.
Create a Continuous Optimization Process
Treat performance as an ongoing discipline built into your development workflow, not a one-time project you finish and forget about. This mindset shift — from “performance project” to “performance culture” — is ultimately what separates sites that maintain good Core Web Vitals scores long-term from those that pass an initial audit only to quietly regress over subsequent months.
Embedding performance considerations into everyday decisions — evaluating a new plugin’s performance cost before installing it, for example, rather than only after — prevents many issues from ever being introduced in the first place.
Ultimately, the sites that sustain strong Core Web Vitals scores over years, not just at a single point in time, are the ones that have built this kind of ongoing discipline directly into how their teams work, rather than treating it as a separate, occasional initiative.
Core Web Vitals Case Study
Website Background: A mid-sized eCommerce store selling home goods, built on WooCommerce, receiving around 40,000 monthly organic visits, mostly on mobile. This kind of profile — a mid-traffic WooCommerce store with a mobile-dominant audience — represents an extremely common real-world scenario across countless small-to-medium eCommerce businesses, making the lessons from this particular case broadly applicable well beyond this single example.
Initial Performance Audit: LCP sat at 4.8 seconds on mobile, INP averaged 340ms, and CLS was 0.32 — all three in “Poor” territory according to Search Console. Starting from a position where all three metrics simultaneously fell into the “Poor” bucket is unfortunately common for sites that have grown organically over time without dedicated performance attention along the way.
Problems Identified: Uncompressed product images averaging 2MB each, six different marketing plugins each adding their own scripts, a slider plugin injecting layout-shifting content above the fold, and shared hosting with a 900ms average server response time. This combination of issues — heavy images, script bloat, layout-shifting content, and slow hosting — represents a fairly textbook set of problems commonly found across underperforming eCommerce sites of this general type and size.
Optimization Strategy: Migrated to managed WordPress hosting, compressed and converted all product images to WebP, removed three redundant marketing plugins, replaced the slider with a static hero banner with reserved dimensions, and implemented lazy loading for below-fold images. Notably, this strategy didn’t involve any exotic or advanced techniques — every single change here maps directly back to fundamentals covered earlier in this guide, applied consistently and thoroughly.
Before vs After Metrics
| Metric | Before | After |
|---|---|---|
| LCP | 4.8s | 2.1s |
| INP | 340ms | 180ms |
| CLS | 0.32 | 0.06 |
| Server response time | 900ms | 220ms |
These results moved all three Core Web Vitals from solidly “Poor” territory into solidly “Good” territory, a genuinely significant transformation achieved through a relatively focused set of changes rather than a sprawling, months-long overhaul.
SEO Results: Within about ten weeks, organic traffic to key product pages increased roughly 18%, and average position for several competitive product terms moved up two to four spots. While it’s difficult to attribute ranking movement to Core Web Vitals alone with complete certainty, the timing and magnitude of this improvement, combined with the dramatic performance gains, strongly suggest a meaningful connection.
User Experience Improvements: Cart abandonment on mobile dropped noticeably, and session duration on product pages increased since users weren’t fighting layout shifts while browsing. These behavioral improvements reinforce the broader point that Core Web Vitals gains tend to show up in real business metrics, not just in abstract technical scores.
Key Lessons Learned: Most of the gain came from just three changes — better hosting, image compression, and removing unnecessary plugins. Nothing exotic was needed. The basics, done properly, moved the numbers more than any advanced technique would have. This is perhaps the single most important takeaway from the entire case study — meaningful Core Web Vitals improvement rarely requires cutting-edge techniques, and instead usually comes down to consistently and thoroughly applying well-established fundamentals.
Core Web Vitals Mistakes to Avoid
Focusing Only on Desktop Scores
Most traffic today is mobile, and mobile devices have weaker processors and often slower connections. Desktop scores can look great while mobile scores are genuinely poor, creating a false sense of confidence for site owners who only check performance from their own desktop development machines.
Given that Google’s mobile-first indexing means mobile performance carries particular weight in ranking evaluation, neglecting mobile-specific testing represents a genuinely risky blind spot rather than a minor oversight.
Making mobile testing the default, rather than an occasional afterthought alongside primary desktop testing, better reflects the reality of how most visitors actually experience a given site.
Ignoring Mobile Performance
Beyond just checking mobile scores, actually test on real mid-range Android devices, not just an iPhone on wifi in an office. Even mobile-specific testing can be misleading if it’s done exclusively on high-end devices with strong network connections, since a meaningful portion of real mobile users are on considerably less capable hardware and networks.
Mid-range Android devices, in particular, tend to have significantly less processing power than premium devices, making them a much more realistic stress test for JavaScript-heavy interactions and INP performance specifically.
Investing in a small collection of representative test devices, or using device emulation tools configured to genuinely reflect mid-range specifications, helps close this common testing gap.
Installing Too Many Optimization Plugins
Stacking five different caching and optimization plugins on top of each other often causes conflicts that make things worse, not better. This is a genuinely counterintuitive trap — the instinct to solve a performance problem by adding more optimization tools can sometimes backfire when those tools overlap or actively conflict with one another.
Multiple caching plugins in particular are notorious for causing conflicts, since each one may be trying to manage the same underlying caching mechanisms in incompatible ways.
The better approach is typically choosing one well-configured, comprehensive solution rather than layering multiple partial solutions on top of each other in the hope that more tools automatically means more improvement.
Optimizing Only the Homepage
Search Console groups similar page templates together, so a slow product page template affects every product page, not just one. Optimize at the template level. Homepage-only optimization is a common trap, since the homepage is often the page site owners look at most themselves, even though it may represent a small fraction of overall traffic compared to product, category, or article pages.
Because Google’s reporting groups similar URL patterns together, fixing an issue in a shared template — a product page layout, for instance — can improve dozens or hundreds of individual pages simultaneously, offering a much better return on effort than page-by-page fixes.
Identifying which templates drive the most traffic and prioritizing optimization work at that template level, rather than the individual page level, tends to be a far more efficient overall strategy.
Ignoring Third-Party Scripts
Analytics, ads, chat widgets, and tracking pixels are frequently the biggest contributors to poor INP and nobody audits them regularly. This category of oversight is especially common because these scripts are often added by different teams — marketing, analytics, customer support — rather than the development team responsible for overall site performance.
Because responsibility for these scripts is often distributed across multiple teams, no single person may feel ownership over auditing and maintaining them, which is exactly why they tend to accumulate unchecked over time.
Establishing a clear, cross-functional process for reviewing and approving new third-party scripts before they’re added can help prevent this particular blind spot from developing in the first place.
Overusing Lazy Loading
Lazy loading your actual LCP element (like the hero image) delays it rather than speeding things up — it should never be applied to above-the-fold content. This is a subtle but genuinely damaging mistake, since lazy loading is broadly recommended as a best practice, leading some developers to apply it indiscriminately across every image on a page without exception.
Applying lazy loading to the very element Google is measuring for LCP directly works against the goal of a fast LCP score, since it deliberately delays the loading of exactly the content that needs to appear as quickly as possible.
The correct approach is selective — lazy load everything below the fold, but ensure above-the-fold and LCP-candidate content loads eagerly and, ideally, is even preloaded rather than delayed.
Chasing Perfect 100 Scores
A perfect Lighthouse score isn’t the goal — genuinely good user experience is. Diminishing returns kick in hard once you’re already in “Good” territory across the board. Pursuing a perfect score can become a counterproductive distraction, consuming disproportionate time and effort for marginal gains once the meaningful thresholds have already been comfortably cleared.
This chase can also lead to genuinely questionable tradeoffs, like stripping out useful functionality purely to shave a few more points off a synthetic score, even when that functionality provides real value to users.
A more balanced approach treats “Good” thresholds as the genuine target, redirecting effort beyond that point toward other priorities — content quality, functionality, business goals — rather than continuing to chase diminishing performance returns.
Neglecting Ongoing Monitoring
Performance isn’t a one-time fix. New plugins, new content, new ads all creep back in over time and quietly erode scores if nobody’s watching. This tendency for performance to regress gradually, almost invisibly, is exactly why the “set it and forget it” mentality is so risky when it comes to Core Web Vitals.
A site that passed all three Core Web Vitals thresholds six months ago can easily have slipped back into “Needs Improvement” or even “Poor” territory without anyone noticing, simply through the normal accumulation of new content and features over time.
Building ongoing monitoring — whether through Search Console checks, RUM tools, or scheduled audits — into standard operating procedure is the only reliable way to ensure hard-won performance gains actually stick over the long term.
Core Web Vitals and SEO
Are Core Web Vitals a Ranking Factor?
Yes, officially confirmed by Google, but as one of many hundreds of ranking signals, and a relatively small one at that. This official confirmation removes any ambiguity about whether these metrics matter at all for search visibility, even as the relative weight compared to other factors remains modest.
Understanding this factual status — confirmed but minor — helps calibrate expectations appropriately, avoiding both the mistake of dismissing Core Web Vitals entirely and the opposite mistake of treating them as a guaranteed ranking silver bullet.
The practical implication is that Core Web Vitals optimization should be pursued as part of a broader, holistic SEO and user experience strategy, rather than as an isolated initiative expected to single-handedly transform rankings.
How Important Are They Compared to Content?
Content relevance and quality still dominate. A page with weak content won’t outrank a strong competitor just because it loads faster — Core Web Vitals mostly matter as a tiebreaker among similarly relevant, similarly authoritative pages. This hierarchy of importance should shape resource allocation decisions, ensuring content quality investment isn’t shortchanged in favor of purely technical performance work.
For sites already producing genuinely strong, relevant content, Core Web Vitals optimization can serve as a valuable complementary investment, helping ensure that strong content actually gets the ranking credit it deserves rather than being held back by technical shortcomings.
Conversely, for sites struggling primarily with content quality or relevance issues, Core Web Vitals optimization alone is unlikely to meaningfully move rankings, since it doesn’t address the more fundamental underlying problem.
Impact on Crawl Budget
Faster server response times mean Googlebot can crawl more pages within the same crawl budget, which matters more for large sites with thousands of URLs than for small ones. This crawl budget consideration is somewhat distinct from the direct user-experience-focused ranking signal, representing a separate, more technical angle on why server response time specifically matters for SEO.
For very large sites — extensive eCommerce catalogs, large publishers with vast content archives — ensuring efficient crawling within a finite budget can directly affect how quickly new or updated content gets indexed and becomes eligible to rank.
Smaller sites with a limited number of total pages are less likely to be meaningfully constrained by crawl budget considerations, making this particular benefit more relevant to larger, more complex sites specifically.
Influence on Bounce Rate
Slow, janky pages drive people away before they engage, and that behavioral signal feeds into how Google evaluates overall page quality over time. While Google has been cautious about confirming exactly how directly behavioral signals like bounce rate factor into ranking algorithms, the broader relationship between poor performance and poor engagement is well-established through both logic and industry research.
Even setting aside any direct ranking impact, high bounce rates driven by poor performance represent a genuine business cost, since visitors who leave immediately never get the chance to convert, engage, or return.
Addressing Core Web Vitals issues, in this light, serves the dual purpose of potentially supporting rankings while also directly protecting and improving core business engagement metrics regardless of the ranking connection specifically.
Impact on Conversion Rate
Studies across eCommerce and SaaS sites consistently show that improving load times and responsiveness increases conversion rates — sometimes dramatically, especially on mobile. This connection between performance and conversion has been documented extensively across the industry, with numerous case studies from major companies quantifying exactly how much revenue impact even small performance improvements can produce.
Mobile users in particular tend to show heightened sensitivity to performance issues, given the often more constrained processing power, network conditions, and attention spans typical of mobile browsing sessions.
This conversion rate connection often provides the clearest, most directly measurable business justification for investing in Core Web Vitals optimization, since it ties technical work directly to revenue outcomes that stakeholders across an organization can readily understand and support.
Mobile-First Indexing Connection
Since Google primarily indexes and ranks based on the mobile version of your site, mobile Core Web Vitals scores matter more than desktop ones in most cases. This mobile-first approach reflects the broader reality that mobile traffic now dominates web usage across most industries and audiences.
Practically, this means that if resources are limited and priorities need to be set, mobile-specific Core Web Vitals optimization generally deserves priority over desktop-specific work, given its more direct connection to how Google evaluates a site.
This doesn’t mean desktop performance should be ignored entirely, but rather that mobile performance should be treated as the primary benchmark against which overall site performance success is measured going forward.
Relationship With Helpful Content
Google’s helpful content systems focus on whether content genuinely serves user needs. Page experience complements that by making sure people can actually access and interact with that content smoothly once they arrive. These two systems work together conceptually — helpful content ensures there’s something genuinely valuable for a visitor to engage with, while good page experience ensures that value isn’t undermined by a frustrating or broken delivery mechanism.
A page could theoretically have excellent, genuinely helpful content while still suffering from poor Core Web Vitals, and in that scenario, the technical issues risk undermining the full potential impact of that otherwise strong content.
Thinking of Core Web Vitals as protecting and enabling your content investment, rather than as a separate, competing priority, helps frame technical performance work in a way that resonates with content-focused stakeholders as well.
Advanced Optimization Techniques
Server-Side Rendering (SSR)
Rendering pages on the server instead of relying entirely on client-side JavaScript means users see meaningful content immediately instead of a blank page while scripts load and execute. This approach directly addresses one of the most common LCP problems in modern JavaScript-framework-based sites, where content that only exists after client-side rendering creates an unavoidable delay before anything meaningful appears.
SSR does introduce its own tradeoffs, typically requiring more server-side computational resources per request compared to serving pre-built static files, which means server capacity planning becomes an important consideration when adopting this approach.
Many modern frameworks now offer built-in or well-supported SSR capabilities, making this technique considerably more accessible than it was in earlier generations of JavaScript-heavy web development.
Static Site Generation (SSG)
Pre-building pages at deploy time instead of rendering on every request delivers extremely fast server response times since there’s no dynamic processing needed per visit. This approach essentially moves all the computational work of building a page to the deployment process, rather than repeating that work for every single visitor request.
SSG is particularly well-suited to content that doesn’t change frequently between deploys, such as blog posts, documentation, or marketing pages, where the same pre-built HTML can be served to every visitor without any need for per-request customization.
For sites with more dynamic, personalized, or frequently changing content, a hybrid approach combining SSG for stable content with more dynamic rendering for personalized elements often provides the best balance of performance and functionality.
Edge Caching
Serving cached content from edge servers close to users, rather than a single origin server, dramatically cuts latency for global audiences. This extends the basic CDN concept further, sometimes allowing even dynamically generated content to be cached and served from edge locations rather than requiring a full round trip back to a central origin server.
Modern edge computing platforms increasingly allow some application logic to run directly at the edge as well, further reducing the latency involved in generating a response for a given request.
This technique is particularly valuable for sites with a genuinely global audience, where the physical distance between visitors and a single origin server would otherwise introduce meaningful latency regardless of how well-optimized the origin infrastructure itself is.
HTTP/2 and HTTP/3
Newer protocol versions allow multiplexed requests over a single connection, reducing the overhead of loading many small assets compared to older HTTP/1.1 connections. Older protocol versions required separate connections for concurrent requests, introducing overhead that became particularly noticeable on pages with many individual resources to fetch.
HTTP/3 in particular introduces further improvements built on top of a different underlying transport protocol, offering additional resilience and performance benefits especially on less reliable network connections common in mobile browsing.
Most modern hosting providers and CDNs now support these newer protocols by default, meaning many sites benefit from this improvement automatically without requiring any specific configuration effort.
Brotli Compression
Generally outperforms Gzip for compressing text-based assets, giving smaller file sizes for the same content without any visible quality tradeoff. Brotli was specifically designed with modern web content in mind, generally achieving meaningfully better compression ratios than the older, more widely established Gzip standard.
Because it’s lossless compression applied to text-based files like HTML, CSS, and JavaScript, there’s no quality tradeoff to worry about — the decompressed content is identical to the original, just transmitted more efficiently.
Browser and server support for Brotli has become widespread, making it a relatively straightforward upgrade for sites still relying solely on Gzip compression for their text-based assets.
Critical CSS
Extracting and inlining only the CSS needed for above-the-fold content lets the browser paint immediately, deferring the rest until after initial render. This technique directly targets the render-blocking CSS problem discussed earlier, ensuring the browser has just enough styling information to paint the initially visible content without waiting on the full stylesheet.
Automating this extraction process, rather than manually maintaining a separate critical CSS file, is important for keeping this optimization accurate and up to date as a site’s design evolves over time.
Several build tools and plugins exist specifically to automate critical CSS extraction, integrating it into standard build and deployment pipelines rather than requiring ongoing manual maintenance.
Resource Hints (Preload, Prefetch, Preconnect)
These give the browser early hints about what to fetch, letting it start critical downloads earlier in the loading process than it otherwise would. Each of these hints serves a slightly different purpose — preload for resources needed for the current page, prefetch for resources likely needed for a future navigation, and preconnect for establishing early connections to important third-party domains.
Used correctly, these hints can shave meaningful time off both LCP and overall perceived loading speed by allowing the browser to work ahead of where it would naturally discover a given resource through normal parsing order.
Overusing these hints, however, can backfire, since instructing the browser to prioritize too many resources simultaneously dilutes the benefit intended for the genuinely most critical ones, so selective, deliberate use tends to produce the best results.
JavaScript Tree Shaking
Modern bundlers can eliminate code that’s imported but never actually used, reducing bundle size without changing functionality. This automated dead-code elimination process happens as part of the build step, analyzing which parts of imported libraries and modules are actually referenced in the final application code.
Tree shaking works most effectively with libraries specifically designed to support it, using module formats and coding patterns that make it easier for build tools to accurately determine what’s genuinely unused.
This technique complements manual dead-code removal efforts, automatically catching unused code within third-party dependencies that would be impractical to manually audit and trim by hand.
Code Splitting
Breaking large JavaScript bundles into smaller chunks loaded only when needed keeps initial page load lean. As discussed in the INP section, this technique ensures visitors only download and parse the code genuinely relevant to the page or feature they’re currently using, rather than the entire application’s worth of JavaScript upfront.
Modern build tools have made this significantly more automated than in the past, often splitting code intelligently based on routes or dynamic import statements without requiring extensive manual configuration.
Combined with lazy loading of non-critical JavaScript modules, code splitting represents one of the more architecturally significant, though also more impactful, techniques available for improving both LCP and INP on JavaScript-heavy sites.
Performance Budgets
Setting hard limits on page weight, script size, or request counts during development prevents performance from silently degrading over time as new features get added. A performance budget essentially treats page weight and resource count like any other engineering constraint — a hard limit that new features and additions have to work within, rather than an afterthought addressed only once problems have already emerged.
Integrating budget checks into automated build or CI/CD pipelines means violations get caught and flagged immediately during development, rather than being discovered much later after a problematic feature has already shipped to production.
This proactive, constraint-based approach represents one of the more effective long-term strategies for preventing the gradual performance erosion discussed throughout the monitoring and mistakes sections of this guide, addressing the root organizational cause rather than just the symptoms.
Conclusion
At the end of the day, Core Web Vitals boil down to one idea Google’s been circling for years: measure what users actually feel, not what’s technically convenient to measure. LCP tells you if something useful shows up fast enough. INP tells you if the page responds when someone tries to use it. CLS tells you if the thing stays put while they’re reading or clicking. Each metric captures a distinct, genuinely felt moment of frustration or satisfaction in a real person’s experience of using your site.
Don’t treat these as three separate checkboxes to tick off in isolation. They’re connected — heavy JavaScript hurts both LCP and INP, unreserved space for dynamic content hurts both LCP and CLS. Fix the root causes — bloated scripts, uncompressed images, unreserved layout space, slow servers — and all three tend to improve together, since so many of the underlying culprits overlap across multiple metrics simultaneously.
Build a habit of checking real field data regularly instead of chasing a perfect lab score once and calling it done. Prioritize what actual visitors experience over what a synthetic test reports, and treat performance work as an ongoing discipline rather than a one-time project with a clear finish line. And bake performance checks into every redesign, every new plugin install, every content update from here on out. That’s really the only sustainable way to keep Core Web Vitals — and the actual experience behind them — in good shape long term.
Frequently Asked Questions
What are Core Web Vitals?
They’re three specific metrics — LCP, INP, and CLS — that Google uses to measure real-world loading speed, interaction responsiveness, and visual stability on a webpage. Together, they represent Google’s attempt to quantify how a page actually feels to use, rather than relying purely on older, more technical measures of speed that didn’t always align with genuine user experience.
What is a good LCP score?
2.5 seconds or less, measured at the 75th percentile of page loads. This threshold reflects research into how quickly a delay starts to feel noticeable and frustrating to real users across a wide range of devices and network conditions.
What is a good INP score?
200 milliseconds or less, measured across all interactions during a page visit. Because INP samples the entire visit rather than just a single click, achieving this consistently requires attention to every interactive element on a page, not just the most obvious or frequently used ones.
What is a good CLS score?
0.1 or less, calculated across the largest session window of layout shifts. Unlike the time-based LCP and INP metrics, CLS is a unitless score reflecting how much and how far visible content moved unexpectedly during a page’s lifecycle.
Does Core Web Vitals affect SEO rankings?
Yes, it’s a confirmed ranking signal, though a relatively minor one compared to content relevance and overall page quality. It functions more as a tiebreaker among similarly relevant pages than as a dominant, standalone ranking driver on its own.
How often should I test Core Web Vitals?
At minimum monthly, and always immediately after any major site update, new plugin installation, or redesign. This combination of scheduled and change-triggered testing helps catch both gradual drift and sudden regressions before they accumulate into significant problems.
Why is my PageSpeed score different from Search Console?
PageSpeed Insights often shows lab data alongside field data for a single URL, while Search Console shows aggregated field data across similar page groups — different data sources measured under different conditions. Understanding this distinction prevents confusion when the two tools appear to disagree about a given page’s performance.
Can plugins improve Core Web Vitals?
Yes, caching and image optimization plugins genuinely help, but they can’t fix fundamentally bloated themes or poorly coded custom functionality on their own. Plugins address specific, well-defined performance levers, but they’re not a substitute for addressing deeper architectural or code-quality issues underlying a genuinely poor-performing site.
Is Core Web Vitals more important than content quality?
No. Content relevance and quality still dominate ranking outcomes; Core Web Vitals act more as a tiebreaker among similarly strong pages. Resource allocation decisions should reflect this hierarchy, ensuring content investment isn’t shortchanged in pursuit of purely technical performance gains.
How long does it take Google to recognize improvements?
Field data in Search Console uses a rolling 28-day window, so it typically takes at least a few weeks after a fix before improvements show up clearly in reporting. This delay is worth accounting for when evaluating whether a given optimization effort has actually succeeded, since checking too soon after a change may not yet reflect its true impact.
Do Core Web Vitals matter for desktop sites too?
Yes, desktop has its own separate thresholds and gets evaluated independently from mobile, even though mobile tends to get more attention since most traffic is mobile. Given mobile-first indexing, however, mobile performance should generally take priority when resources or attention are limited.
What’s the difference between lab data and field data?
Lab data comes from simulated, controlled tests, while field data comes from actual users visiting your site with their real devices and networks. Lab data is ideal for fast, isolated testing during development, while field data represents the genuine, authoritative picture of real-world performance that Google actually uses for its official evaluation.