


Every Monday morning, somewhere, a marketer opens a dashboard, screenshots the follower count and the like total, drops it into a slide, and calls it a report. Nobody in that meeting learns anything new. Nobody makes a different decision because of it. That’s not analytics. That’s scorekeeping, and scorekeeping doesn’t grow a business, no matter how clean the slide looks.
Here’s the actual problem, and it shows up in almost every marketing team eventually. Some teams drown in every metric a platform throws at them, forty numbers spread across five tabs, half of which nobody can define on the spot if asked. Other teams swing the opposite direction and lock onto one number that makes leadership feel good in a meeting, usually follower count or total impressions, and ignore everything else because it’s simpler that way. Both approaches fail for the exact same reason. Neither one connects a number to a decision. A metric that doesn’t change what happens next week isn’t doing its job, it’s just occupying space on a slide.
This guide exists to fix that gap. It walks through which social media metrics genuinely matter, why they matter, the formula behind each one, what a realistic “good” number actually looks like, and how all of it comes together into a report someone will actually read instead of skim past. Along the way, it also covers what platform native dashboards get wrong, where third-party tools earn their cost, and the handful of mistakes that quietly wreck good data. By the end, defending every single number on a slide should feel easy, because each one will be tied to something real, a goal, a funnel stage, a decision worth making.
What Social Media Analytics Actually Means
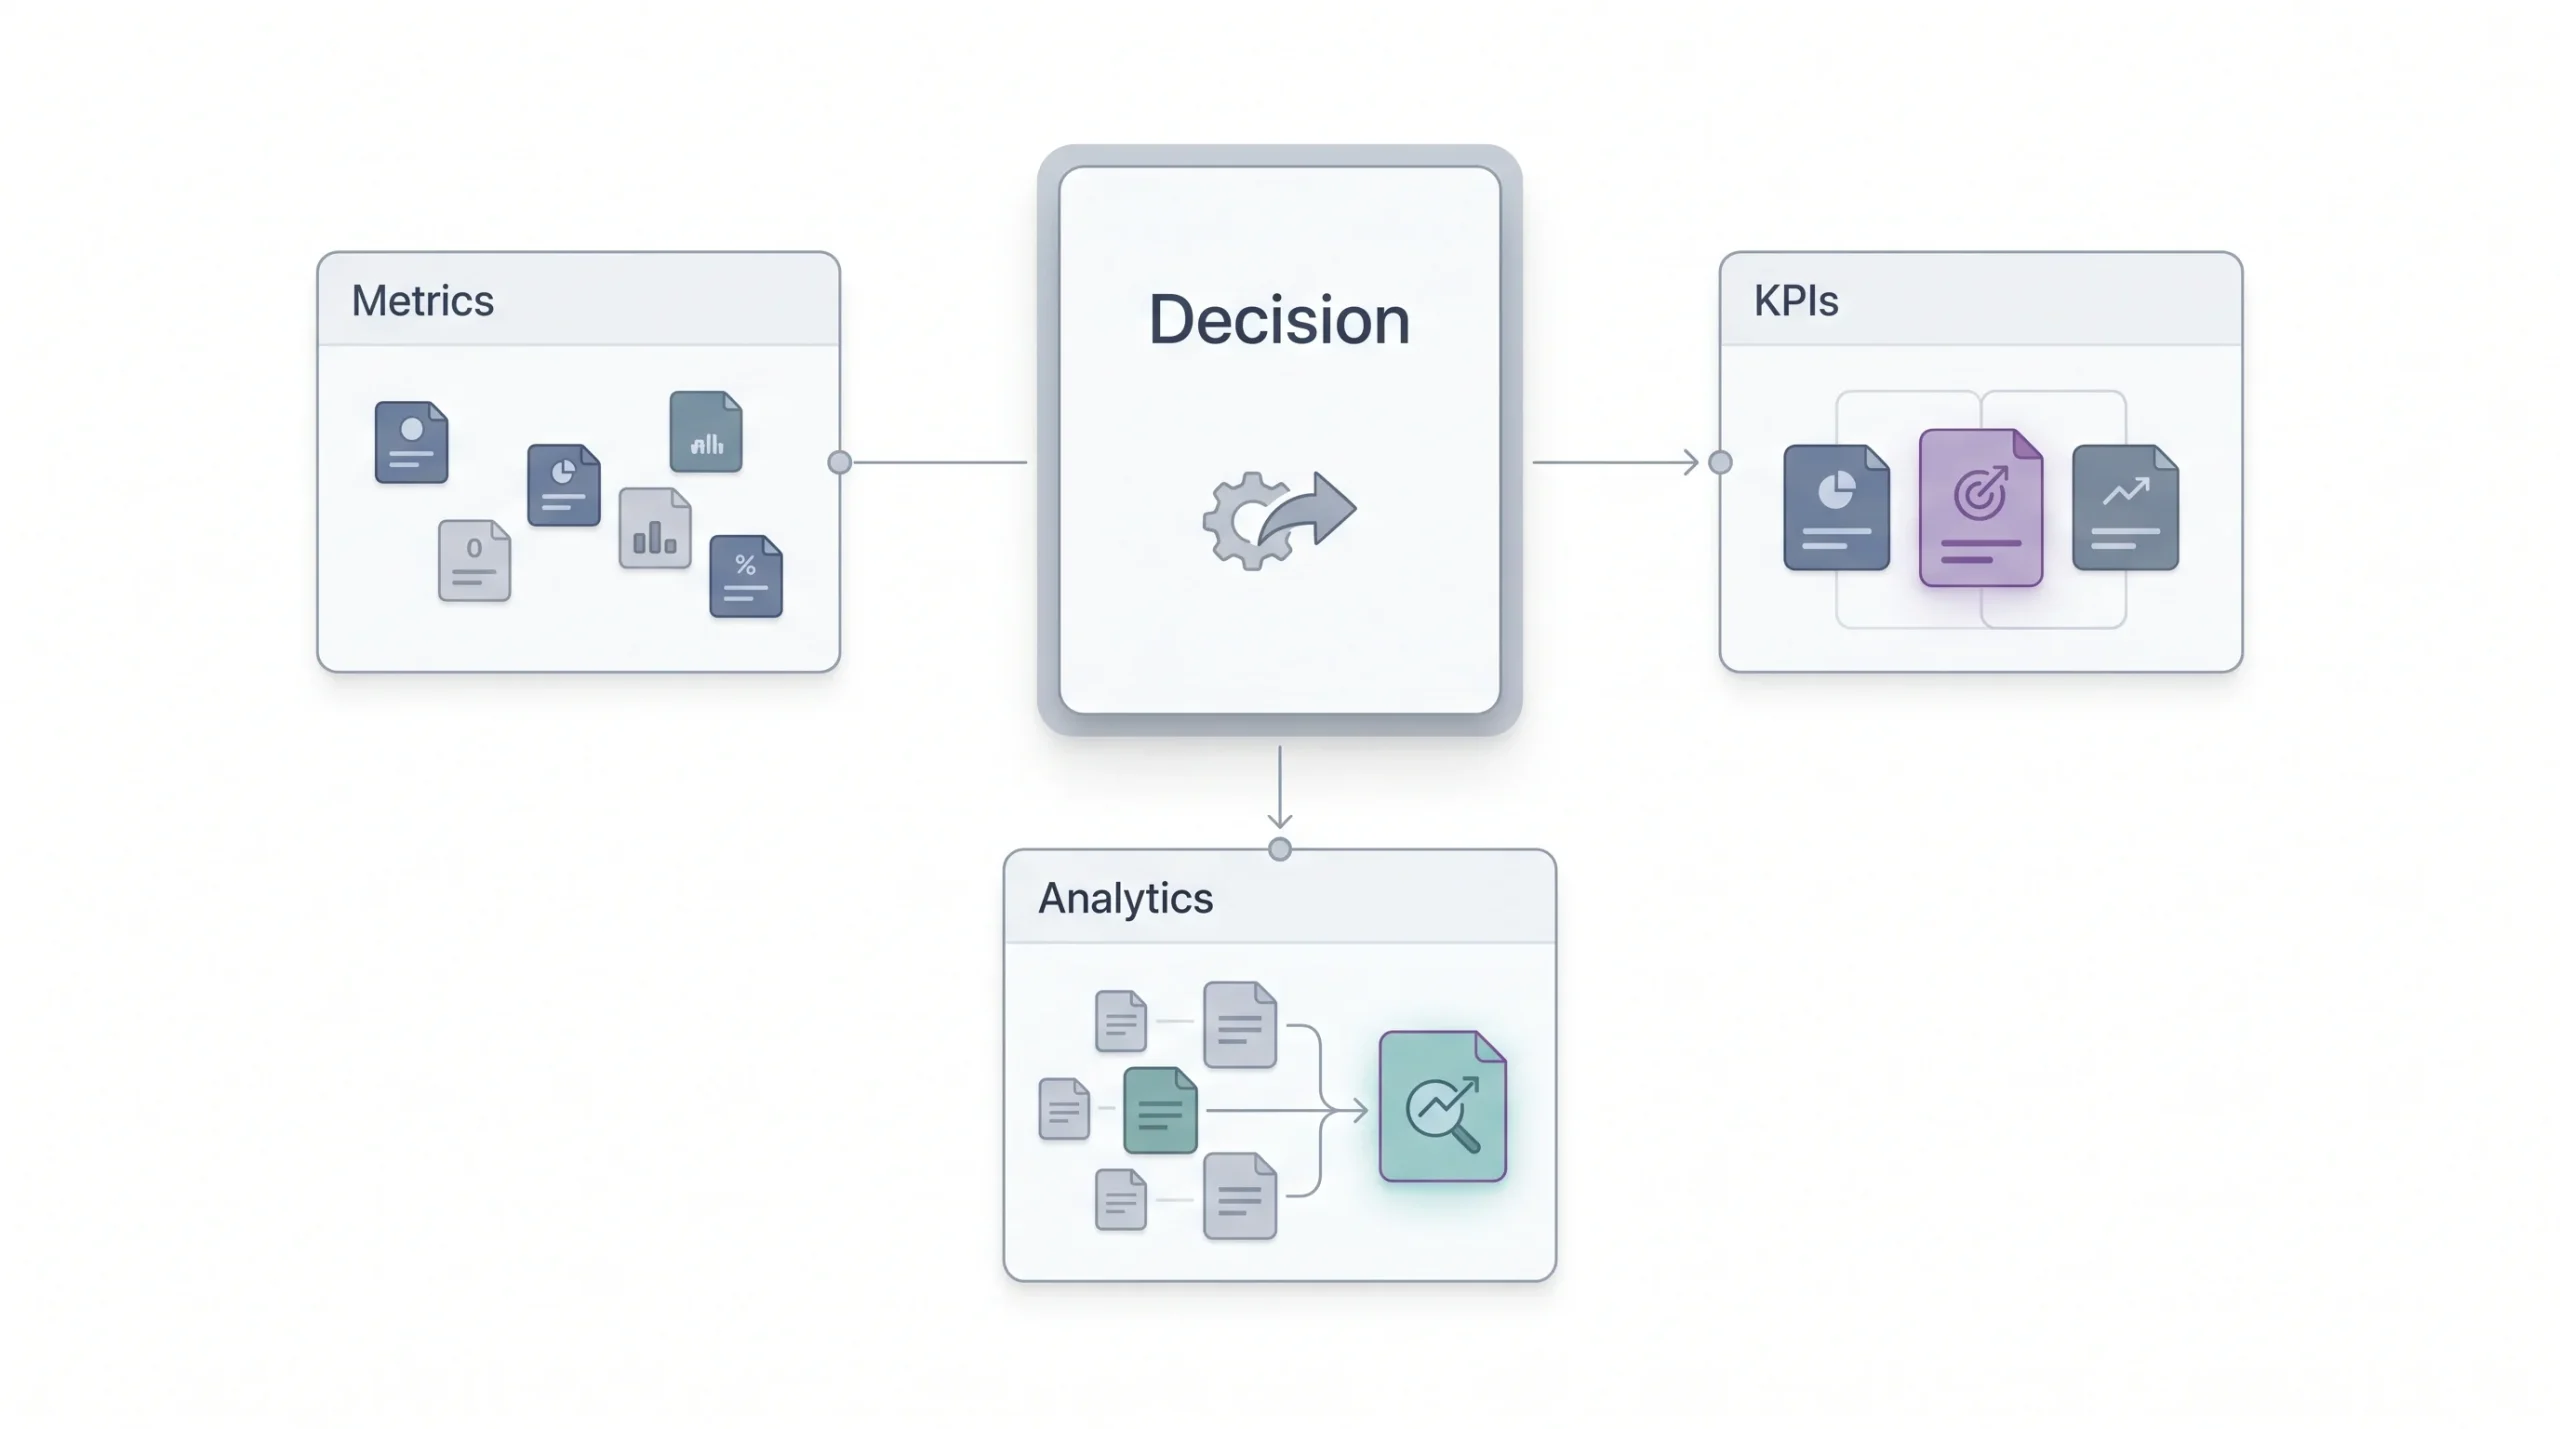
People throw around “metric,” “KPI,” and “analytics” like they’re interchangeable. They’re not, and mixing them up is exactly how teams end up reporting the wrong numbers to the wrong people at the wrong time.
A metric is just a raw, trackable data point. Likes. Reach. Impressions. It’s a number, nothing more, nothing less. It doesn’t carry meaning on its own. A KPI is a metric that’s been tied to a specific business goal, and that’s the exact thing that turns a plain number into something worth watching closely. Conversion rate only becomes a KPI the moment someone decides the actual goal is sales, not just clicks or traffic. Before that decision gets made, conversion rate is just another metric sitting in a dashboard next to fifty others, getting ignored. And analytics is the process wrapped around all of it, the act of interpreting numbers to actually change behavior going forward. Somebody noticing that saves consistently spike whenever a carousel goes out on a Tuesday, and shifting the content calendar because of that pattern, that’s analytics happening in real time. Pulling the raw save count into a spreadsheet and moving on is not. It’s just data collection.
Native analytics inside each platform handles a decent chunk of this on its own, at least for a single channel. Meta Business Suite, LinkedIn’s analytics tab, TikTok’s creator dashboard, all of them are genuinely fine when there’s only one account to manage. The trouble starts the moment a brand runs more than one platform, which is most brands past a certain size. Now there’s no shared view across channels, no easy way to compare a Reel’s performance against a LinkedIn carousel without manually copying numbers into a spreadsheet every single week. And even once that spreadsheet exists, data still isn’t insight. A sheet full of numbers tells nobody anything until someone actually sits with it and asks what changed, why it changed, and what to do differently because of it.
| Term | What it is | Example |
|---|---|---|
| Metric | A raw, trackable data point | Likes, reach, impressions |
| KPI | A metric tied directly to a business goal | Conversion rate, when the stated goal is sales |
| Analytics | The process of interpreting metrics to guide decisions | Noticing saves rise on carousel posts and shifting the calendar to post more of them |
The distinction matters more than it sounds like it should, mostly because it changes how a report gets built from the ground up. A report built around metrics lists numbers. A report built around KPIs makes a case. And analytics, real analytics, is what happens in the gap between the two, when someone looks at the numbers long enough to notice a pattern and act on it instead of just filing it away.
Vanity Metrics vs. Metrics That Matter
Follower count gets reported more than almost any other number in social media, and it explains almost nothing on its own. Total likes get the same treatment. So does raw impressions. All three are easy to screenshot, easy to drop into a slide, and largely disconnected from whether the business behind the account is actually moving forward.
That doesn’t make them worthless, and calling them “vanity metrics” and tossing the whole category aside is its own kind of lazy thinking. A follower count still genuinely matters in the very early stages of building a brand’s presence, when the actual goal is just getting on people’s radar for the first time. The real problem shows up when a number gets reported as if it proves something it was never built to prove. Reach tells someone a post was shown to a certain number of people. That’s it. It says nothing about whether those people cared, clicked, remembered the brand a day later, or scrolled straight past without registering what they saw. A post with strong reach and flat engagement usually means the content got distributed well but didn’t land emotionally or practically, and that’s a very different story than the one a big reach number tells sitting alone on a slide.
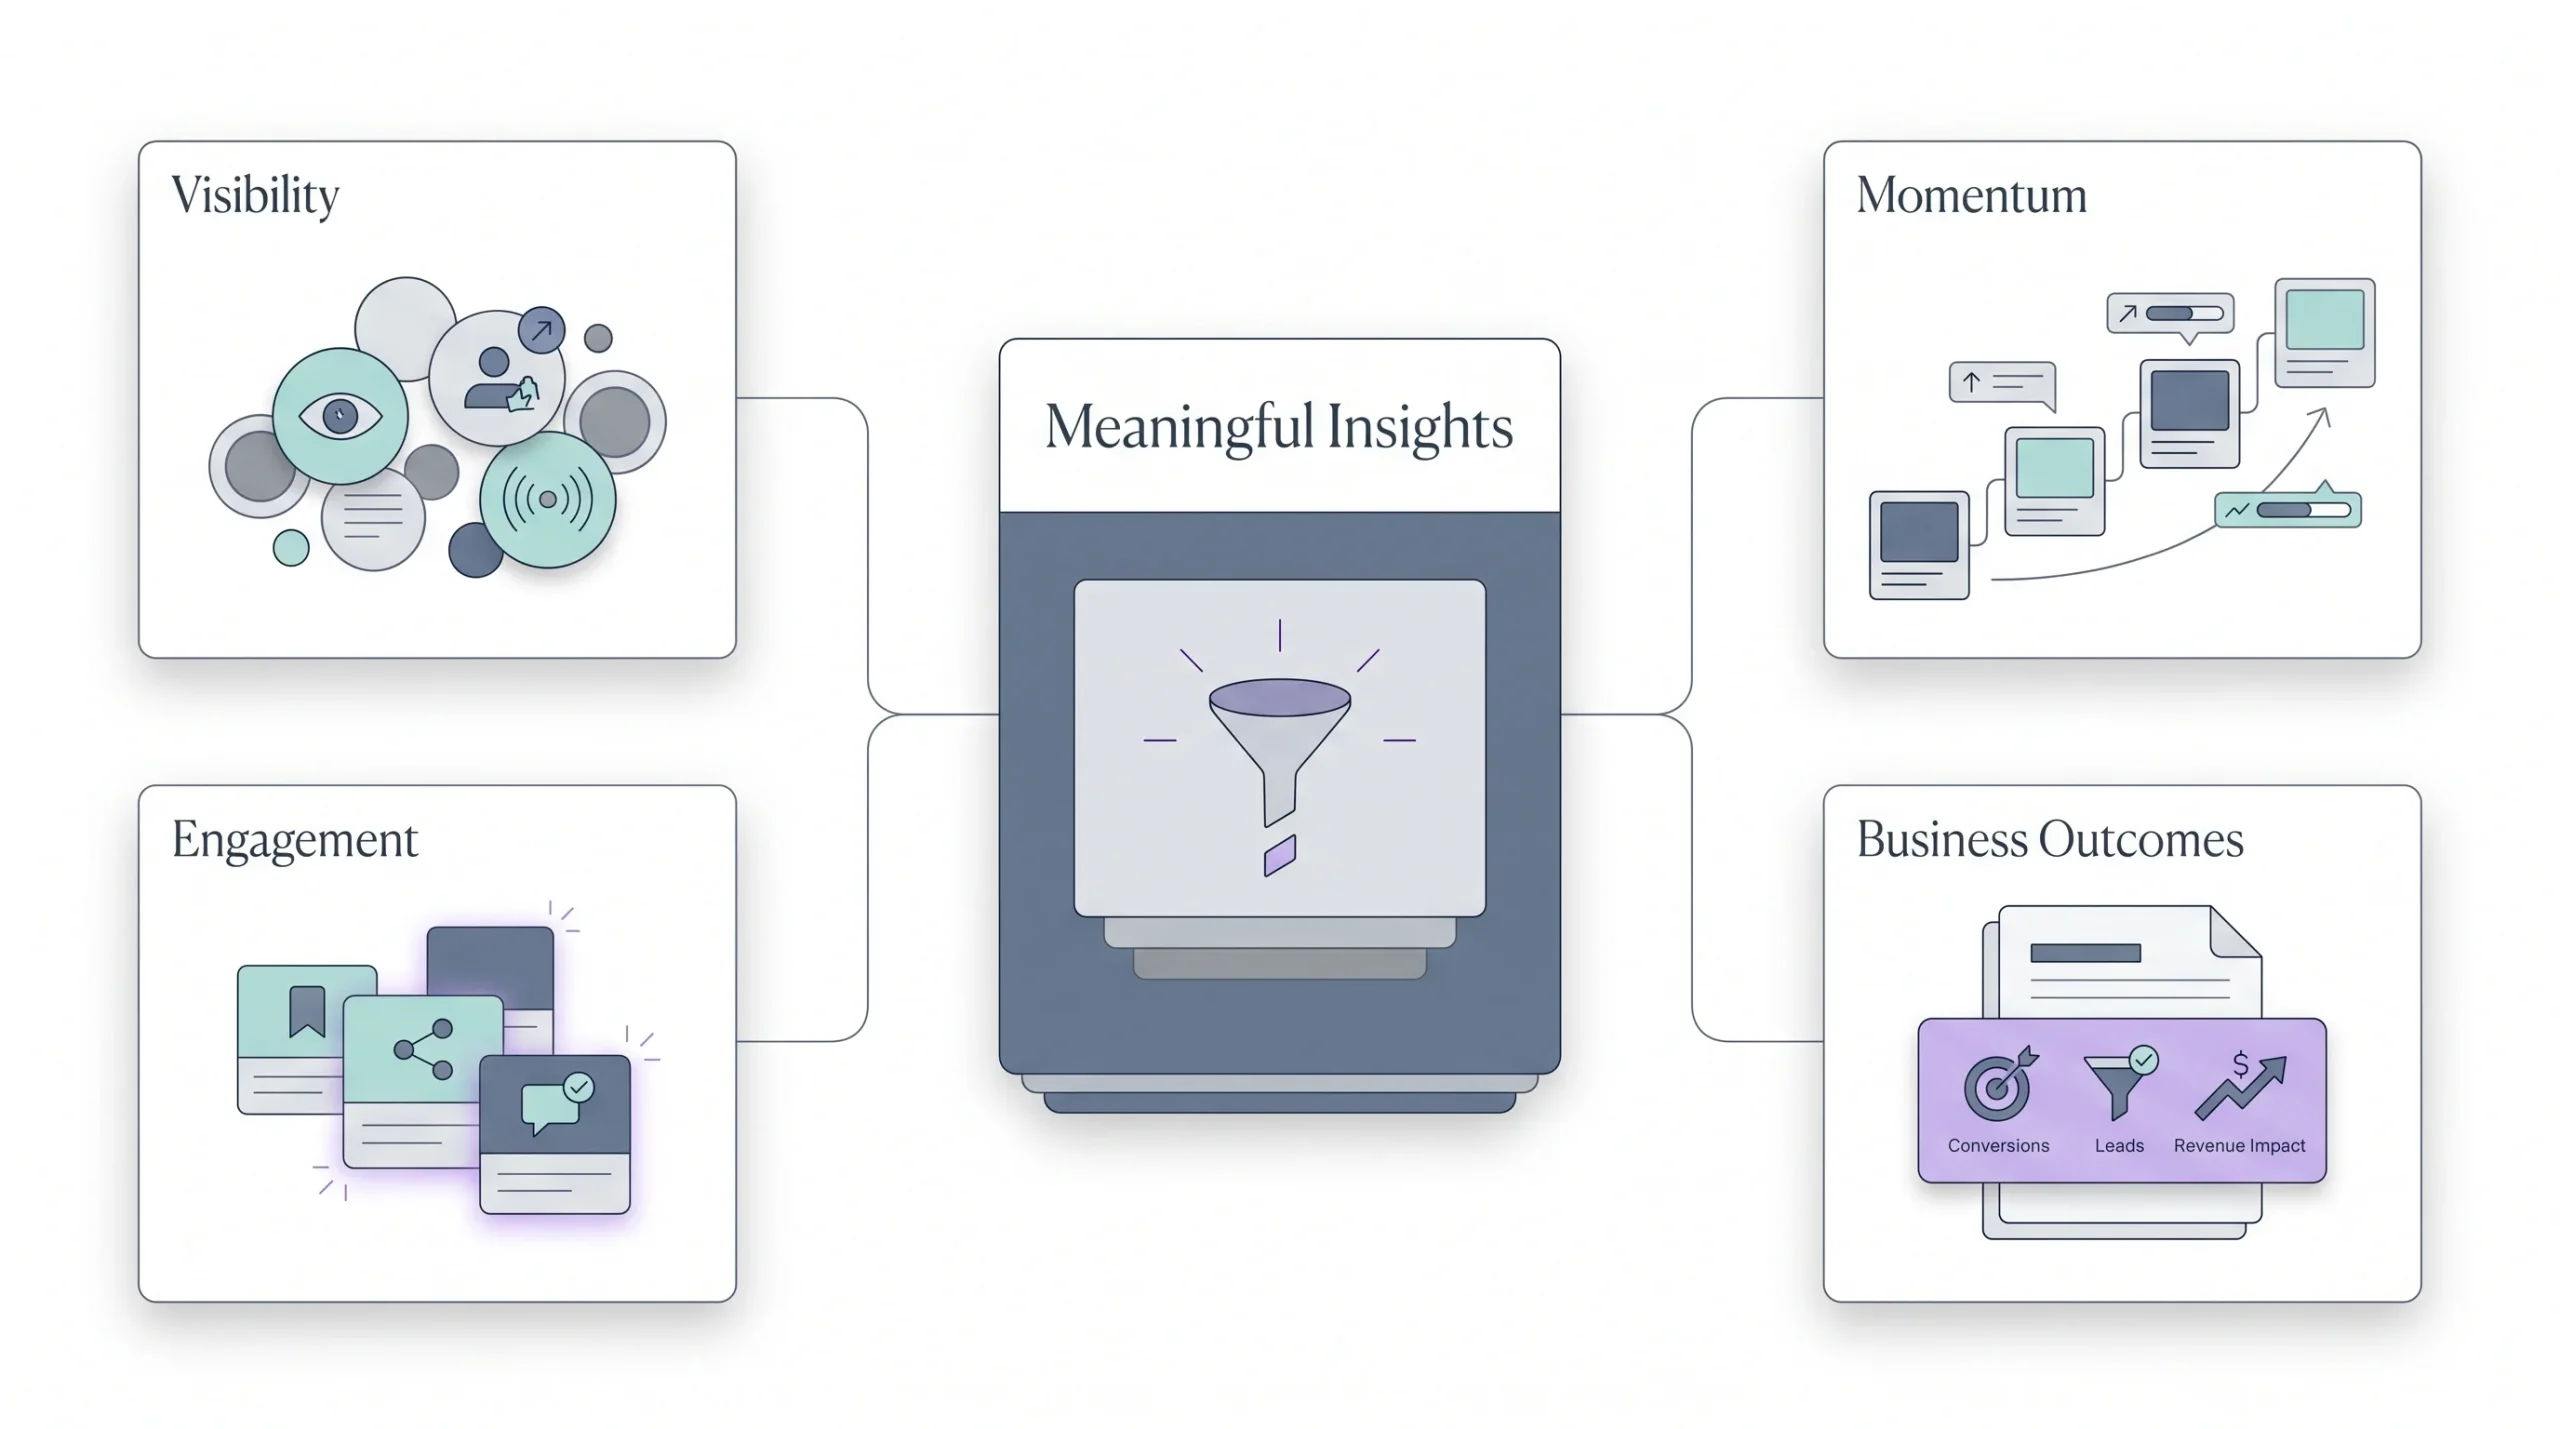
Look at what actually happens once metrics get grouped by what question they answer, rather than treated as one big undifferentiated pile of numbers. Vanity metrics show visibility, plain and simple, how many eyeballs technically had a chance to see something. Engagement-depth metrics, saves, shares, real comments with actual words in them, show whether people cared enough to act rather than just glance. Momentum metrics show whether a piece of content is picking up speed on its own or already stalling out, which matters enormously when deciding what to boost with paid spend. And business-outcome metrics, conversion rate, ROAS, leads generated, tie straight back to revenue, the number that ultimately funds the whole operation. Each category answers a genuinely different question, and none of the four can substitute for the other three, no matter how tempting it is to lean on whichever one looks best that month.
| Category | Examples | Why it’s often overrated | When it’s actually useful |
|---|---|---|---|
| Vanity | Follower count, total likes, raw impressions | Easy to inflate, doesn’t tie to outcomes | Early-stage brand awareness tracking |
| Engagement-depth | Saves, shares, comments, watch time | Signals real interest, not just a glance | Content and creative decisions |
| Momentum | Engagement velocity, share-to-reach ratio | Shows whether content is gaining traction, not just its size | Spotting what to boost or repurpose |
| Business-outcome | Conversion rate, ROAS, leads generated, social-attributed traffic | Directly tied to revenue | Budget and leadership conversations |
Reach tells you a post was seen. Saves and shares tell you it was worth remembering.
Worth saying plainly, none of this means ignoring vanity metrics entirely, deleting them from every report, and pretending they don’t exist. It means putting them in their proper place. A brand-new account with zero followers absolutely should track follower growth closely for the first several months, because at that stage, existing simply isn’t enough, getting discovered is the whole game. The mistake isn’t tracking these numbers. The mistake is letting them anchor a report meant to answer a completely different question, like whether a campaign actually paid for itself.
The Framework: Match Metrics to Your Goal and Funnel Stage
This is the part most guides skip entirely, jumping straight from “here are twenty metrics” to a definitions list without ever explaining how to choose between them. And it’s the part that actually matters most, because it’s what turns a wall of numbers into a short, usable list. The wrong question, the one nearly everyone asks first, is “which metrics should I track.” Ask that question and the answer balloons into every metric a platform makes available, because technically all of them could matter in some hypothetical scenario. The right question is narrower and much more useful: “what decision am I trying to make right now, and where does that decision sit in the funnel.” Once that’s answered clearly, the metric list shrinks fast, and every number left standing on it has an actual job to do.
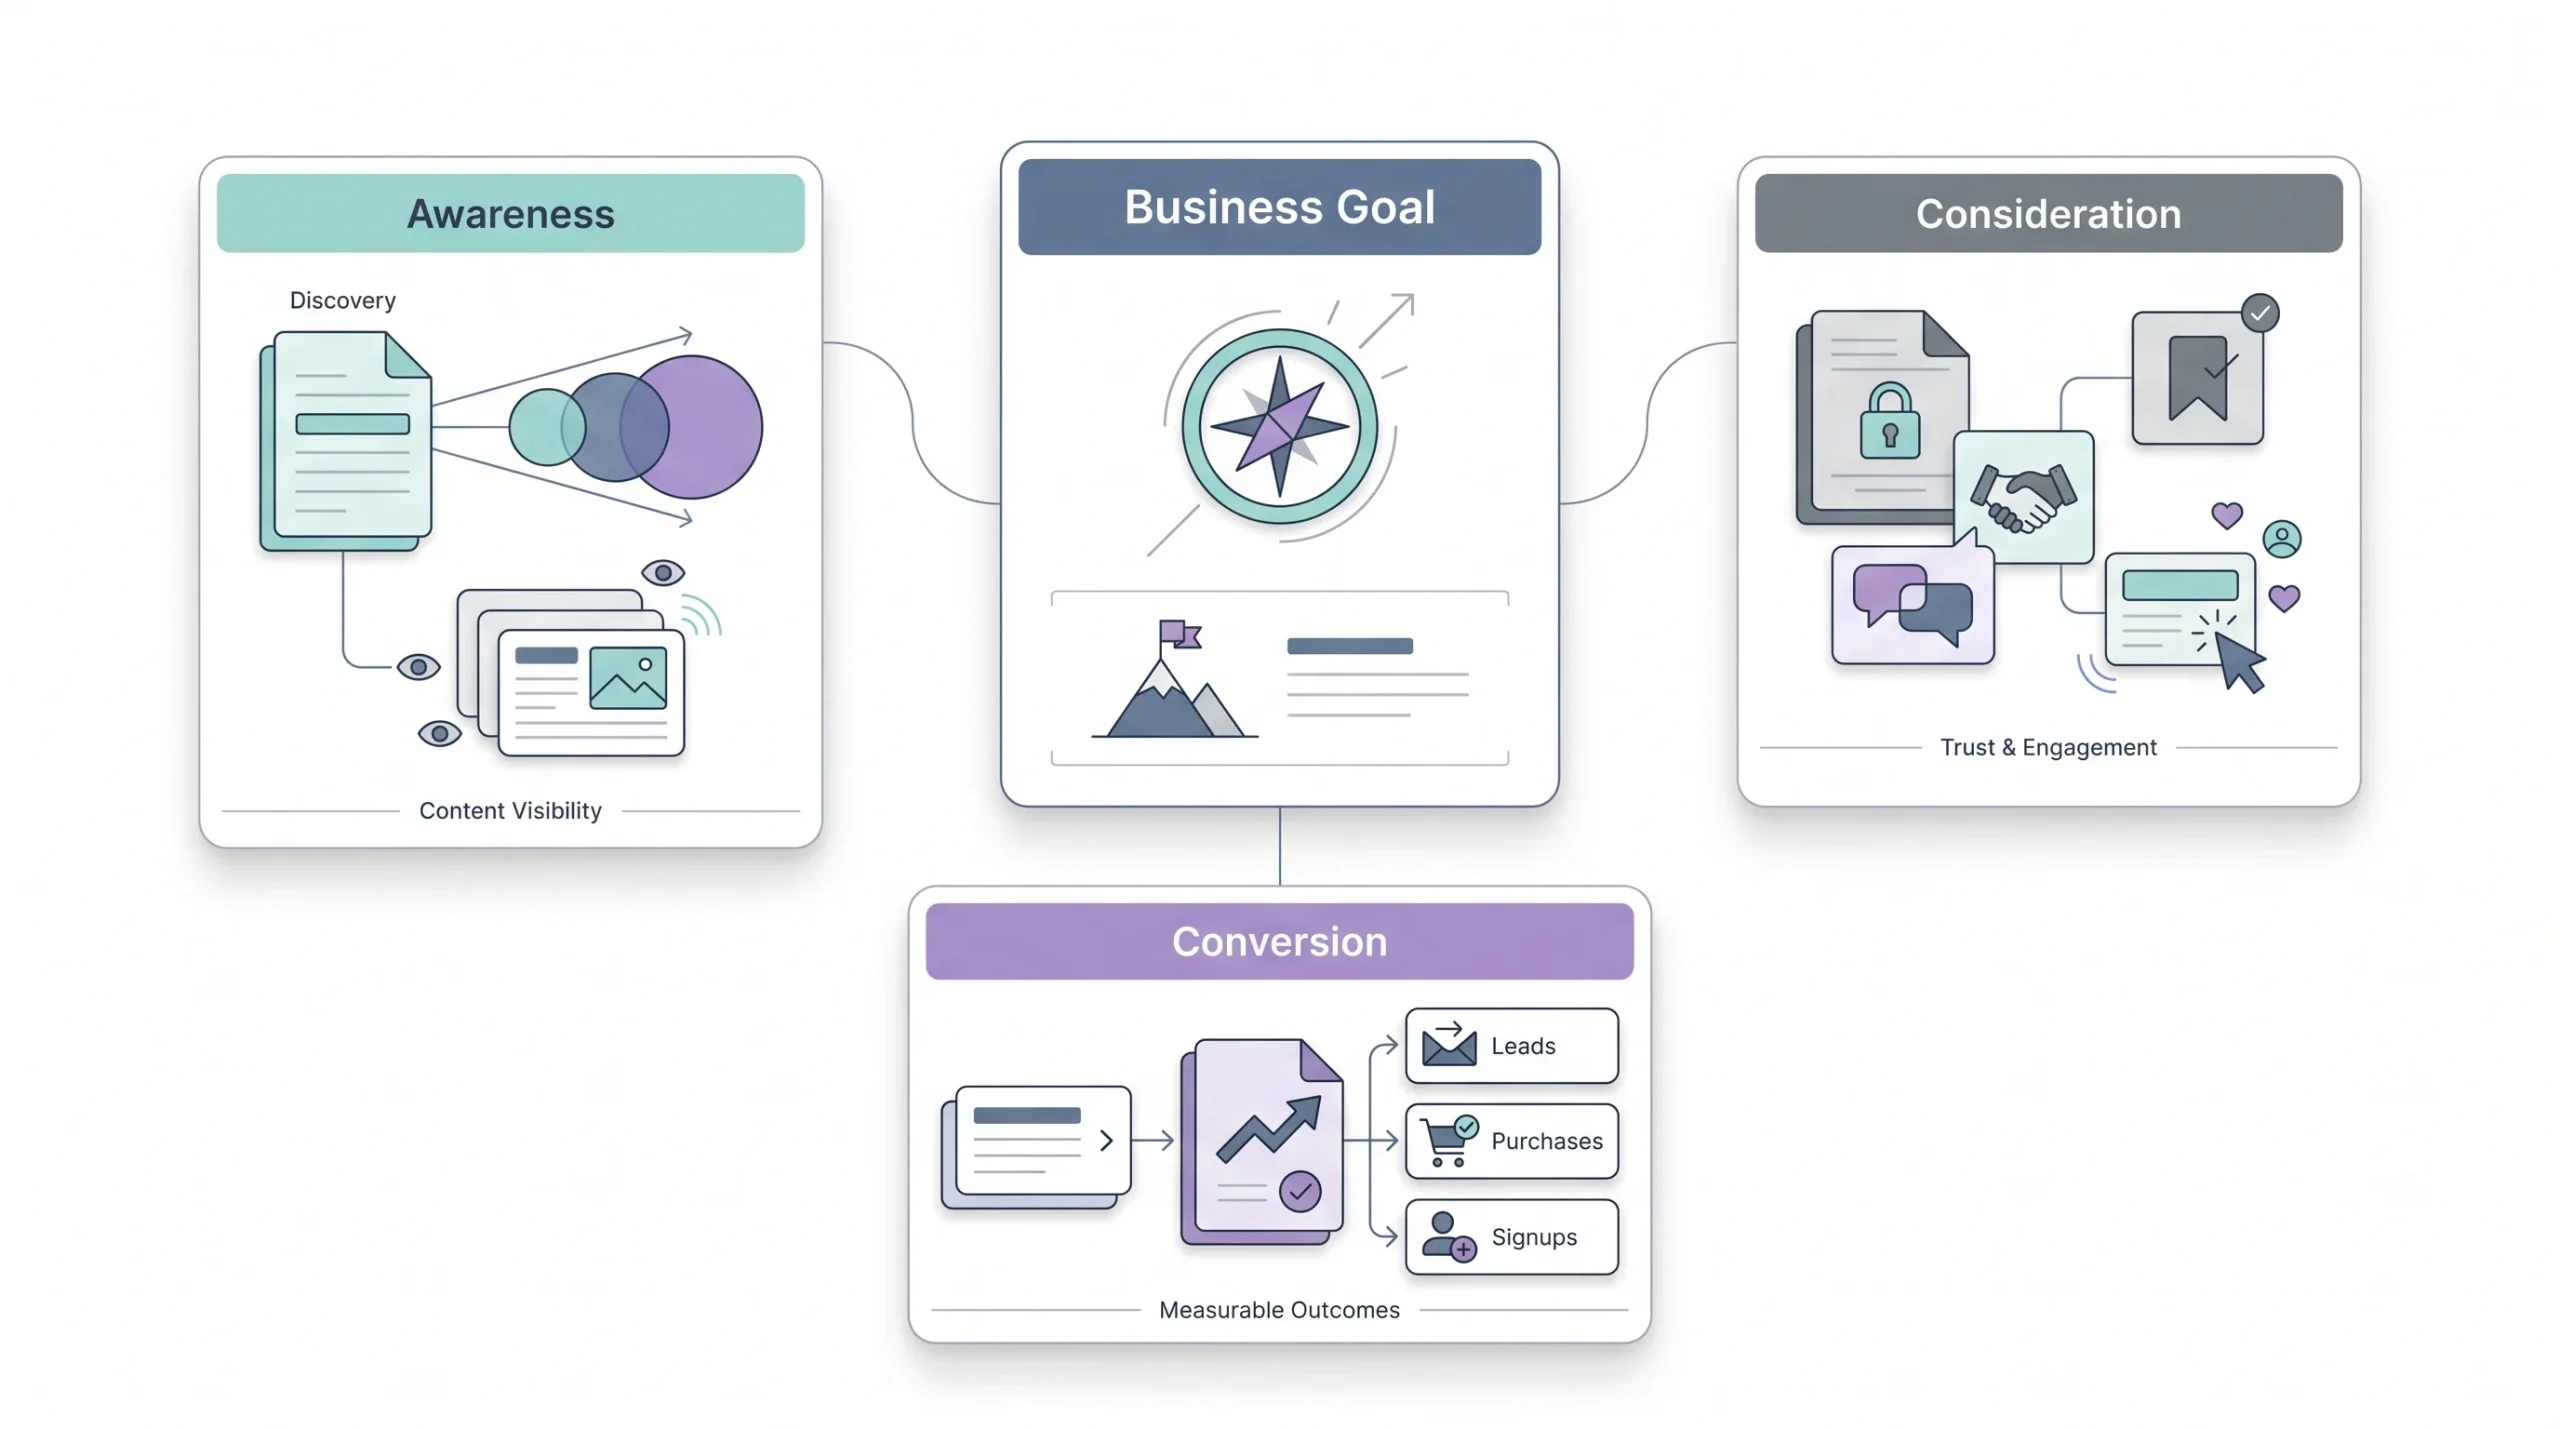
Think about it in three stages, the same way a sales funnel has always worked, just applied to social content instead of a sales pipeline. Awareness is about getting seen by the right people, not simply more people, which is a distinction that gets lost constantly. Consideration is about earning enough attention that someone decides the content, and by extension the brand behind it, is worth their continued time. Conversion is where all of that either turns into a measurable business result, a sale, a signup, a lead, or it quietly doesn’t, no matter how good the earlier numbers looked. Each stage has its own two or three metrics that genuinely answer the specific question that stage is asking, and mixing them up is where most reporting goes sideways. Reach belongs firmly in awareness. It has no legitimate business being the headline metric in a conversion-focused report, and yet it shows up there constantly anyway, mostly because it’s the single easiest number to pull from a native dashboard without any real effort.
| Funnel stage | Business goal | Core metrics | What a good number tells you |
|---|---|---|---|
| TOFU (Awareness) | Get seen by the right people | Reach, impressions, share of voice, follower growth rate | Content is reaching new audiences beyond existing followers |
| MOFU (Consideration) | Earn attention and trust | Engagement rate, saves, shares, video completion rate, comments | People are actively choosing to spend time with the content |
| BOFU (Conversion) | Turn attention into action | CTR, conversion rate, cost per result, ROAS, leads generated | Social activity is producing a measurable business outcome |
Pick your funnel stage before you pick your metric. A high reach number means nothing if the goal was conversions.
This framework also does something quietly useful beyond just organizing metrics, it exposes gaps in a content strategy that would otherwise stay invisible. A brand posting constantly at the TOFU stage, reels for reach, carousels for visibility, but never publishing anything built to drive a click or a signup, is going to have a healthy awareness report and a completely empty conversion one, and no amount of extra tracking fixes that. The metrics were never the problem in that scenario. The content mix was. Seeing the funnel laid out this clearly tends to surface that kind of imbalance faster than staring at a spreadsheet full of undifferentiated numbers ever will.
Awareness Metrics, Explained
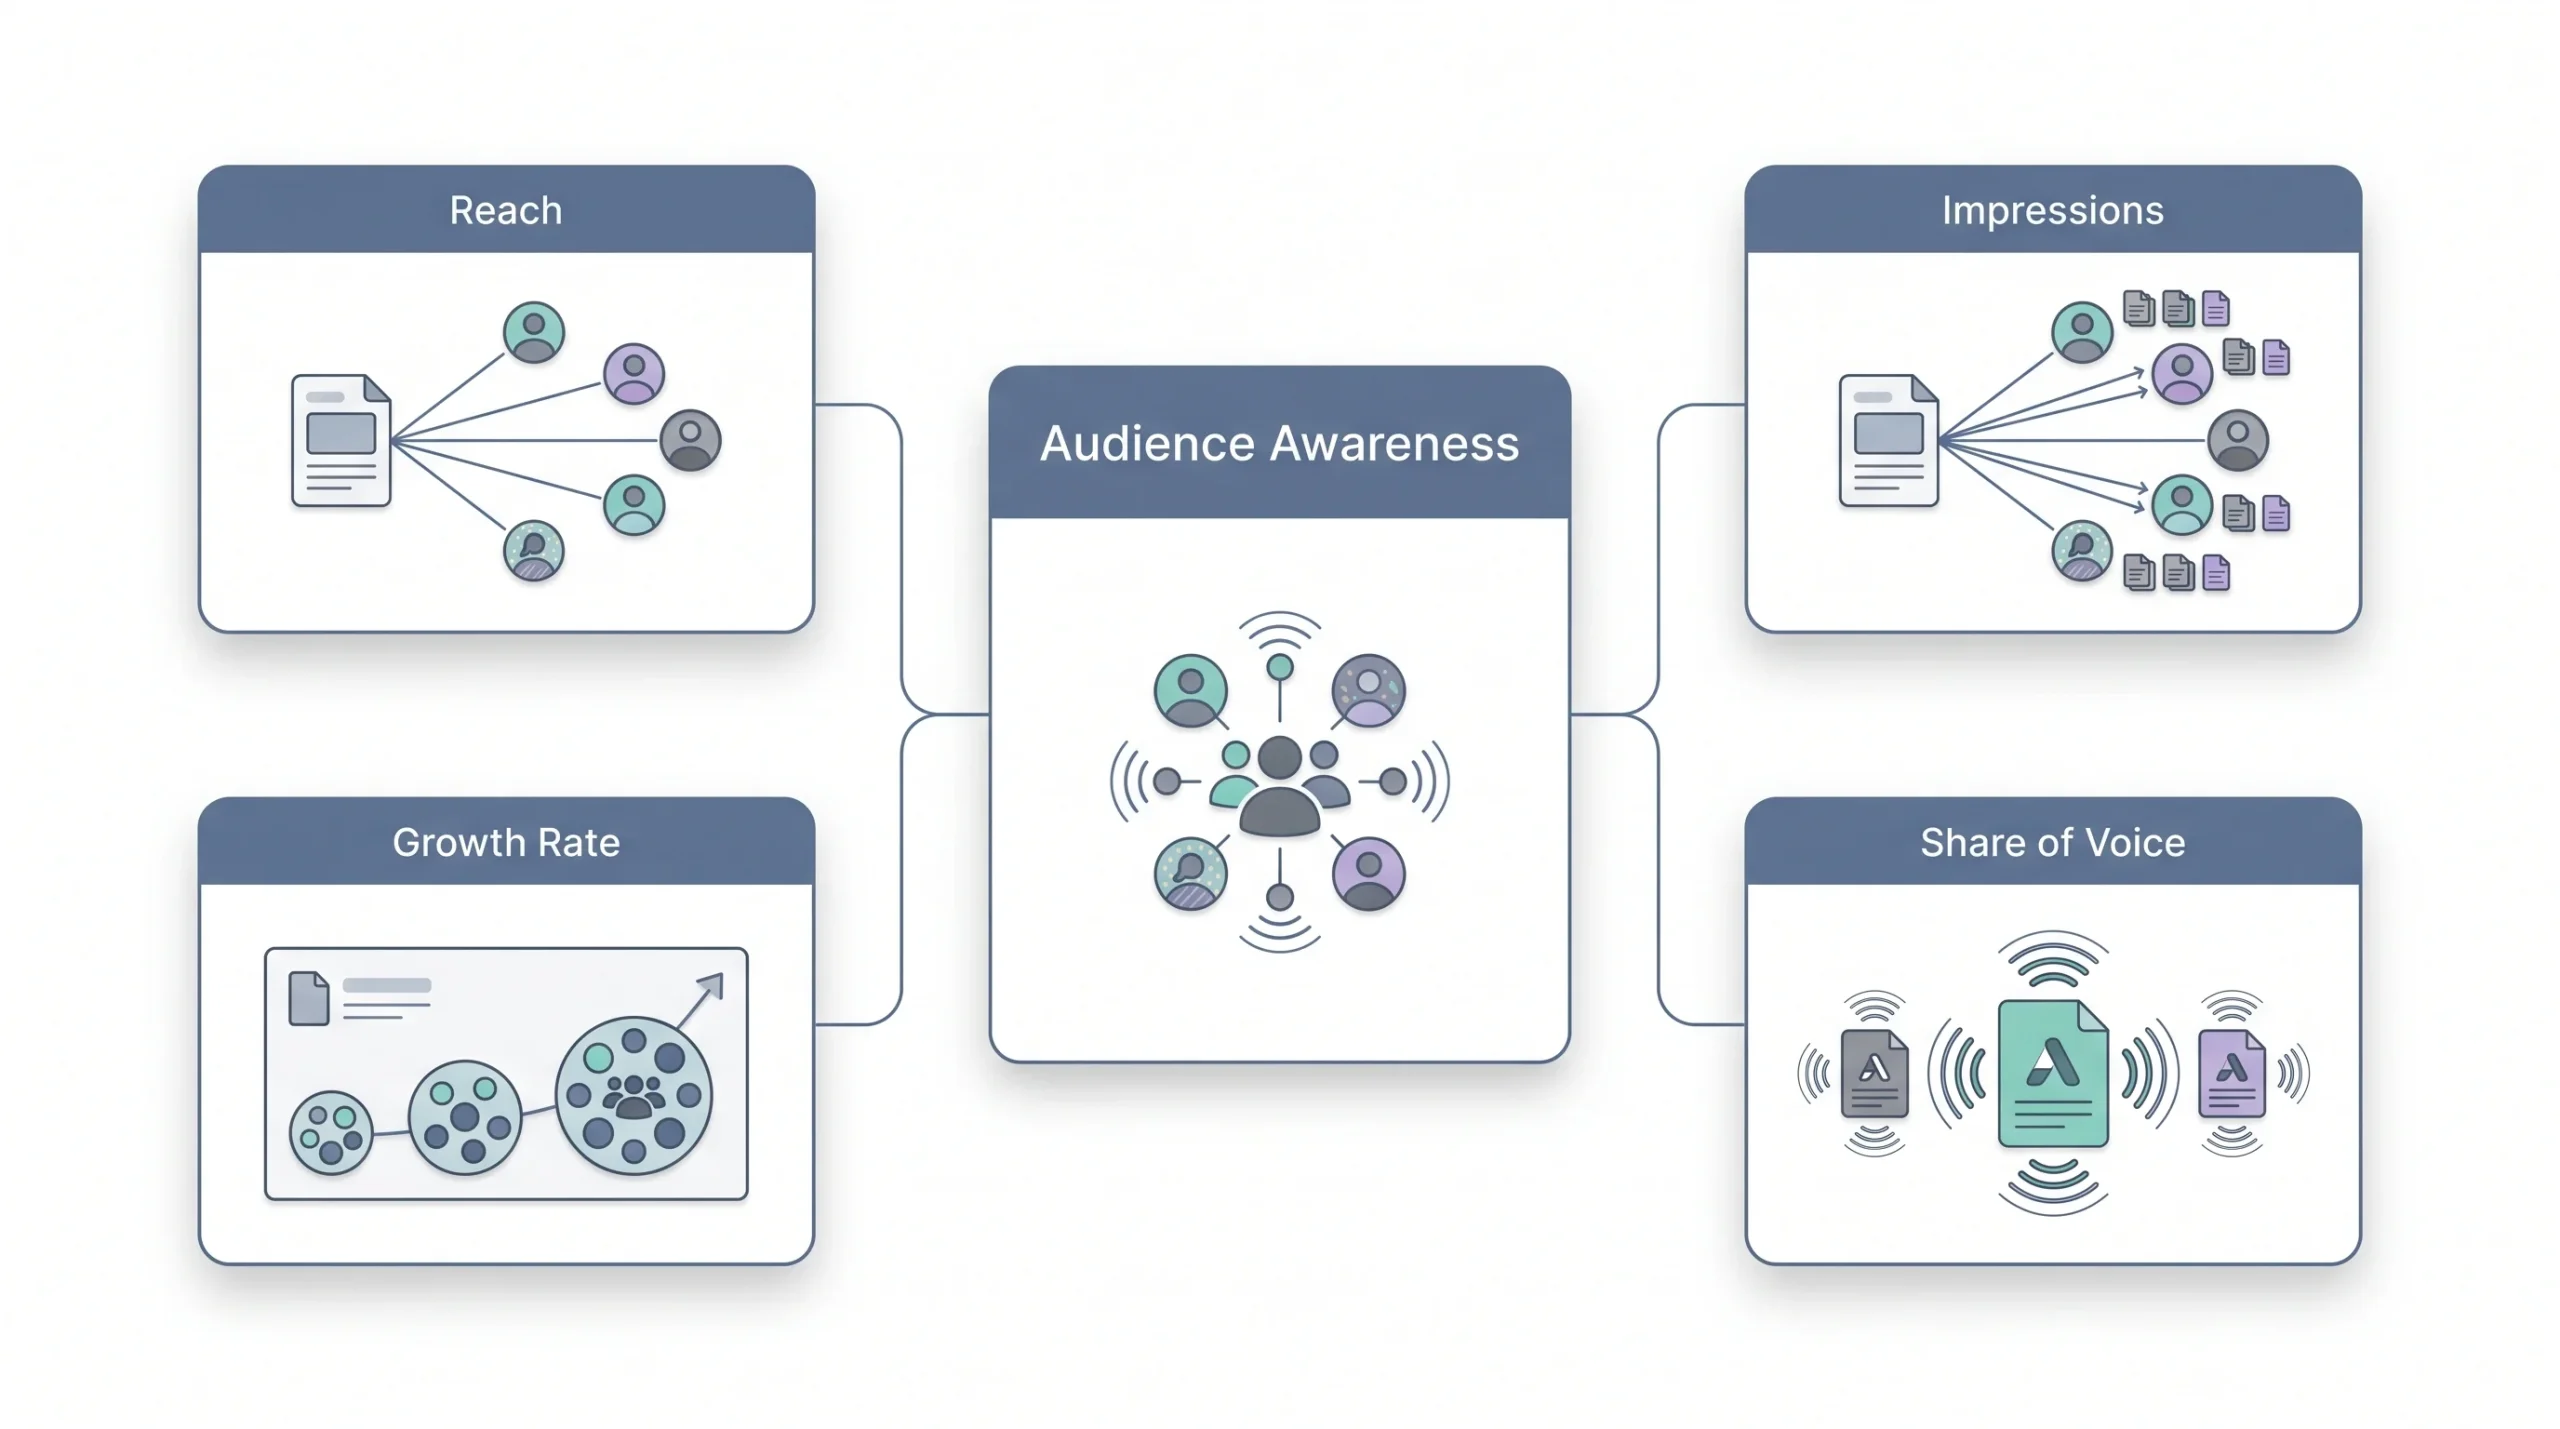
Reach and impressions get confused constantly, and that mix-up causes real, recurring reporting mistakes, not just a minor semantic slip. Reach counts unique people who saw a piece of content, and each person only counts once no matter how many times they happened to scroll past it during the tracking window. Impressions count total displays instead, so the same person seeing one post three separate times over a week counts as three impressions, not one. Neither number, on its own, says anything about whether the content actually worked. Both of them just describe how far something physically traveled across a platform’s distribution system.
Worth flagging clearly here, because it’s a genuine shift and not just a cosmetic change: Instagram has been moving toward a single “Views” metric that now spans Reels, Stories, and feed posts, replacing the older, separate Impressions and Plays labels that used to exist independently. That’s a real change in how the platform frames what counts as success, and it means pulling historical comparisons across the transition point requires some care, since “Views” and the older “Impressions” metric aren’t measuring identical things underneath. Anyone tracking month-over-month awareness trends on Instagram through this period needs to note where the definition shifted, or the trendline ends up telling a misleading story.
Follower growth rate matters considerably more than raw follower count on its own, because an account with 50,000 followers gaining 200 new ones a month is doing something meaningfully different than an account gaining 2,000 a month, even though the second account might still look smaller in absolute terms. Rate captures momentum. Raw count captures size, and size alone says very little about whether an audience is actually still growing or has quietly plateaued. And share of voice, a brand’s mention volume measured against its direct competitors within the same category, is the one awareness metric that forces a team to look outward instead of endlessly staring at its own numbers in isolation. Most teams skip tracking it entirely, mainly because it takes real effort to pull competitor mention data together, which is precisely why it tends to be worth that effort. A brand can be growing its own reach steadily and still be losing ground relative to competitors who are growing faster, and reach alone will never reveal that.
| Metric | Formula | What counts as “good” | Common mistake |
|---|---|---|---|
| Reach | Unique users who saw content | Depends on account size and goal | Confusing reach with impressions |
| Impressions / Views | Total times content was displayed | Higher isn’t automatically better | Treating it as an engagement signal |
| Follower growth rate | (New followers ÷ total followers) × 100 | Varies by platform and industry | Chasing raw follower count instead of rate |
| Share of voice | Brand mentions ÷ total category mentions | Measured relative to direct competitors | Ignoring competitor benchmarking entirely |
None of these four metrics are things to optimize in isolation, either. A campaign chasing pure reach, with no attention paid to whether that reach converts into engagement downstream, tends to produce exactly what it’s optimized for: a lot of people briefly exposed to content they don’t remember an hour later. Awareness metrics work best as a starting filter, confirming content is even getting in front of people, before asking the harder question of whether it’s doing anything once it gets there.
Engagement Metrics, Explained
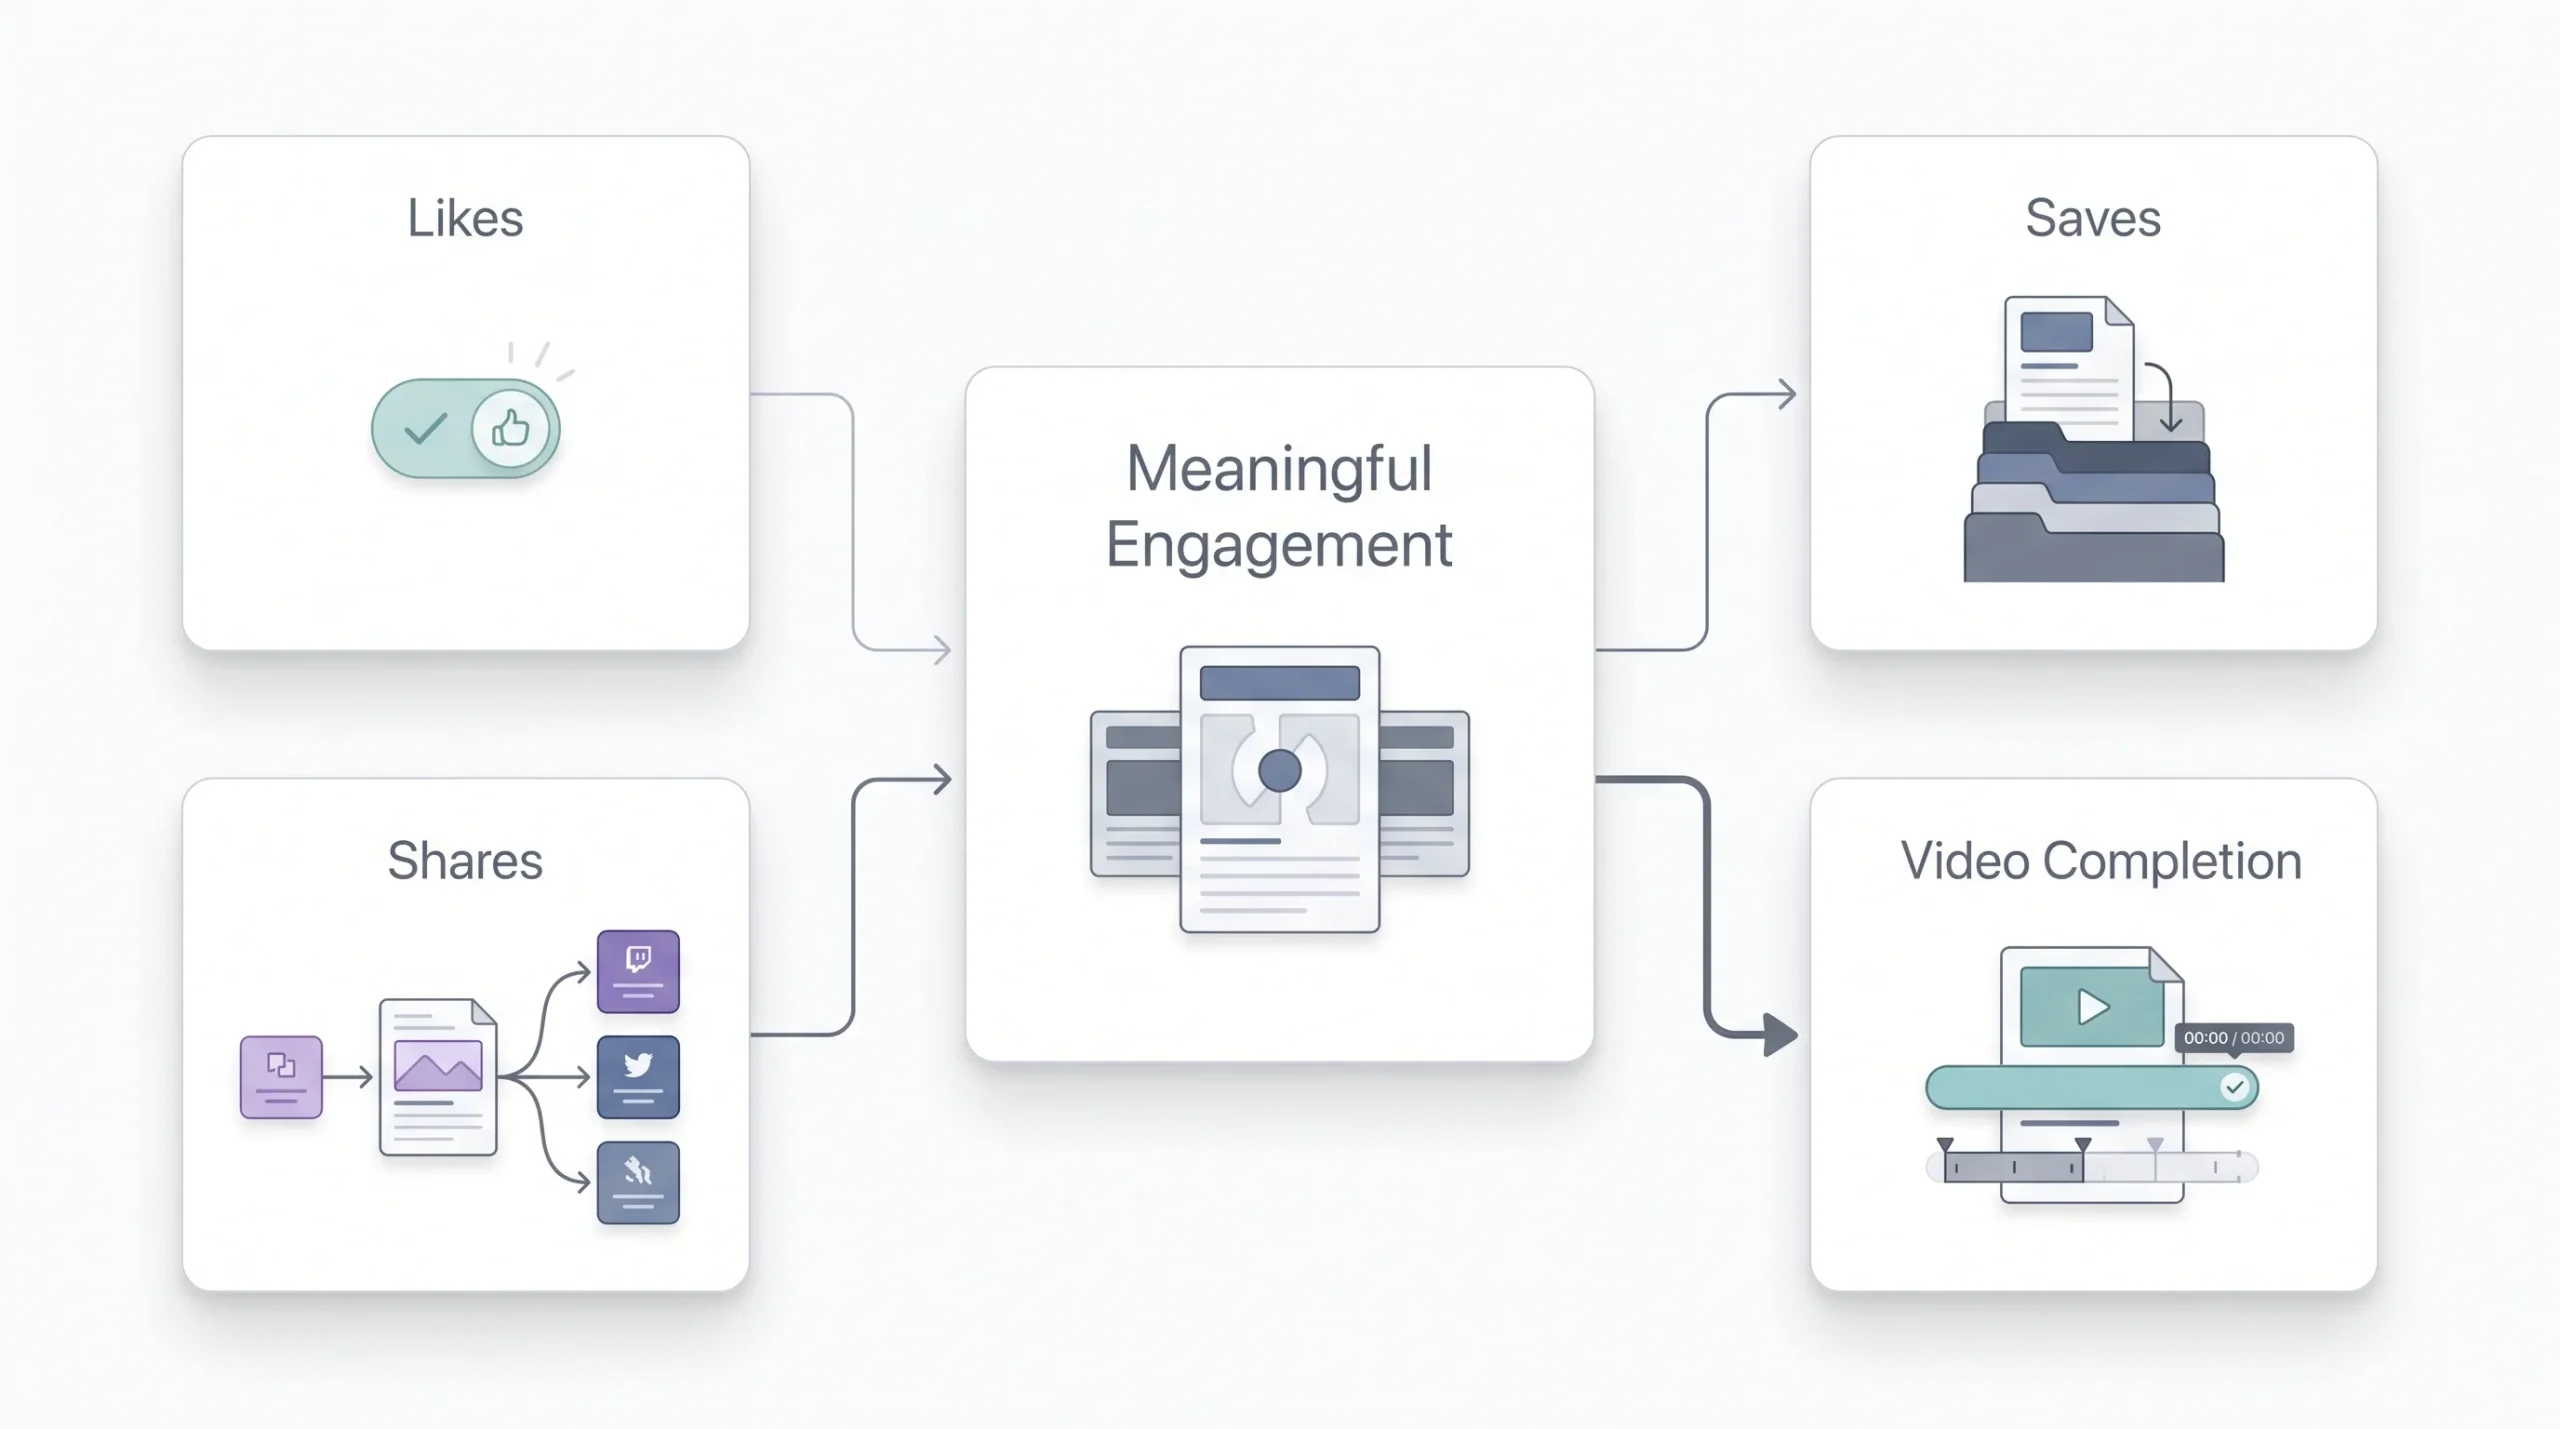
This is where most of the genuinely useful signal actually lives, and it’s also where the most confusion tends to happen, largely because there are two completely different formulas for engagement rate floating around, and people use them interchangeably without ever specifying which one they mean. Engagement rate by reach divides total interactions by reach, and it’s generally the better choice when comparing content quality across posts or accounts of different sizes, since it normalizes for how many people actually saw the thing. Engagement rate by followers divides interactions by total follower count instead, and it works better for tracking one account’s consistency over time, since the follower base stays relatively stable between posts. Neither formula is wrong on its own. The actual problem is reporting a number without saying which formula produced it, then comparing that number to a benchmark built on the other formula, which quietly invalidates the whole comparison.
Something worth sitting with for a second here: a like takes almost no real effort. A thumb is already moving across the screen anyway. A save means someone made an active decision that this content was worth being able to find again later, which is a meaningfully bigger ask of someone’s attention. A share means someone was willing to put their own name and reputation next to the content, publicly, in front of their own audience. That’s a considerably bigger ask than either a like or a save. This is exactly why saves and shares carry more genuine weight than raw like counts when the actual question being asked is whether content landed with people, rather than simply being glanced at and scrolled past. A post sitting at 200 saves alongside a handful of specific, real comments is very often doing more for a brand’s actual goals than one sitting at 3,000 quick likes and total silence in the comments otherwise.
| Metric | Formula | Best used for |
|---|---|---|
| Engagement rate (by reach) | (Total interactions ÷ reach) × 100 | Comparing content quality regardless of audience size |
| Engagement rate (by followers) | (Total interactions ÷ followers) × 100 | Tracking consistency over time on one account |
| Save rate | Saves ÷ reach | Identifying “reference” content worth repurposing |
| Share/amplification rate | Shares ÷ reach | Spotting content with organic distribution potential |
| Video completion rate | Full views ÷ total video starts | Judging whether video length and hook are working |
Watch saves and shares before watching likes. Likes are a reflex. Saves and shares are a decision.
Video completion rate deserves a bit more attention than it usually gets, because it’s one of the clearest signals available for whether a specific creative choice, the hook in the first few seconds, the pacing through the middle, the length of the whole thing, is actually working or actively pushing people away. A video with strong reach but a completion rate that falls off a cliff in the first five seconds isn’t a distribution problem. It’s a creative problem, and no amount of extra ad spend behind that same video fixes what’s wrong with the opening hook itself.
Now, about “what’s a good engagement rate,” because this question comes up constantly and honestly deserves a more careful answer than most sources give it. A lot of published benchmarks flatly contradict each other, and it’s worth saying that out loud rather than pretending there’s one single clean number everyone should be chasing. Different tracking firms use different formulas, different sample sizes, different date ranges, and sometimes even different definitions of what counts as an “interaction,” so two entirely credible sources can report meaningfully different averages for the exact same platform in the exact same year. Socialinsider’s 2026 benchmark report, built from an analysis of roughly 70 million posts, puts TikTok around 3.70% engagement, Instagram around 0.48%, Facebook around 0.15%, and X around 0.12%. Hootsuite’s cross-industry benchmark data from around the same period tells a noticeably different story, putting Instagram closer to 3.5%, LinkedIn around 3.4%, TikTok around 1.5%, and Facebook around 1.3%. Both reports are legitimate, methodologically sound work. They simply measure things differently, use different formulas, and pull from different underlying samples.
The honest takeaway here isn’t “here’s the exact number to hit before a report counts as good.” It’s this instead: don’t grab a single benchmark off the internet and treat it as gospel truth for every account, every industry, every situation. Pick one credible source, use its formula consistently every single time, and track a trendline against that same source over months, not a single snapshot. A steadily rising line, measured consistently, matters far more in practice than matching some external number down to the decimal.
| Platform | Range seen across recent benchmark reports | Notes |
|---|---|---|
| Roughly 3–6% depending on source | Carousels and native documents tend to outperform video and links | |
| TikTok | Roughly 1.5–3.7% depending on source | Algorithm favors watch time over follower count |
| Roughly 0.5–3.5% depending on source | Wide variance; format matters more than almost any other platform | |
| Roughly 0.15–1.3% depending on source | Organic reach is structurally low, paid usually needed alongside it | |
| X | Below 0.2% in most recent reports | Lowest baseline of the major platforms |
Click and Traffic Metrics, Explained
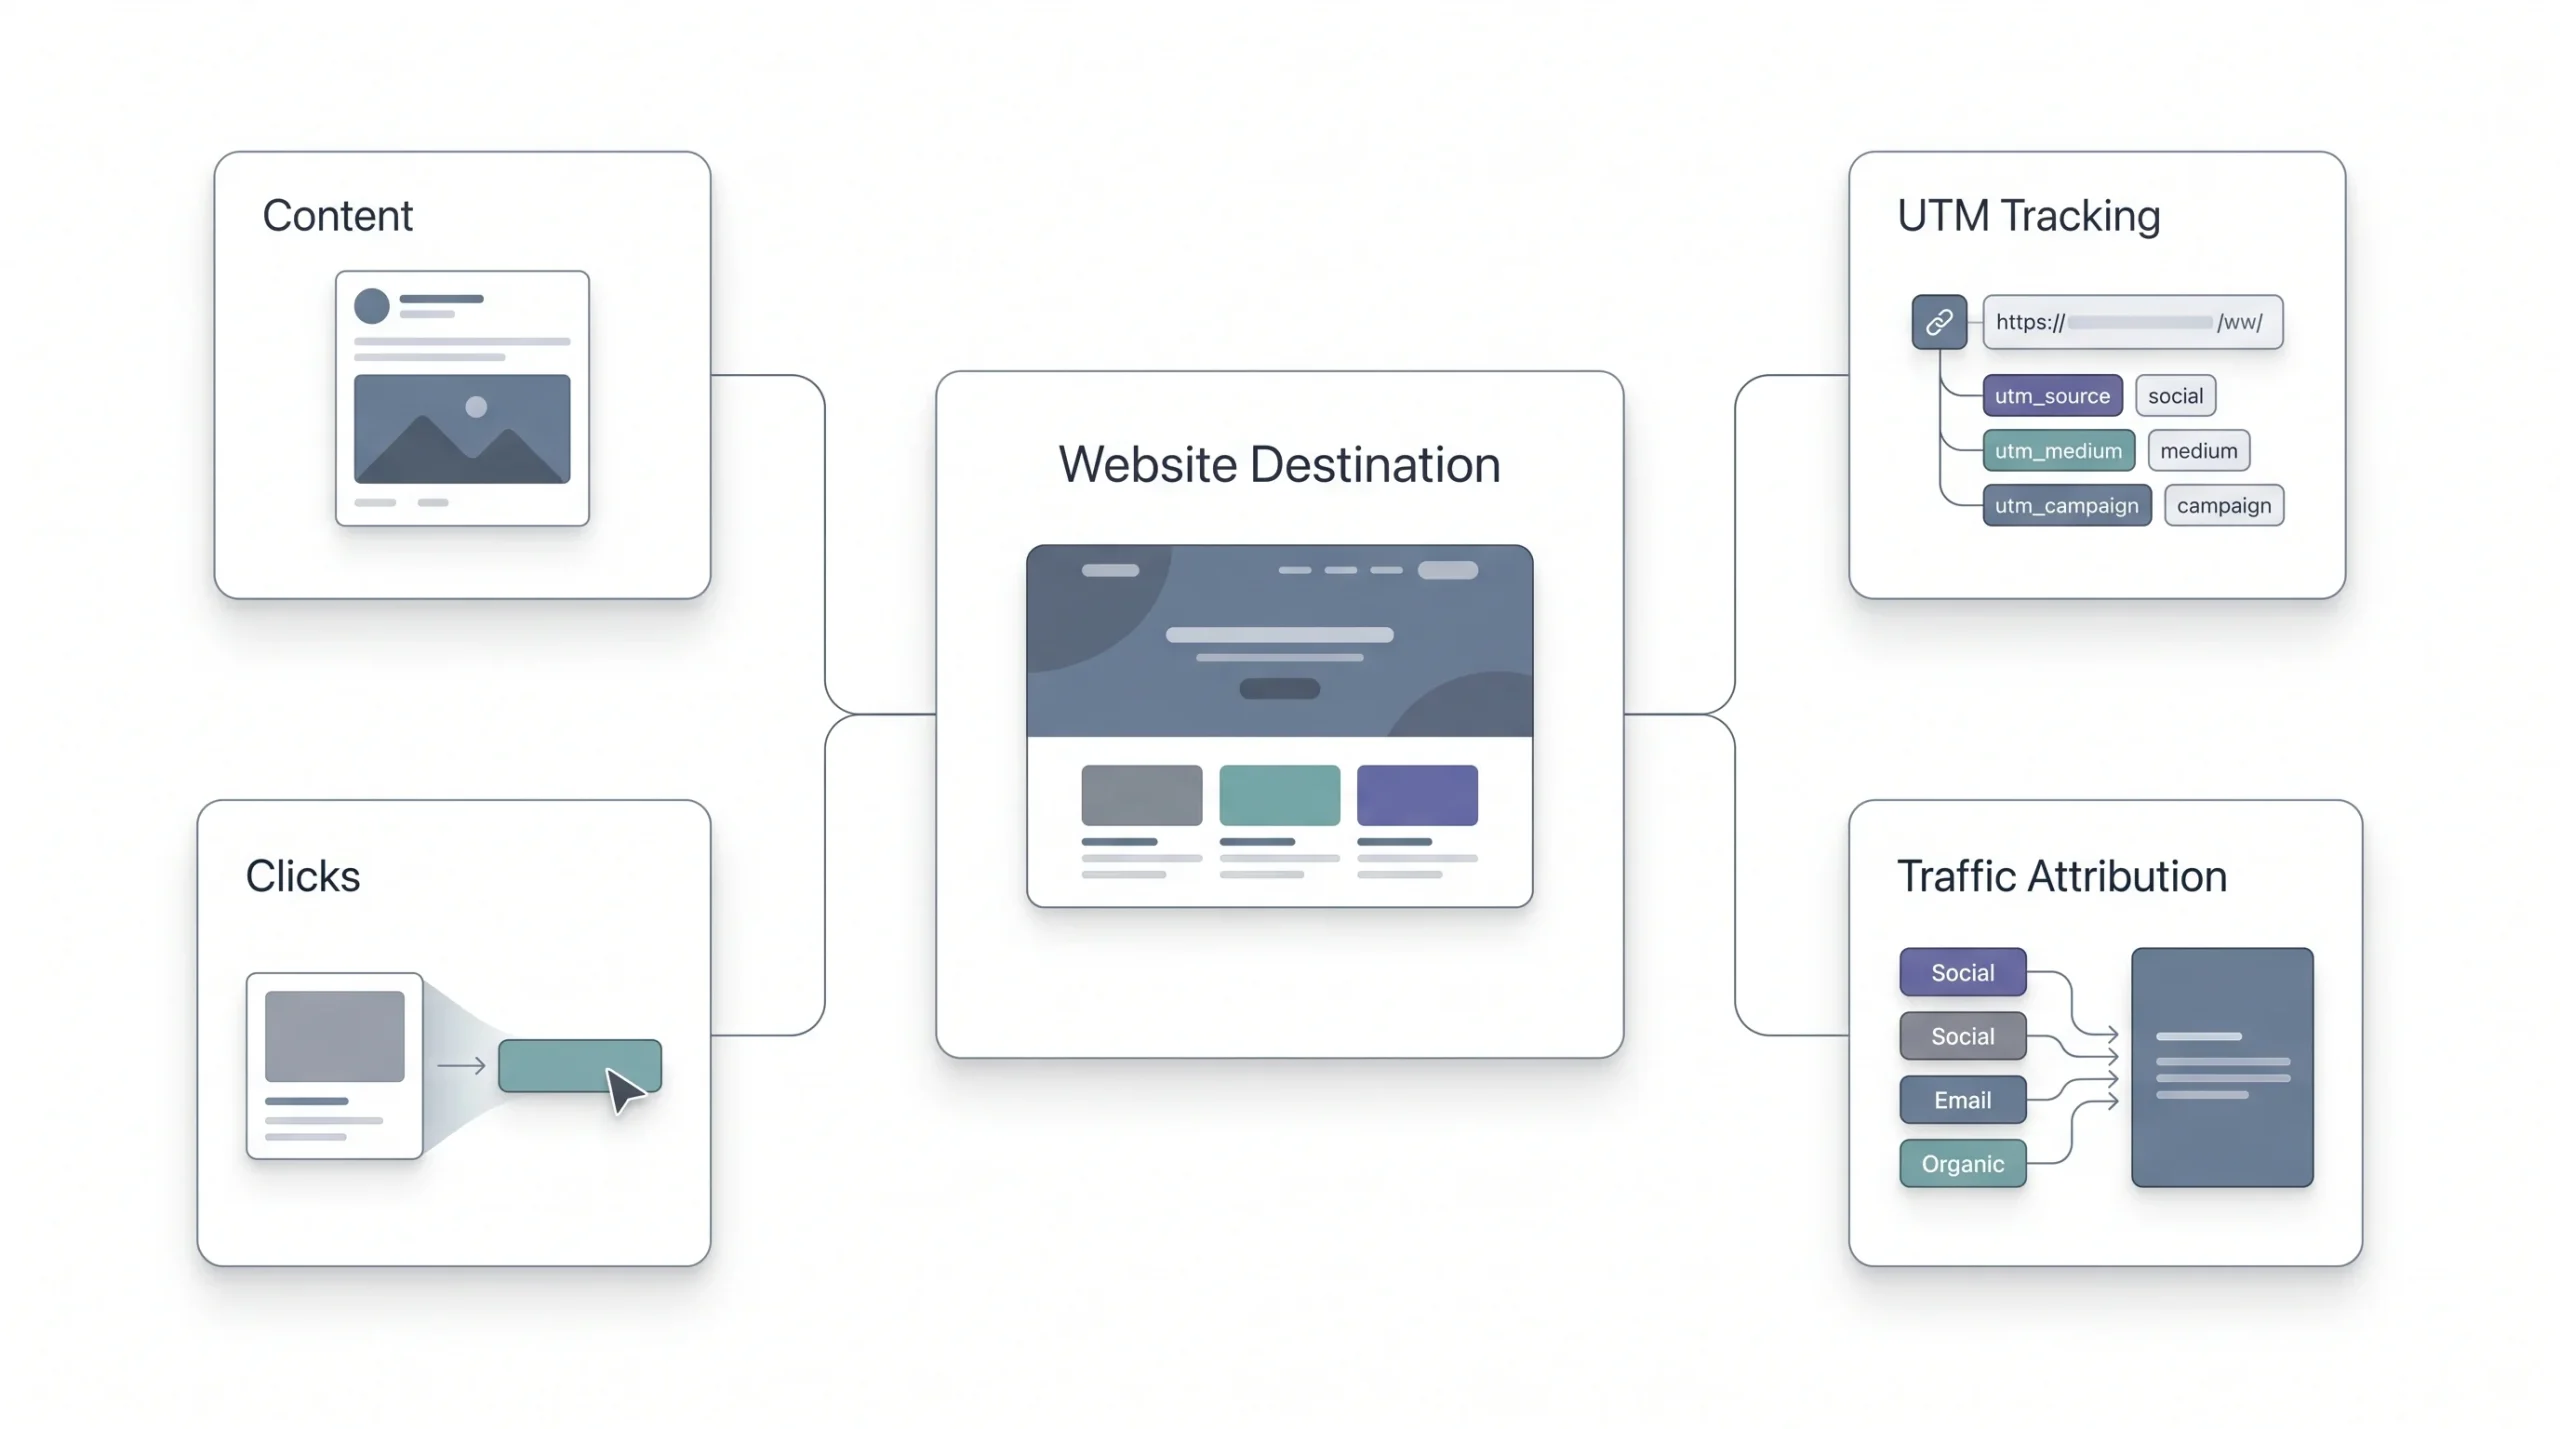
Everything covered so far lives entirely on-platform. CTR and link clicks are where social media starts pointing somewhere else, usually a website, a landing page, a product page, and that shift is exactly why these two metrics matter most whenever the actual goal is traffic or conversions rather than pure visibility or brand recall. Click-through rate divides total clicks by impressions and multiplies by 100, and it answers a very specific, practical question: out of everyone who saw this piece of content, how many of them cared enough to actually act on it and click through. A post can post strong reach numbers, a genuinely healthy engagement rate, plenty of comments and saves, and still fall completely flat here, which usually points to content that resonated emotionally but paired with a call to action that simply wasn’t compelling enough to get someone to leave the platform they were already comfortably scrolling through.
Raw link clicks matter too, and they’re best read alongside CTR rather than as a replacement for it, since a high click count on a post with enormous reach can still represent a mediocre click-through rate once the two numbers get compared properly. But none of this data connects back to actual business outcomes without consistent UTM tracking sitting underneath it. A UTM parameter is a short tag appended to the end of any shared link that tells Google Analytics exactly where a given visitor came from, which platform sent them, which specific campaign, sometimes even which individual post drove the click. Skip the tagging, even occasionally, and there’s genuinely no reliable way to prove social sent anyone anywhere real. The traffic either shows up in GA4 lumped into a vague “direct” bucket or gets lost entirely somewhere in the middle, and social ends up looking like it accomplished nothing, even in scenarios where it actually drove a meaningful number of real site visits.
| Metric | Formula | Signals |
|---|---|---|
| CTR | (Clicks ÷ impressions) × 100 | Whether the CTA or copy is compelling enough to act on |
| Link clicks | Raw count | Referral intent, best read alongside CTR |
| Social-attributed traffic | Sessions from social sources in GA4 | Whether social is contributing real site visits |
Getting UTM tagging right isn’t complicated, but it does need to be consistent to actually be useful. Every link shared across every channel, in captions, in bio links, in Stories, on LinkedIn posts, needs the same tagging structure applied every time, using the same naming convention for source, medium, and campaign across the board. A tagging system that’s inconsistent from post to post ends up scattering the same campaign’s traffic across a dozen slightly different labels in GA4, which makes clean reporting nearly impossible even when the underlying data is technically all there.
Conversion and ROI Metrics, Explained
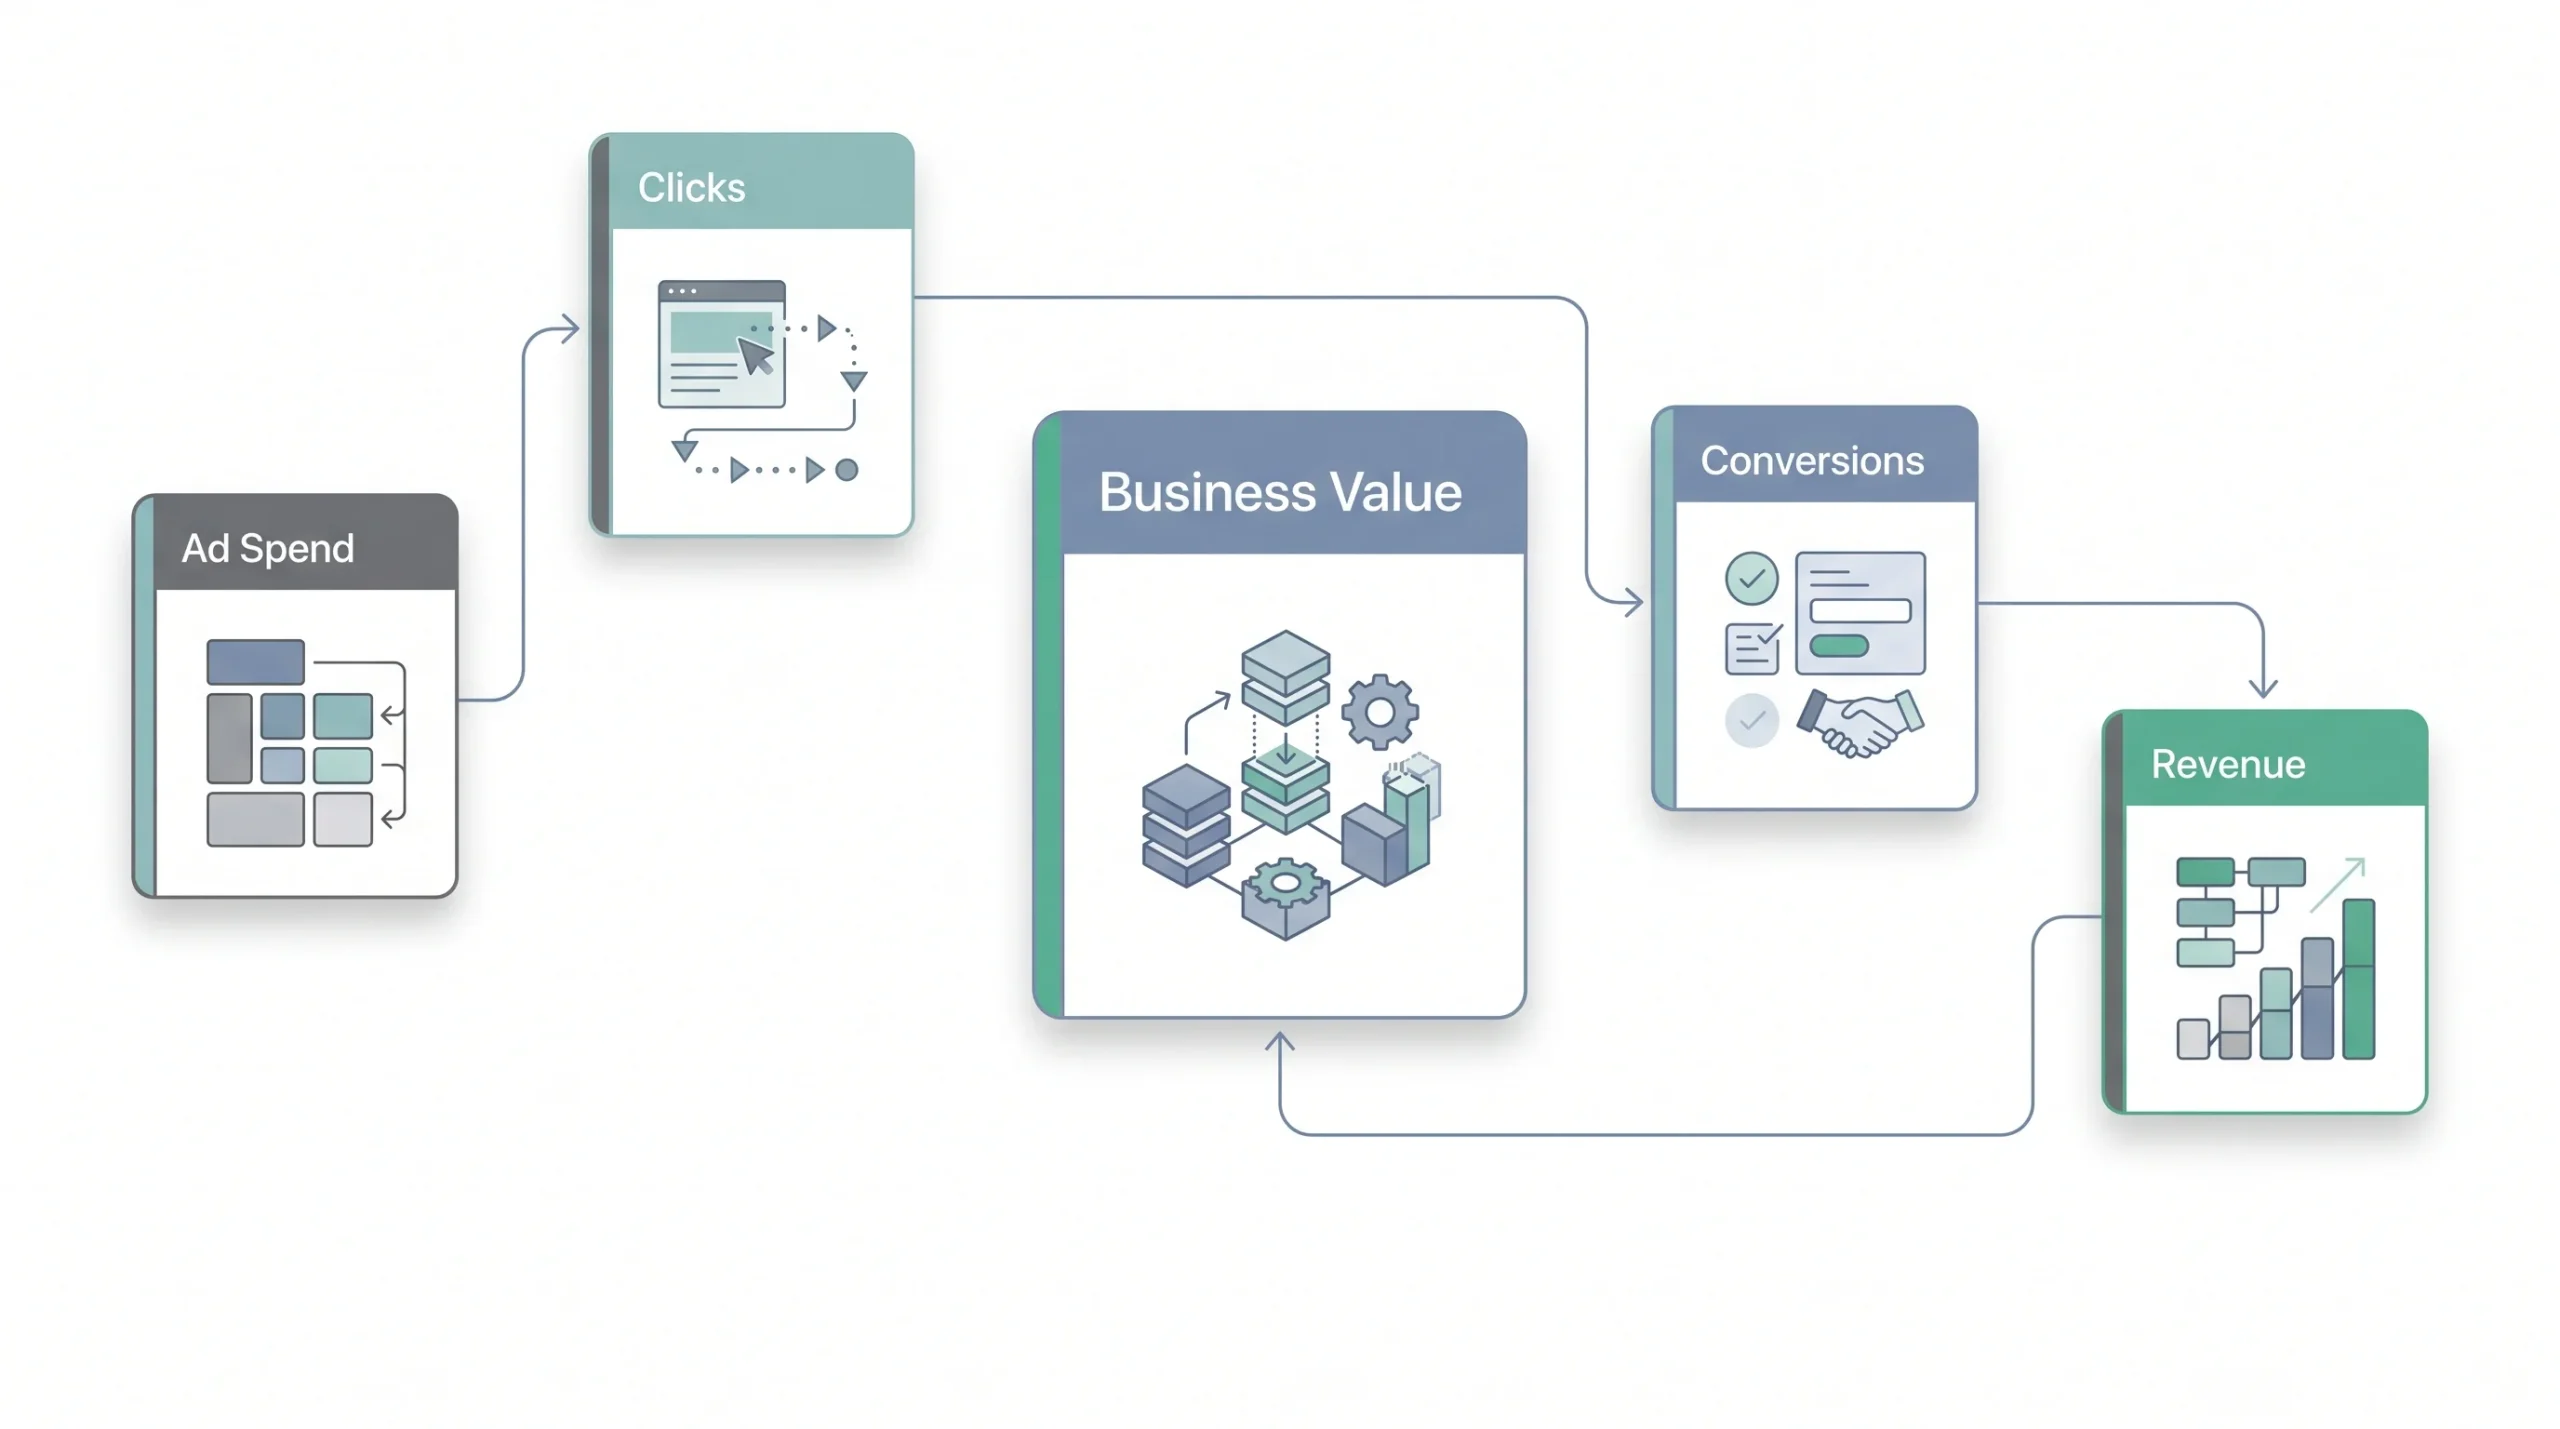
This is the section leadership actually reads closely, because these are the numbers that finally answer the one question that matters most to whoever controls the budget: is this actually making money, or just generating activity that looks good on a slide. CPC and CPM measure how efficiently ad spend is buying attention in the first place, cost per click and cost per thousand impressions respectively. Neither one, taken alone, says anything about whether that purchased attention ever turned into a real result. Conversion rate handles that job instead, dividing total conversions by total clicks to show how many people who bothered to click through actually followed all the way through on the intended action. Cost per result takes total campaign spend and divides it by the number of desired outcomes achieved, which produces a real, concrete cost figure per lead or per sale, instead of a vague, unquantified sense that “the campaign did okay this month.” And ROAS, return on ad spend, is the number that finally closes the entire loop, revenue generated divided by ad spend, multiplied by 100 to express it as a clean percentage.
Here’s a worked example, because formulas sitting on their own in a table rarely stick the way an actual walked-through calculation does. Say a paid social campaign runs with a ₹50,000 total spend over the course of a month. It generates 2,500 clicks across that period, and out of those 2,500 people who clicked through, 75 of them go on to complete an actual purchase, with those 75 purchases together bringing in a total of ₹1,80,000 in revenue attributed back to the campaign.
Conversion rate here works out to 75 divided by 2,500, multiplied by 100, which lands at exactly 3%. That’s a reasonable, believable number for most paid social campaigns, not a spectacular outlier, not a weak result either, just solidly in the middle of the pack for a lot of industries. Cost per result comes out to ₹50,000 divided by 75, which lands at roughly ₹667 per sale. Whether ₹667 counts as a good cost per sale depends entirely on what each individual sale is actually worth to the business, which is exactly where ROAS steps in to close the gap. ROAS here is ₹1,80,000 divided by ₹50,000, multiplied by 100, giving 360%. That means every single rupee spent on the campaign returned ₹3.60 back in revenue. Now leadership has an actual, concrete answer sitting in front of them, instead of a vague impression that “engagement looked pretty healthy this month.”
| Metric | Formula | Answers the question |
|---|---|---|
| CPC | Spend ÷ clicks | How much am I paying per click? |
| CPM | (Spend ÷ impressions) × 1,000 | How much am I paying per 1,000 views? |
| Conversion rate | (Conversions ÷ clicks) × 100 | How many clicks turn into real action? |
| Cost per result | Spend ÷ desired outcomes | What’s the true cost of each lead or sale? |
| ROAS | (Revenue ÷ ad spend) × 100 | Is this spend actually profitable? |
CPC and CPM tell you how efficiently you bought attention. ROAS tells you whether that attention paid you back.
It’s worth pairing ROAS with conversion rate whenever possible rather than reporting either one in isolation, because a strong ROAS built on a very small number of unusually large purchases can hide a genuinely weak conversion rate underneath it, and vice versa, a decent conversion rate can still produce a disappointing ROAS if the average order value driven through the campaign turns out to be low. Reading these two numbers together, rather than picking whichever one looks best that particular month, gives a far more honest picture of what a campaign is actually doing.
Metrics by Platform: What Changes Where
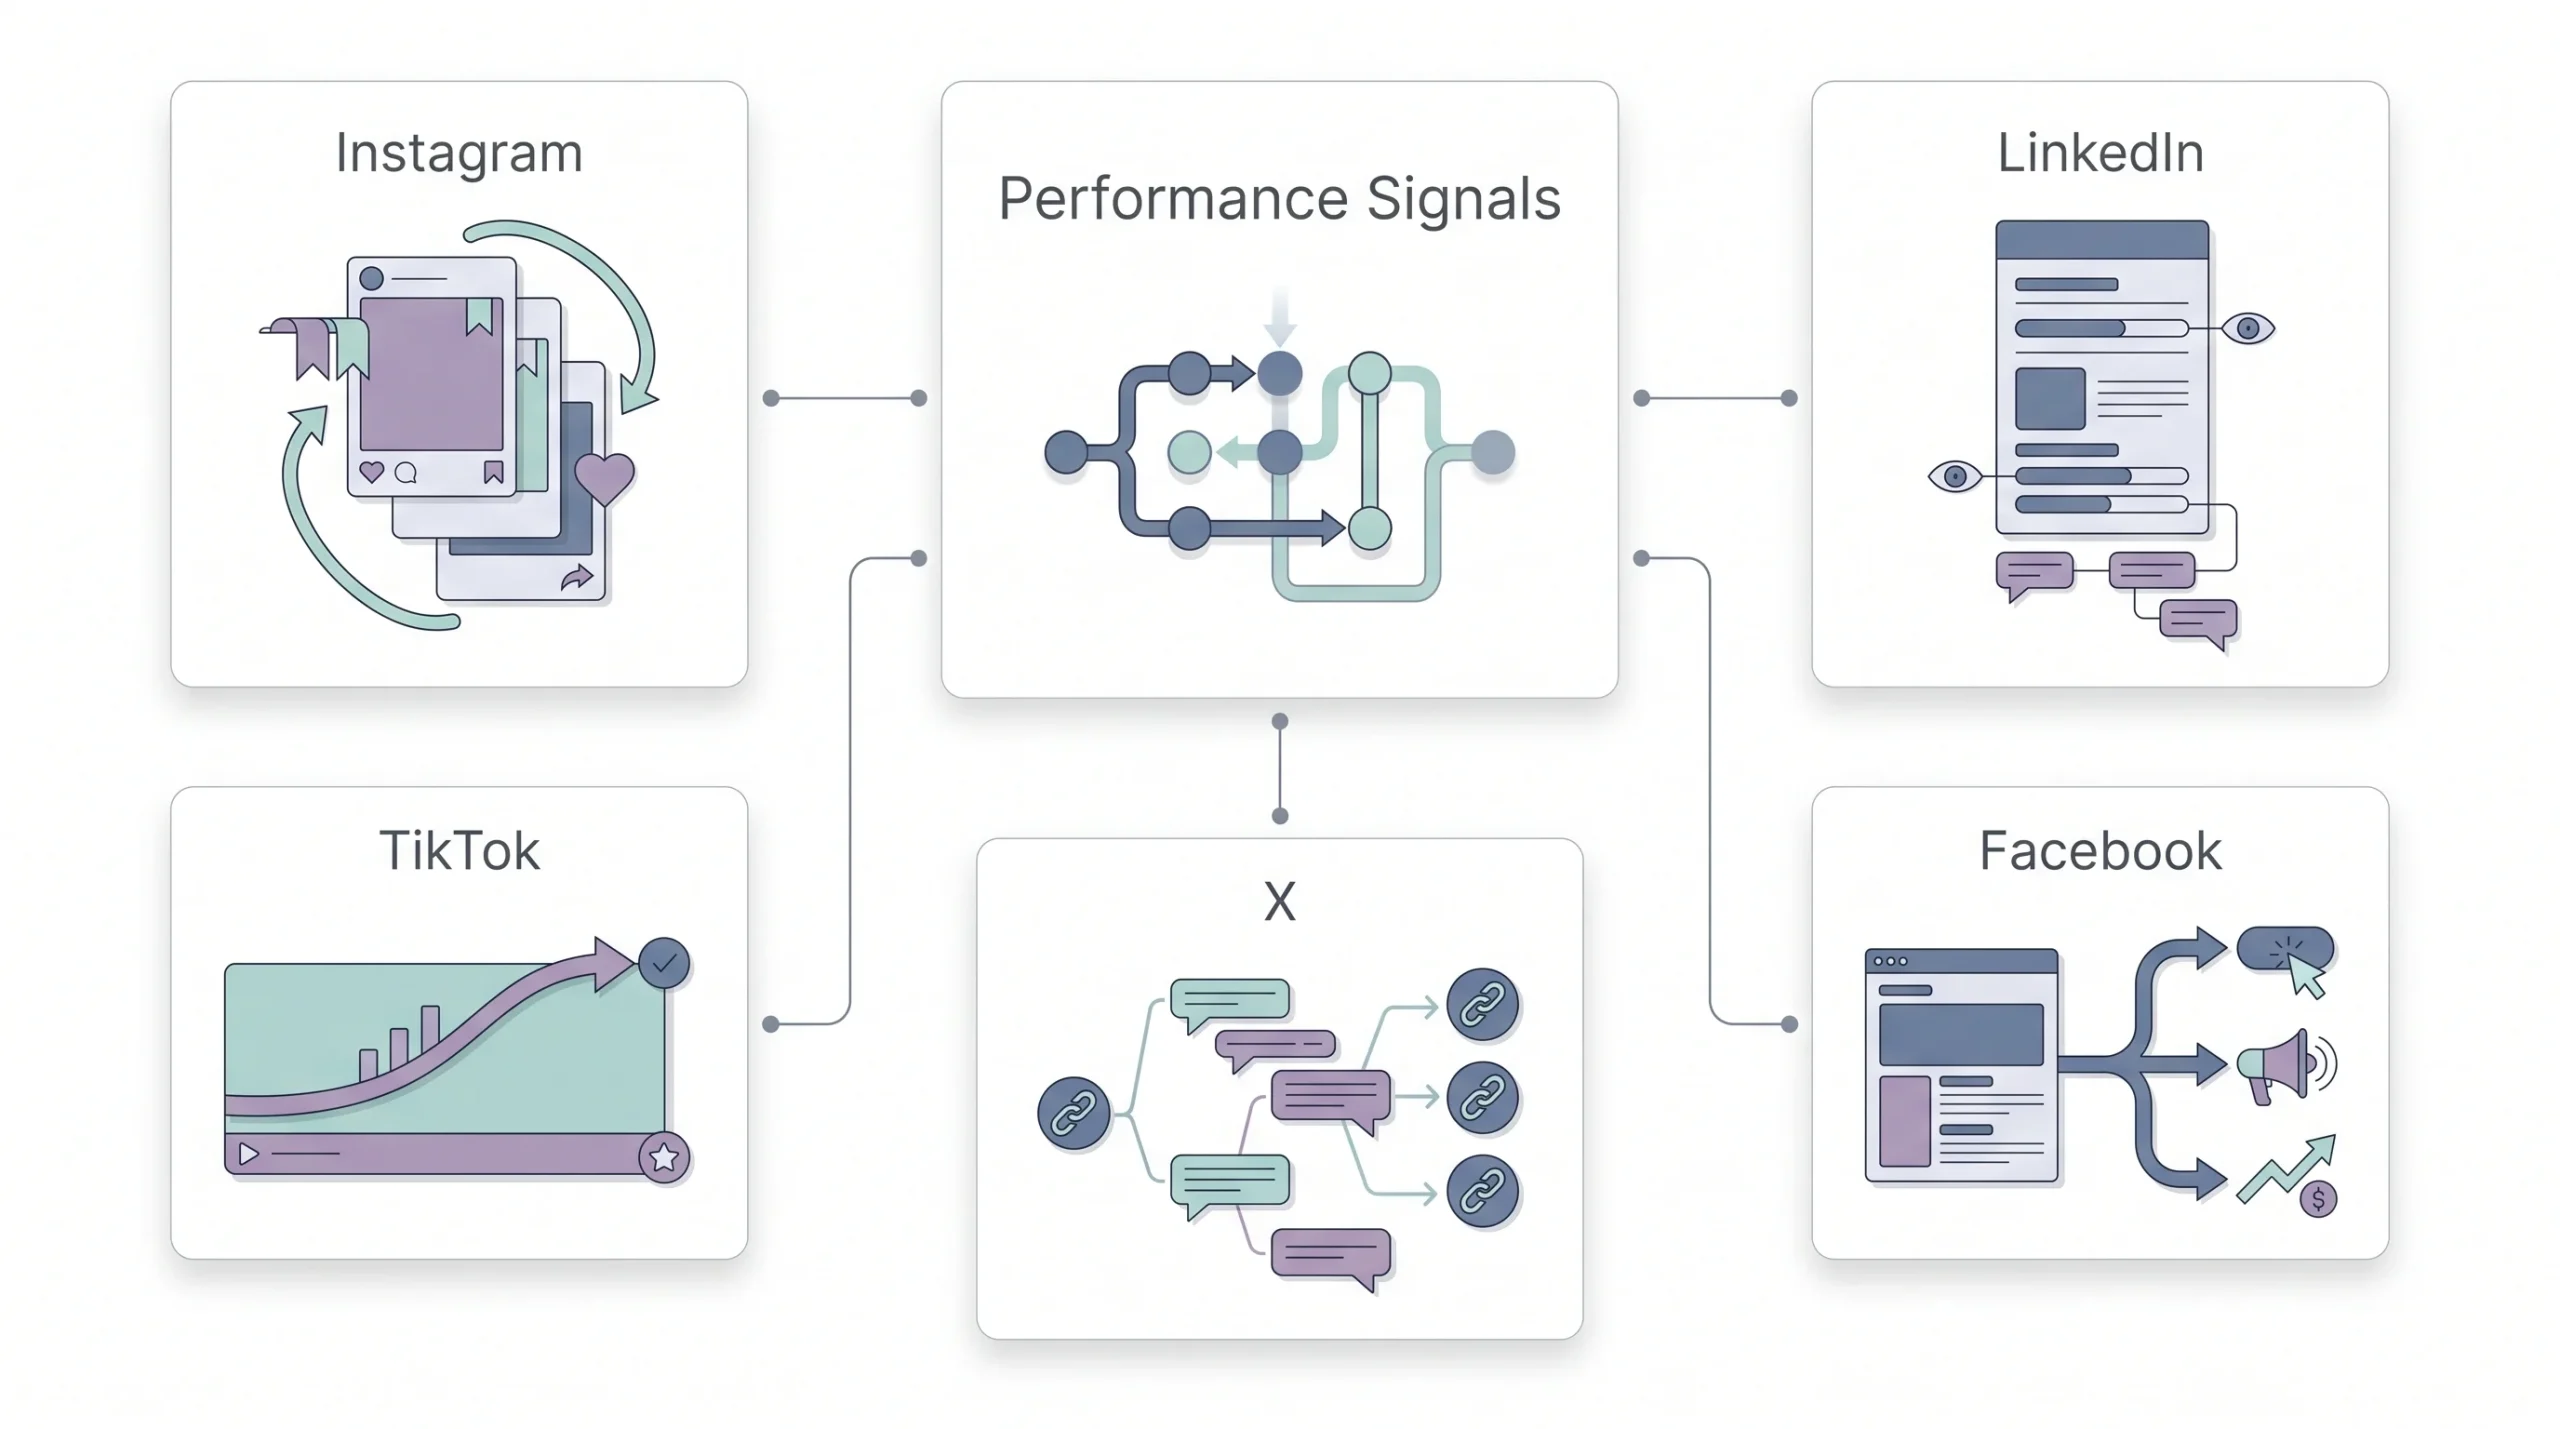
Not every metric means the same thing across every platform, and treating them as fully interchangeable is one of the quieter mistakes that shows up in a lot of cross-platform reporting. The clearest current example is Instagram’s move toward a single “Views” metric spanning Reels, Stories, and feed content, replacing the older split between separate Impressions and Plays labels. That’s a genuine shift in how the platform frames what success looks like, leaning noticeably harder into raw watch behavior over simple display counts, which pushes creators and brands to think more about actual attention held rather than just technical exposure.
LinkedIn works on a different logic entirely. Dwell time, meaning how long someone actually pauses on a post before scrolling past it, carries real weight in how the platform decides what to distribute further, along with document and carousel engagement specifically, which tends to noticeably outperform standard video posts for B2B-focused content in particular. This lines up with how the platform’s audience actually behaves, people scrolling LinkedIn during work hours tend to be looking for something worth their limited attention span, not passive entertainment to fill idle time. TikTok’s entire algorithm, by contrast, is built almost completely around retention, so watch time and completion rate matter more there than likes ever realistically will, no matter how large an account’s follower base happens to be. Facebook sits at something close to the opposite extreme from TikTok. Organic reach on Facebook has been sitting at genuinely low levels for years now, low enough that most brands have effectively shifted to treating it as a paid-first channel, leaning on CTR and ROAS to judge performance rather than expecting organic content alone to carry meaningful weight. X rewards real-time conversation and link clicks over sheer reach, which fits neatly with a platform built fundamentally around immediacy and live discussion rather than long-tail discovery.
| Platform | Metric that matters most | Why |
|---|---|---|
| Views, saves, share rate | Distribution increasingly favors shareable, rewatchable content | |
| Dwell time, comments, document engagement | B2B audiences reward depth over speed | |
| TikTok | Watch time, completion rate | The algorithm is built around retention, not likes |
| Reach, CTR, ROAS | Organic reach is structurally low, paid carries most of the weight | |
| X (Twitter) | Engagement rate, link clicks | Real-time conversation and traffic-driving matter more than reach |
The practical takeaway from all this platform variation is fairly simple, even if it’s easy to lose sight of when juggling five different dashboards at once. A single, universal reporting template applied identically across every platform is going to misrepresent performance on at least a couple of them. Instagram and LinkedIn genuinely are not measuring success the same way, and forcing both into the exact same metric columns on one spreadsheet just because it’s convenient tends to flatten out the differences that actually matter for deciding what to do next on each individual platform.
Tools for Tracking Social Media Analytics
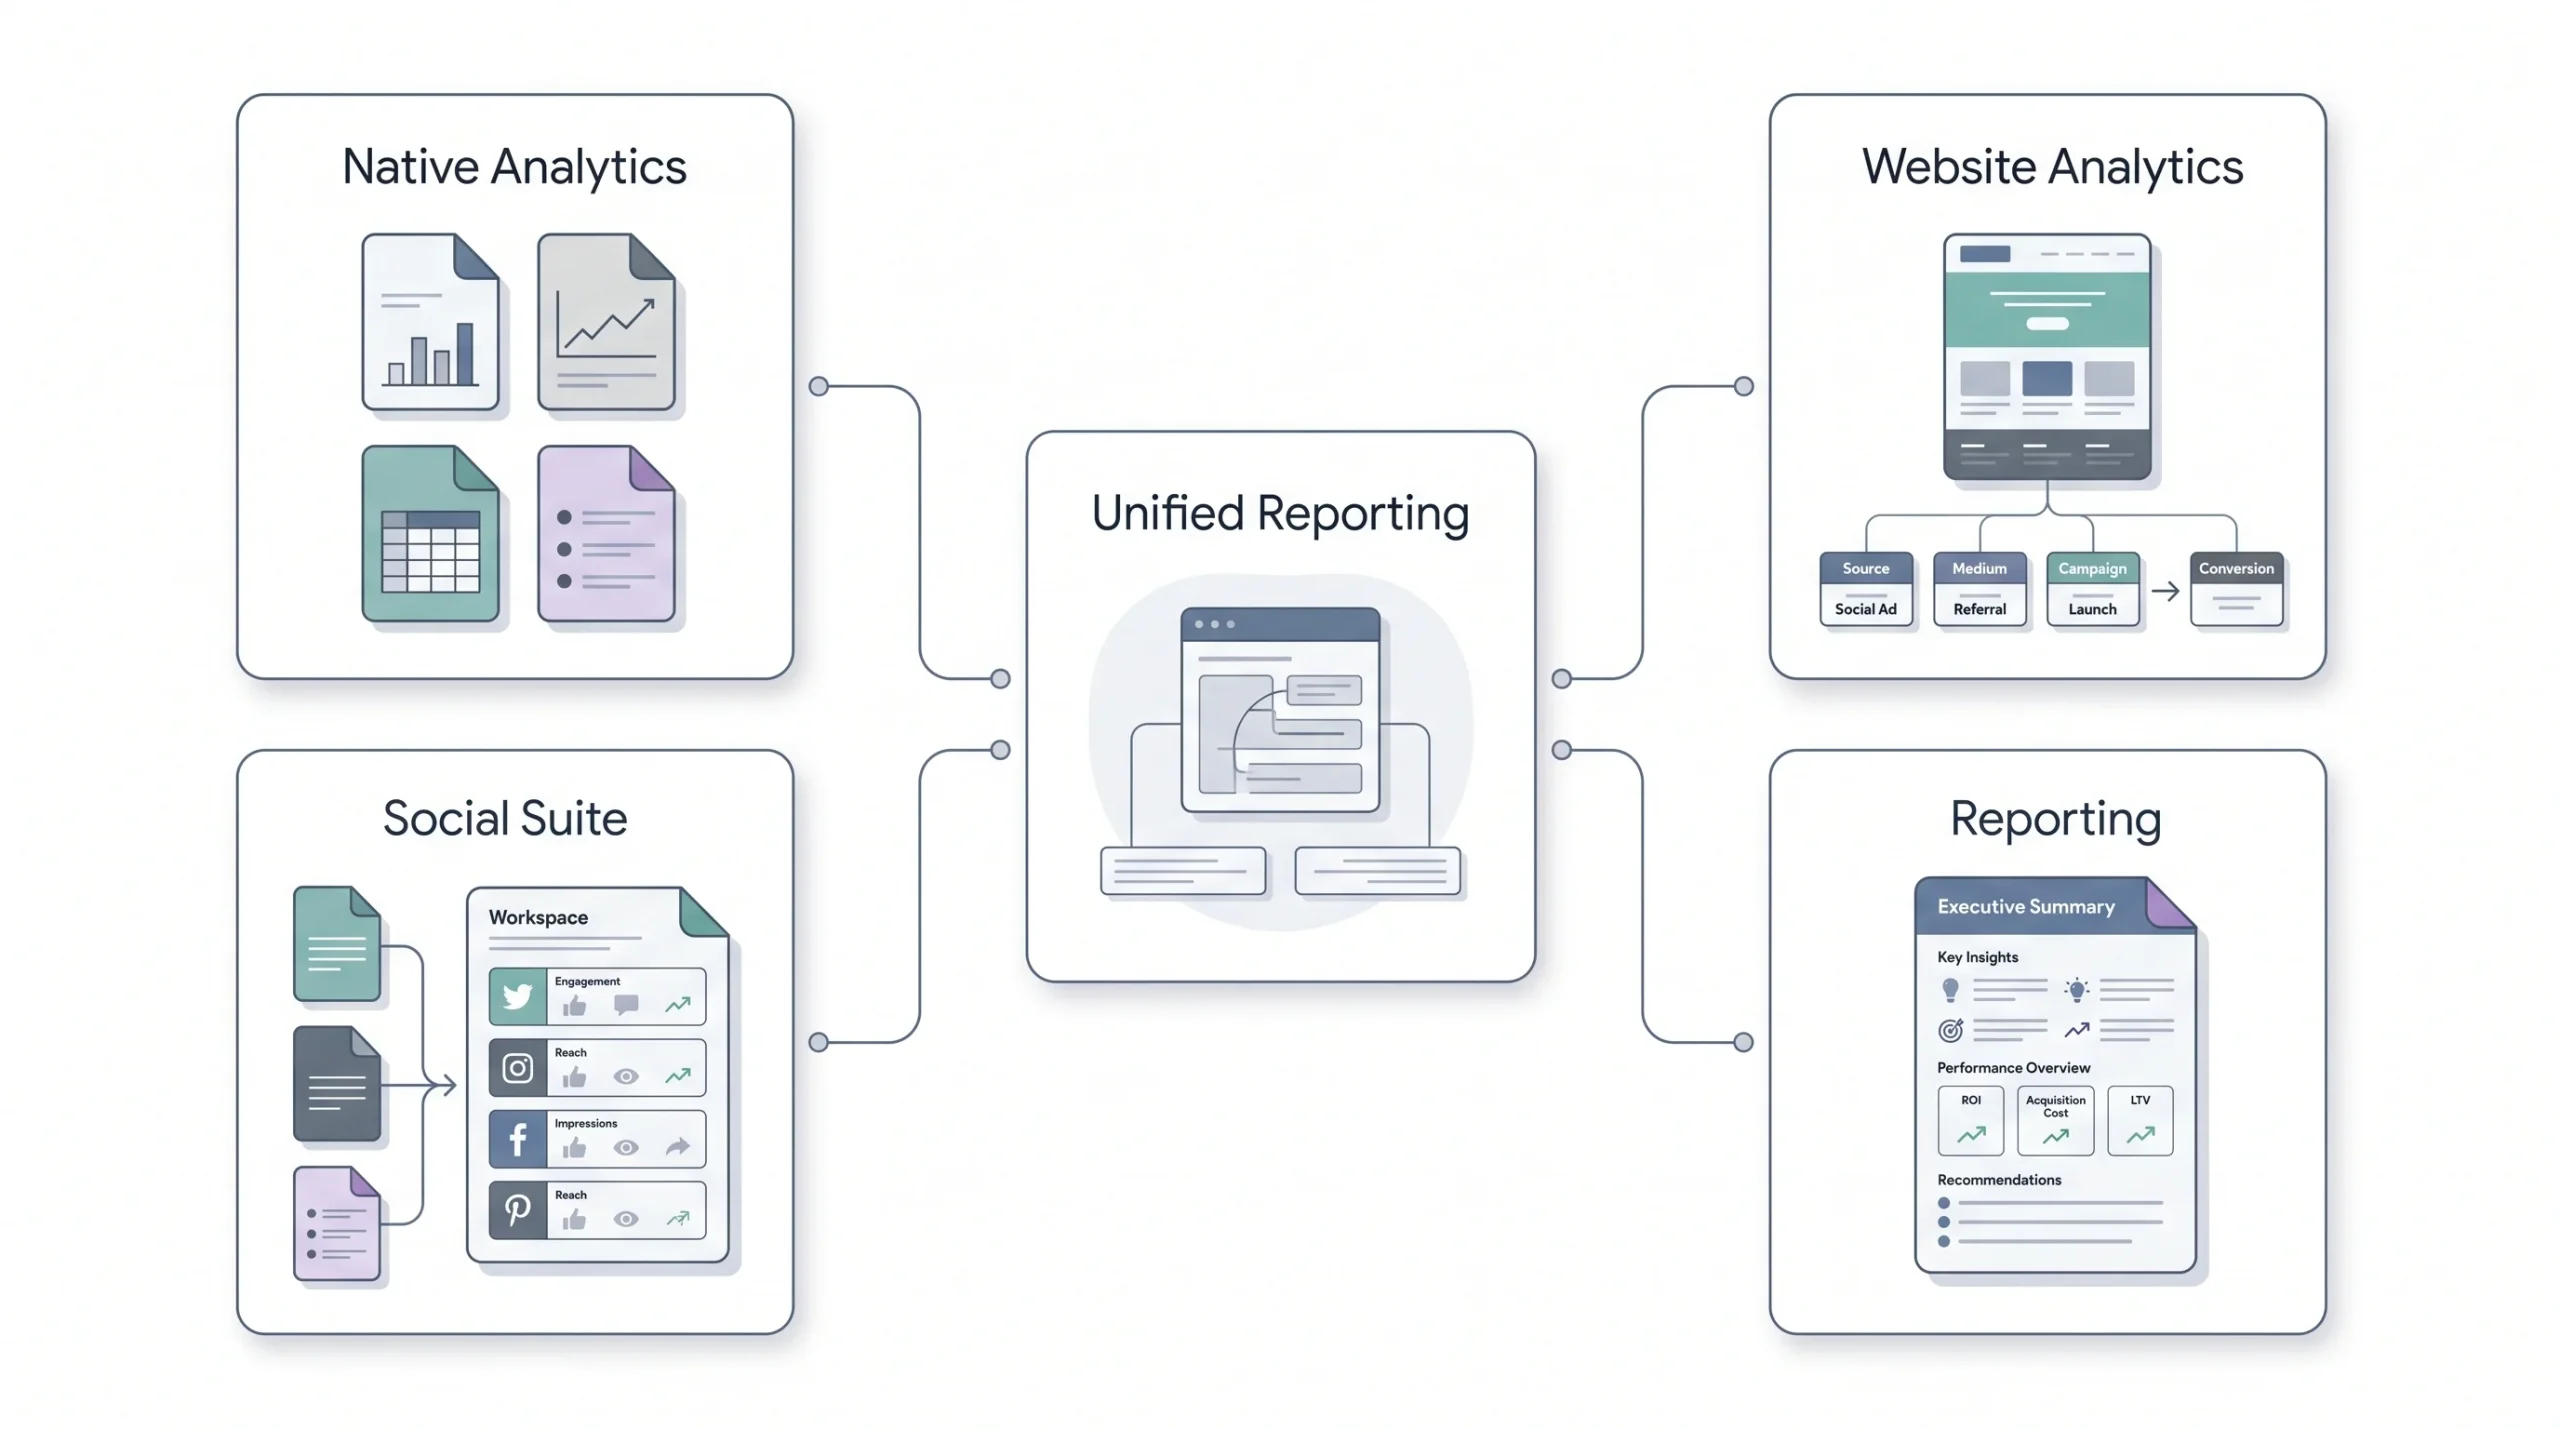
Native analytics inside Meta Business Suite, LinkedIn’s own dashboard, or TikTok’s creator tools work perfectly well for a single channel, and honestly, there’s no real need to pay for anything extra if that’s the entire scope of the operation being managed. The moment a second or third platform gets added into the mix, though, native tools start falling short fairly quickly. There’s no shared view across channels built in anywhere, no built-in competitor visibility to compare against, and pulling together a single monthly report ends up meaning manually copying numbers out of three or four completely separate dashboards into one spreadsheet, every single month, by hand.
That’s precisely the gap third-party social suites exist to fill, tools like Sprout Social, Hootsuite, Metricool, or Socialinsider, all of which consolidate multi-channel data into one unified place and usually layer in competitor benchmarking on top as part of the package. Google Analytics, or GA4 specifically in its current form, handles the one piece none of the social-native tools can really touch on their own, what actually happens after someone clicks through from a post to an actual website. It only works well, though, if UTM tagging has been applied consistently across every shared link beforehand, so it’s genuinely not a plug-and-play fix that works out of the box without any setup effort. And for anyone regularly reporting to a client or presenting to leadership, Looker Studio turns scattered numbers pulled from multiple sources into an actual visual dashboard people want to look at, instead of a dense spreadsheet nobody on the receiving end particularly wants to open.
| Tool type | Best for | Limitation |
|---|---|---|
| Native analytics (Meta, LinkedIn, TikTok) | Single-channel accounts, free | No cross-platform view, no competitor data |
| Third-party social suites | Multi-channel management and reporting | Paid, has a learning curve |
| Google Analytics / GA4 | On-site conversion and traffic attribution | Needs consistent UTM tagging to work well |
| Looker Studio / dashboards | Stakeholder-ready visual reporting | Requires setup time upfront |
Choosing between these isn’t really about picking the single “best” tool in some abstract sense, it’s about matching the tool to the actual scope of what’s being managed. A solo creator running one Instagram account doesn’t need a paid multi-channel suite. An agency managing fifteen client accounts across four platforms absolutely does, because the manual alternative, copying numbers by hand every week across that many accounts, simply doesn’t scale past a certain point, no matter how disciplined the team running it happens to be.
How to Build a Social Media Report That Actually Gets Read
Most reports fail before a single number ever gets pulled into them, because nobody paused first to ask who’s actually going to read this specific report and what decision it’s meant to support once they do. A weekly internal check-in built for the content team looks nothing like a quarterly executive review built for leadership, and treating both the same way, using the same template, the same metrics, the same depth, is exactly how reports end up either too shallow to be genuinely useful or too bloated for anyone busy to actually finish reading start to finish.
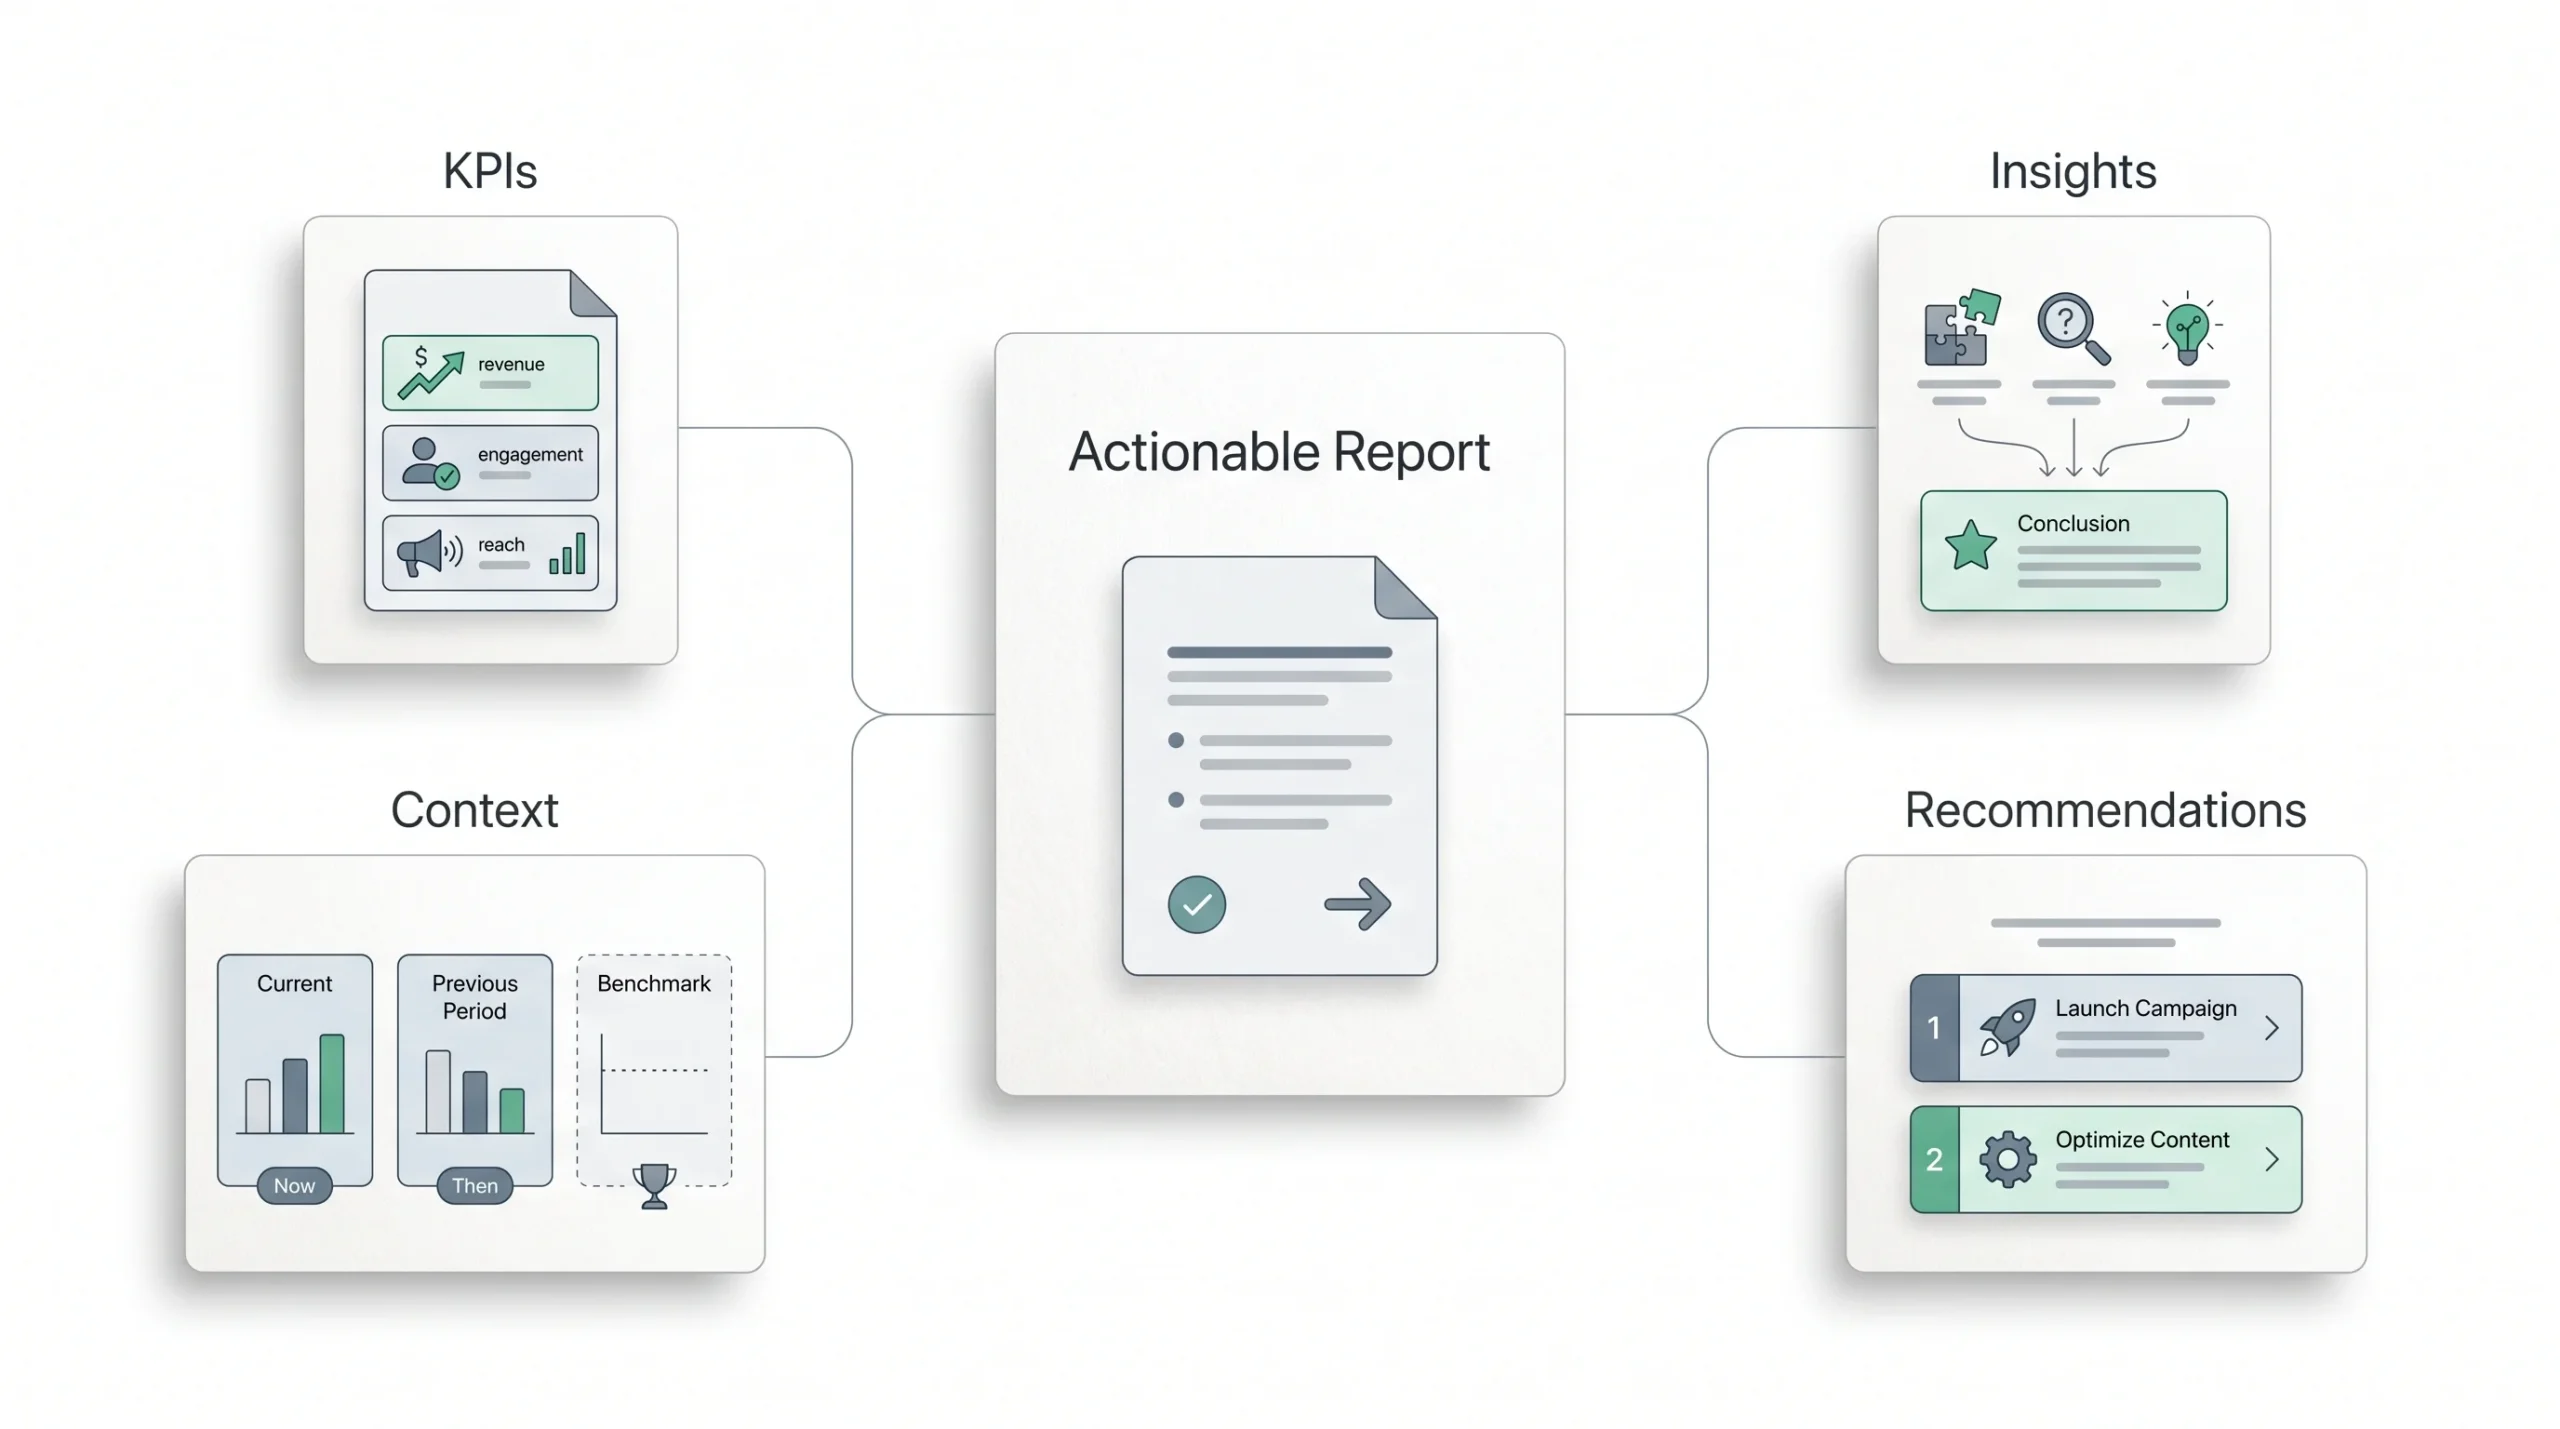
Start there, every time, before pulling a single data point. Figure out the audience and the specific decision that report needs to support first. Then pick four to six KPIs tied directly to the actual goal relevant to that particular report, not every metric technically available inside whichever dashboard happens to be open. A report attempting to cover awareness, engagement, and conversion all at once, with equal weight given to each, usually ends up saying nothing clearly to anyone, because it’s trying to answer three different questions simultaneously in one document. Set a consistent time frame from the start and stick to it rigidly, since comparing a 30-day window one month against a 45-day window the next quietly wrecks any trend analysis sitting underneath the report, even when nobody notices the inconsistency at first glance. Pull data from native platform analytics alongside GA4 rather than leaning on just one source in isolation, because platform dashboards show what happened on-platform specifically, while GA4 shows what happened after someone actually left that platform, and a genuinely full picture needs both halves of that story sitting side by side. Add context wherever it’s reasonably possible to do so, how this period compares against the last one, how the numbers stack up against a chosen benchmark, a line or two of plain language explaining anything unusual that shows up in the data. And close, every time, with one or two clear, specific recommendations. A report that ends on a bare number instead of a suggested action has essentially just handed the reader homework they probably aren’t going to do on their own time.
| Report type | Frequency | Audience |
|---|---|---|
| Internal check-in | Weekly | Social or marketing team |
| Platform performance review | Monthly | Marketing lead |
| Executive or ROI report | Quarterly | Leadership, clients |
A report full of numbers with no recommendation isn’t a report. It’s a spreadsheet with a nicer font.
One more thing worth building into the habit here, benchmark comparisons only mean something when they’re consistent across reporting periods. Switching which benchmark source gets used from one quarter to the next, chasing whichever one happens to make the numbers look better that particular month, defeats the entire purpose of benchmarking in the first place. Pick a source, commit to it, and let the comparison stay honest even in months when the numbers aren’t flattering.
Common Social Media Analytics Mistakes to Avoid
A handful of mistakes show up constantly across brands, across platforms, across teams that otherwise clearly know what they’re doing in every other respect. Worth naming each one directly here instead of burying them inside a generic checklist nobody actually reads closely.
Tracking every single metric a dashboard happens to offer, instead of the handful genuinely tied to an actual stated goal, is by far the most common mistake in this whole list. It tends to feel thorough while it’s happening, like more data automatically means better decisions. It’s actually the opposite in practice, since a report packed with thirty different numbers gives the person reading it nowhere real to focus their attention, and everything ends up competing for equal weight even though it clearly isn’t equally important. Comparing accounts of wildly different sizes using raw totals instead of rates is another mistake that quietly skews conclusions without anyone noticing right away, a 50,000-follower account and a 5,000-follower account should genuinely never be compared using total likes, only ever using rate, because the raw numbers will always favor the bigger account regardless of actual content quality. Ignoring platform context entirely when benchmarking causes a similar kind of distortion, since a 1% engagement rate might read as genuinely disappointing on LinkedIn while being perfectly normal, even solid, on Facebook, and applying one flat benchmark across every platform erases that difference completely.
Skipping UTM tagging is a mistake that doesn’t announce itself immediately when it happens, it shows up much later, months down the line, when someone eventually asks “did social actually drive any of this traffic we’re seeing” and there’s simply no honest way left to answer that question with any confidence. And reporting numbers without attaching a clear recommendation to them, that last one is less a data-collection mistake and more a communication failure, but it’s arguably the single biggest reason so many otherwise well-built reports get skimmed once and then never referenced again by anyone.
Conclusion
Come back to where this whole thing started. Screenshotting a follower count into a slide deck and calling that analytics is scorekeeping, plain and simple, and scorekeeping doesn’t tell anyone what to actually do next, no matter how polished the slide itself looks. The real work sitting underneath good social media measurement is picking metrics tied to a real goal and a real funnel stage, rather than chasing whatever list of twenty numbers happens to show up by default inside a native dashboard. Reach genuinely matters when the goal is awareness. It has no legitimate business anchoring a conversion-focused report, no matter how tempting it is to reach for because it’s the easiest number sitting right there. Engagement rate says something real and useful about content quality, but only when the formula stays consistent from one report to the next and the comparison stays fair across accounts and platforms. ROAS is ultimately the number that answers, honestly and concretely, whether any of this activity was actually worth the spend behind it.
None of this stays fixed in place forever, either, which is worth sitting with. Instagram folding Impressions and Plays into a single unified Views metric is proof, right now, in real time, that measurement itself keeps shifting underneath everyone’s feet, sometimes without much warning. The habit genuinely worth building isn’t a one-time setup where the right metrics get chosen once, locked in, and left alone indefinitely after that. It’s coming back every few months, deliberately, and asking honestly whether the numbers currently being tracked still answer the questions the business is actually asking right now, not the questions it was asking a year ago.
Frequently Asked Questions
What is social media analytics?
It’s the process of collecting, measuring, and interpreting data from social channels to actually understand what’s working and guide the next decision. Not the same thing as just having numbers on a dashboard. Pulling up a follower count is data collection. Noticing that carousels consistently out-save Reels for a specific brand and shifting the content calendar because of it, that’s analytics.
What is the most important social media metric?
Honestly, there isn’t one universal answer, and anyone who gives a single number without asking about the goal first is skipping a step. It depends entirely on what stage of the funnel the content is trying to serve. For pure awareness work, reach is doing the real job. For consideration, engagement rate is the closest thing to a single best indicator of content quality. For anything tied to revenue, ROAS is the number that actually settles the argument. Pick the metric that matches the goal, not the one that’s easiest to screenshot.
What is a good engagement rate on social media?
This one genuinely depends on which benchmark source gets used, since different reports disagree by a fair amount. Socialinsider’s 2026 data puts TikTok around 3.70%, Instagram around 0.48%, Facebook around 0.15%, and X around 0.12%. Hootsuite’s cross-industry numbers from the same period land differently, closer to 3.5% for Instagram, 3.4% for LinkedIn, 1.5% for TikTok, and 1.3% for Facebook. Rather than chasing one exact figure, pick a single credible source, use its formula consistently, and track the trendline over time. A steadily rising number matters more than matching someone else’s benchmark to the decimal.
What’s the difference between a metric and a KPI?
A metric is just a raw data point, a number sitting there on its own, like likes or reach. A KPI is a metric that’s been tied directly to a specific business goal, which is what actually makes it worth watching closely. Conversion rate is just a metric until a team decides the real goal is sales, and only then does it become a KPI. Every KPI is technically a metric. Most metrics never become KPIs, and that’s fine, they don’t all need to.
How do I track social media conversions?
UTM parameters, applied consistently on every single link shared across every platform, captions, bio links, Stories, LinkedIn posts, all of it. These tags tell Google Analytics exactly which platform and campaign sent a given visitor, which lets that traffic get connected back to actual conversions in GA4 instead of disappearing into a vague “direct” traffic bucket. Skip the tagging even occasionally and there’s no honest way left to prove social actually drove any of it.
How often should I create a social media analytics report?
Depends on the audience and the decision the report needs to support. Weekly works for internal check-ins with the content team, since it keeps the feedback loop tight enough to actually adjust the calendar in real time. Monthly suits a full platform performance review for a marketing lead. Quarterly is the right cadence for executive or client-facing ROI reporting, where the goal is showing a trend over time rather than reacting to a single week’s numbers.
Do social media metrics matter for small accounts?
Yes, and in some ways they matter more, not less. A 5,000-follower account with a genuinely strong engagement rate is often doing more for a brand than a 100,000-follower account where most of that audience never interacts with anything. Rate-based metrics, engagement rate, conversion rate, don’t care how big the account is. What matters is tracking consistently from the start, so there’s an actual trendline to look back on once the account does grow.
What’s the difference between reach and impressions?
Reach counts unique people, each person only counted once no matter how many times they saw the content. Impressions count total displays, so the same person seeing a post three times counts as three impressions, not one. Neither number says anything about whether the content actually worked, they just describe how far it traveled. Worth noting, Instagram has been folding both of these into a single “Views” metric across Reels, Stories, and feed posts, so historical comparisons across that change need a bit of care.