


Somebody on your team pulls up Google Analytics on a Monday morning, sees the bounce rate sitting at 78%, and panics. That’s the usual reaction. Nobody stops to ask what page it’s on, where the traffic came from, or whether that number is even a problem in the first place. They just see a high percentage next to a metric with the word “bounce” in it and assume something’s broken.
Here’s the thing though. Bounce rate is probably the most misread number in all of analytics. People treat it like a report card. One number, pass or fail. But it doesn’t work that way, and if you’ve ever obsessed over lowering it without understanding what’s actually happening on your pages, you’ve probably wasted time fixing things that were never broken.
This guide is going to walk through what bounce rate really means, why it changed with GA4, what counts as “good” depending on the type of page you’re looking at, and then get into the real work: diagnosing why people are actually leaving and fixing it properly. No fluff, no 47-tip listicles that repeat the same three ideas with different headings. Just the stuff that actually moves the number, and just as importantly, when you shouldn’t even bother.
What Is Bounce Rate, Actually?
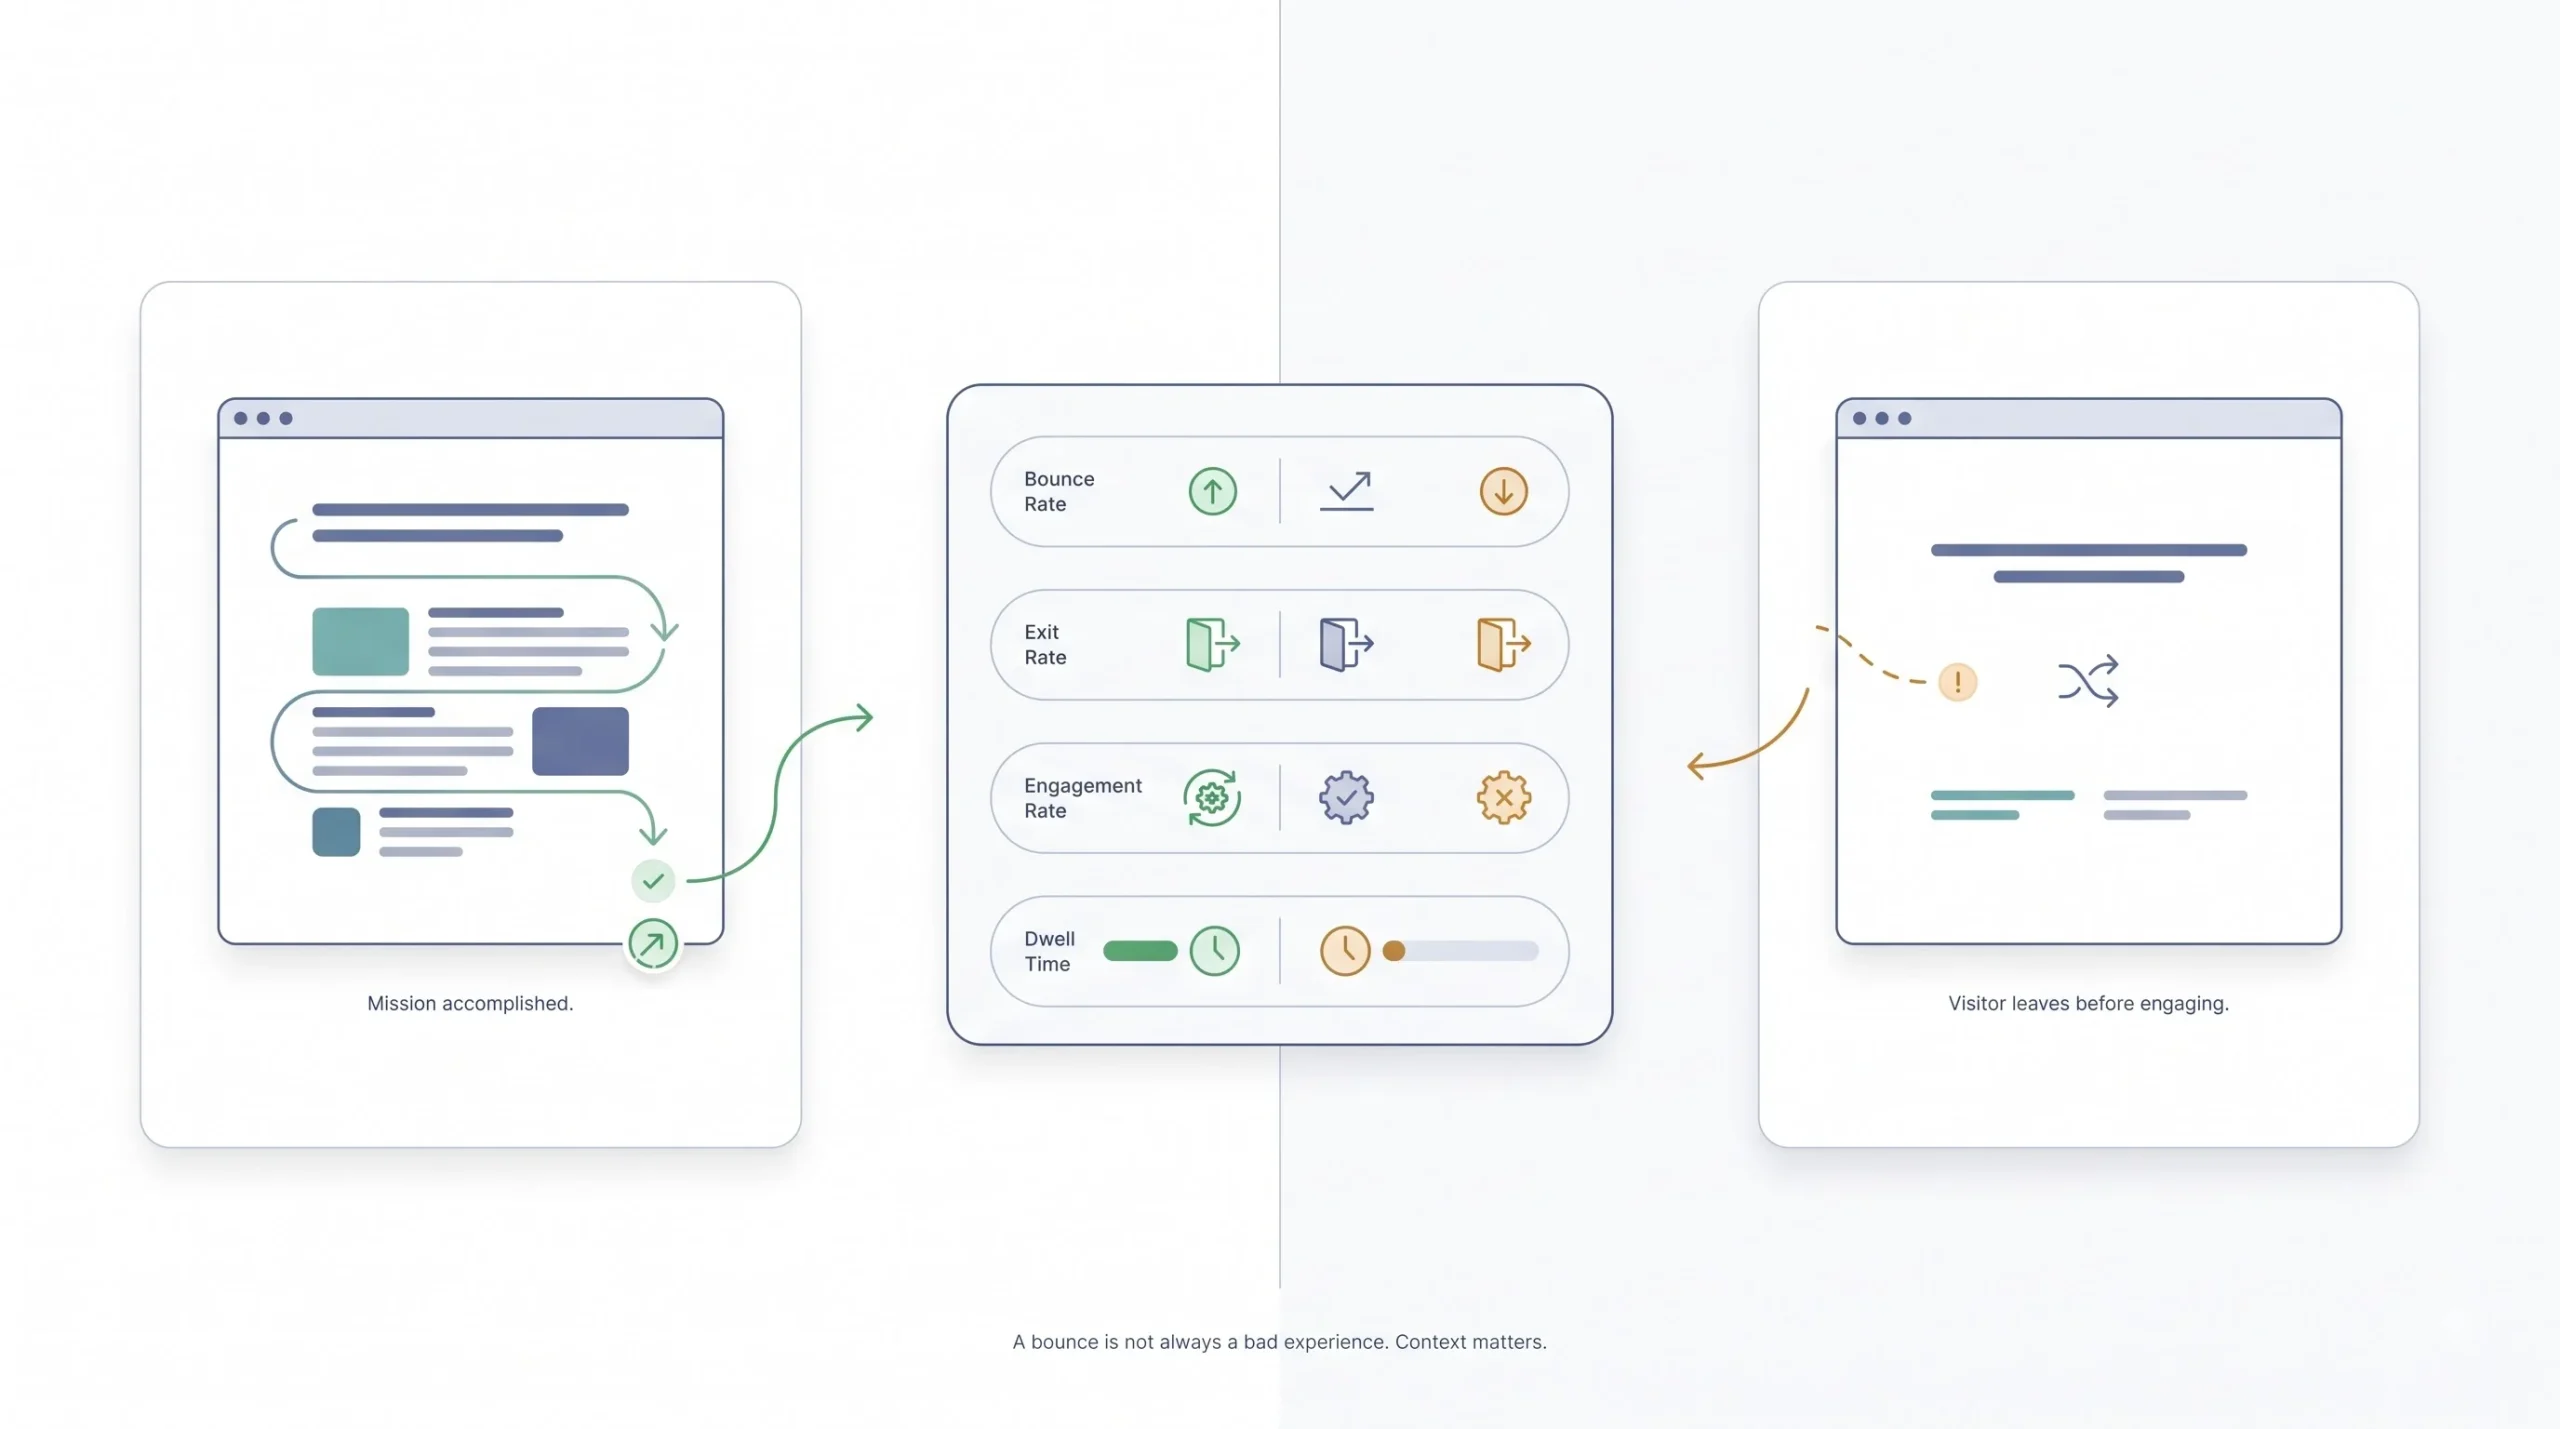
Bounce rate, at its simplest, is the percentage of sessions where someone lands on a page and leaves without doing anything else. No click to another page, no scroll deep enough to trigger an event, no form fill, nothing. One page, one visit, gone.
Picture this. Someone Googles “how to reset a router,” clicks your article, reads the three steps, resets their router, and closes the tab. That’s a bounce. Technically. But was it a bad experience? Not even close. They got exactly what they came for in under sixty seconds. The problem is Google Analytics doesn’t know the difference between that person and someone who landed on your homepage, hated the design, and left in two seconds flat. Both count as bounces. Wildly different outcomes, same metric.
That’s the trap. A single number is trying to describe two completely opposite situations, and most people never dig deeper than the top-line percentage. Honestly, that’s the whole reason so many bounce rate “fixes” end up being a waste of time. You can’t fix a number you haven’t actually understood yet.
There’s also a lot of confusion between bounce rate and a handful of similar-sounding metrics. People throw these terms around like they’re interchangeable, and they’re really not.
| Metric | What it measures | Common confusion |
|---|---|---|
| Bounce Rate | Single-interaction sessions, no further engagement | People confuse it with exit rate |
| Exit Rate | The percentage of sessions where a page was the last one visited, regardless of how many pages came before it | Mixed up as site-wide when it’s actually page-specific |
| Engagement Rate (GA4) | The direct opposite of bounce rate in GA4’s model | Treated like a totally separate, unrelated metric |
| Dwell Time | How long someone waits before clicking back to the search results | Confused with plain “time on page,” which measures something different |
A bounce isn’t automatically a rejection. Sometimes it’s just proof that your content did its job fast enough that the person didn’t need to stick around. That distinction matters more than anything else in this guide, so keep it in the back of your mind as we go.
How Bounce Rate Changed in GA4 (Important for Beginners)
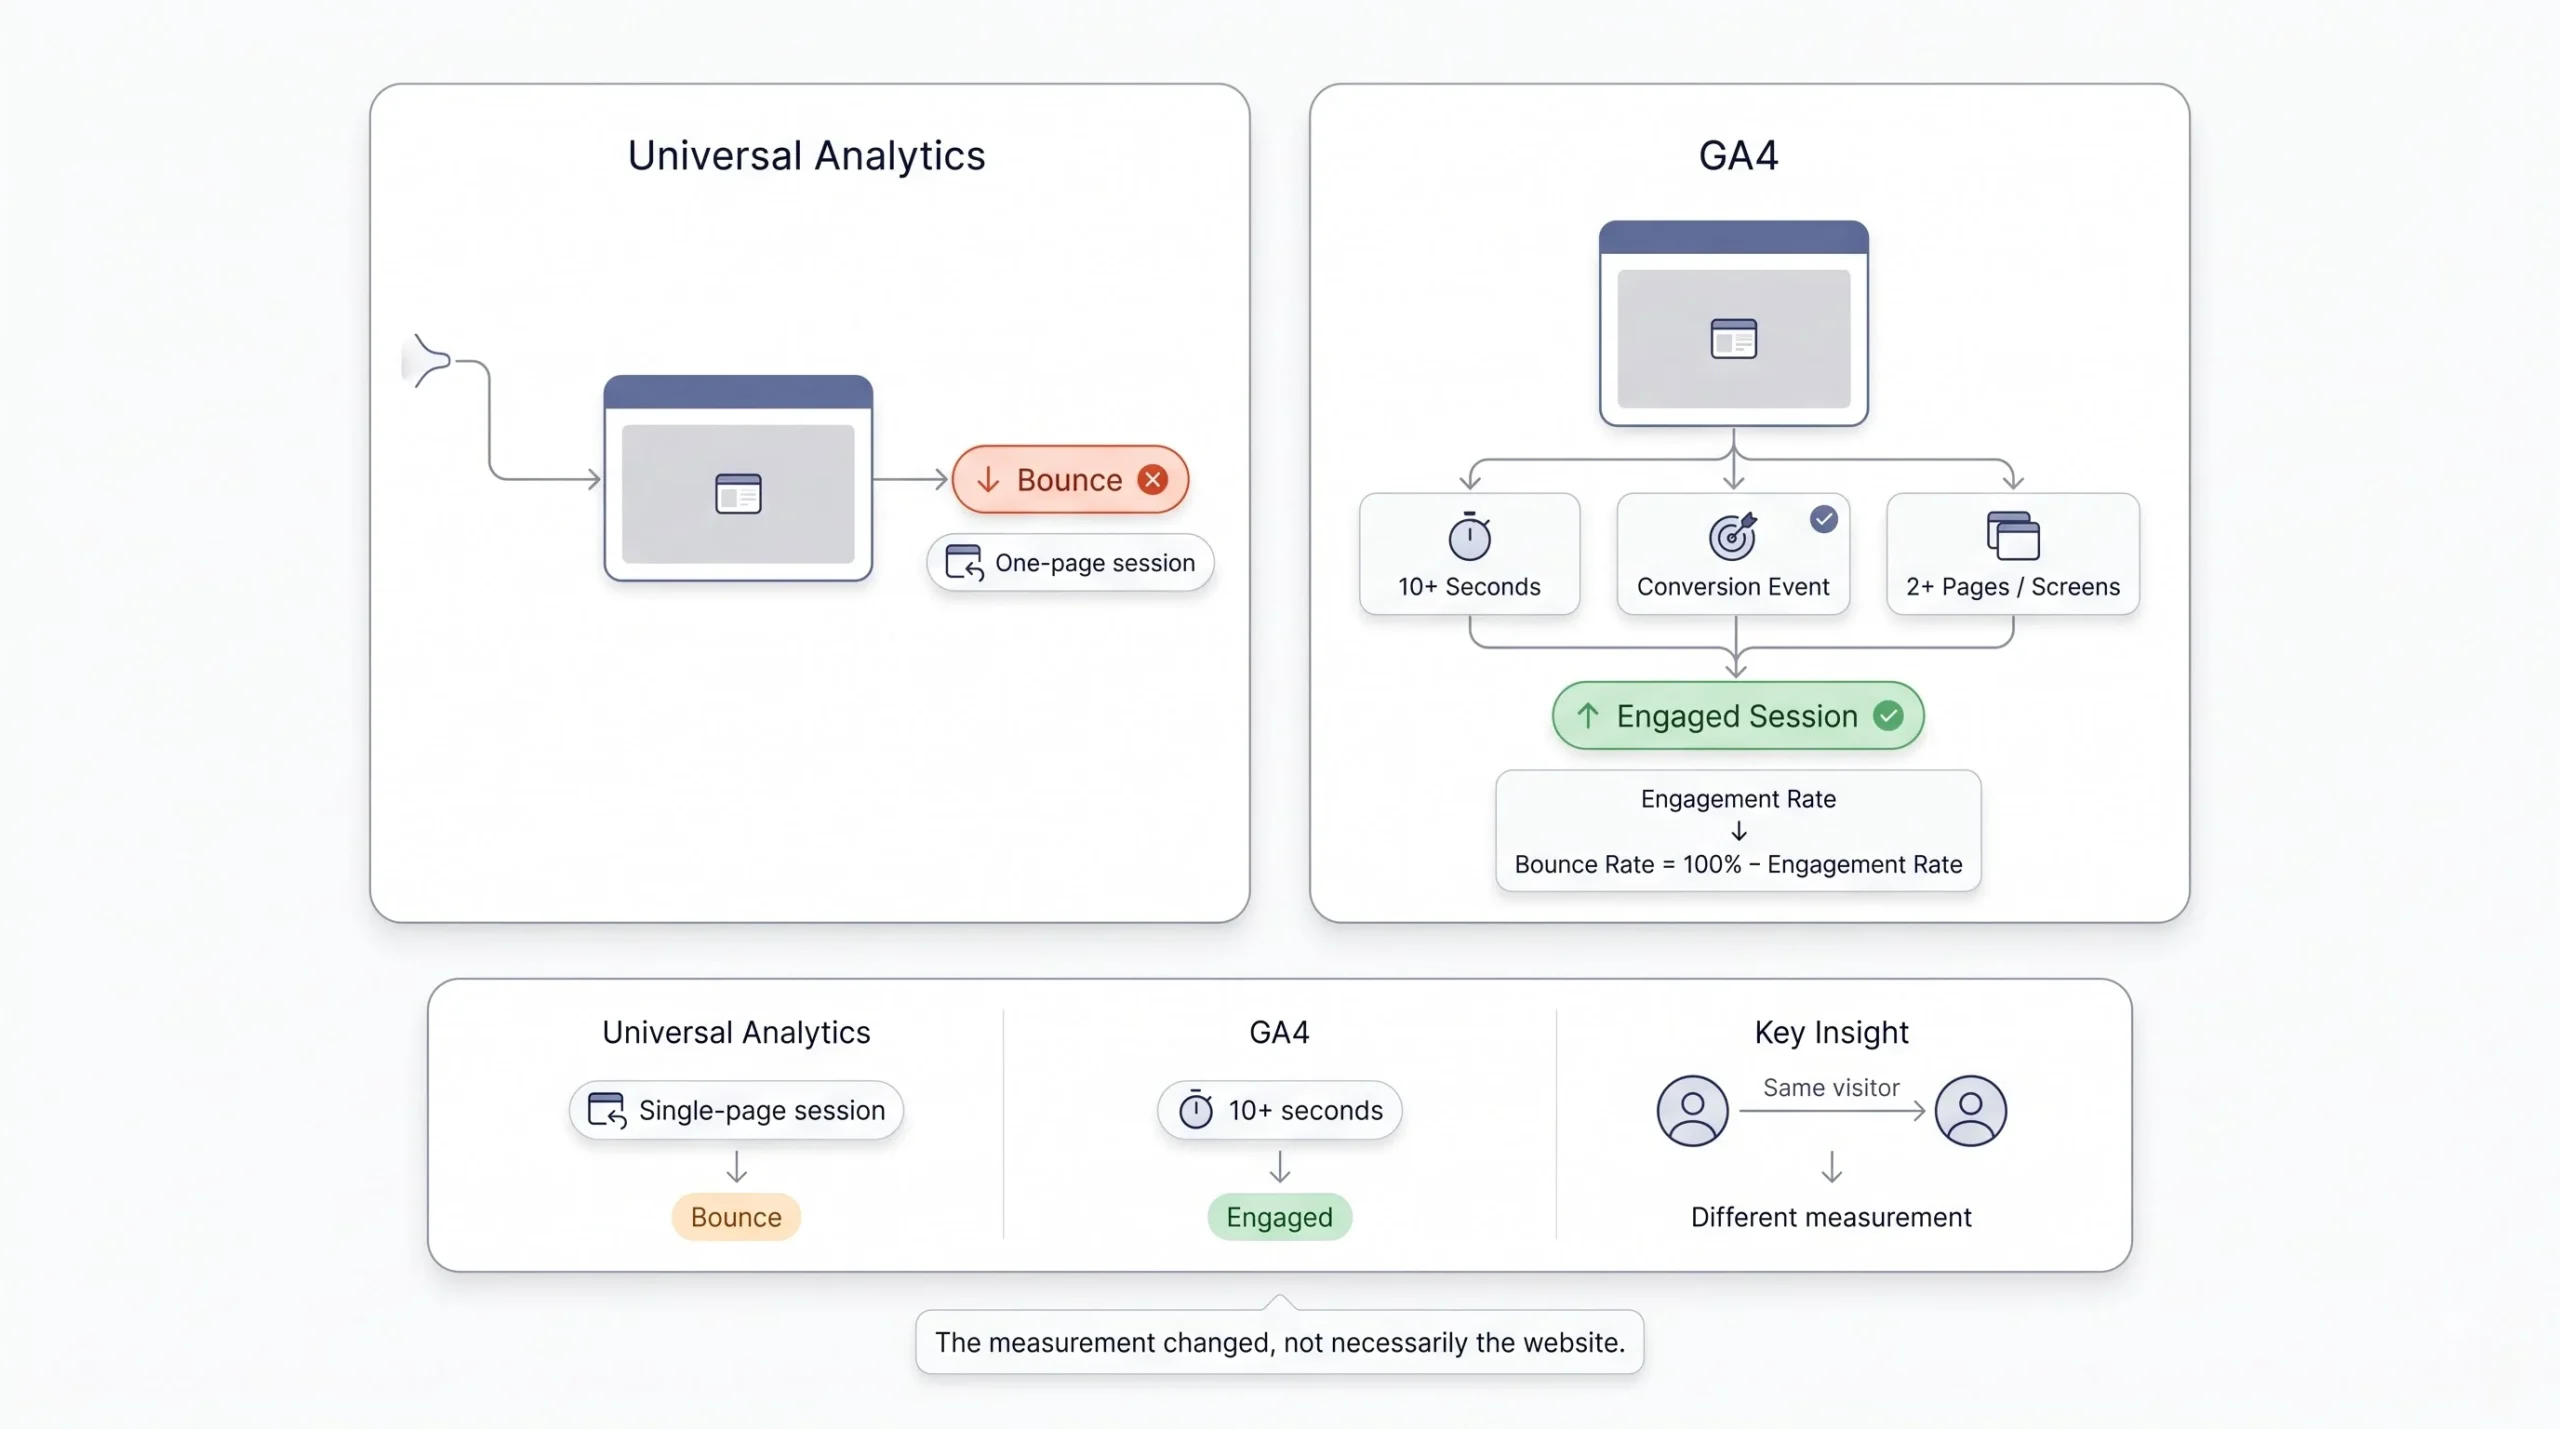
If you learned analytics on Universal Analytics and then jumped to GA4, you probably noticed something weird. The bounce rate numbers look completely different. Lower, usually, sometimes dramatically so. That’s not because your site suddenly got better overnight. It’s because GA4 flipped the whole model on its head.
Universal Analytics defined a bounce as a single-page session with no interaction. GA4 does the opposite. It starts from “engagement rate” and calculates bounce rate as whatever’s left over. So instead of asking “did anything else happen,” GA4 asks “did this session count as engaged,” and bounce rate is just 100% minus that.
So what actually makes a session “engaged” in GA4? Three things, and it only takes one of them to count.
- The session lasted 10 seconds or longer
- The user triggered a conversion event
- The user viewed 2 or more pages, or 2 or more screens if you’re looking at app data
See the problem? Under the old model, someone who read your article for 45 seconds and left without clicking anything was a bounce. Under GA4, that same visit counts as engaged because it crossed the 10-second mark. That’s a massive shift, and it’s why so many sites saw their bounce rate suddenly drop when they moved to GA4. Nothing changed on the site. The measuring stick changed.
This trips people up constantly, especially when a boss or a client asks why “bounce rate improved” after a GA4 migration and nobody touched the site in between. Nope, nothing got better overnight. The definition just got looser.
This matters because if you’re comparing your current bounce rate to numbers from a few years ago, you’re not comparing apples to apples. And if you’re benchmarking against articles or case studies written before the GA4 switch, you need to mentally adjust for this. A “good” bounce rate quoted in a 2019 blog post means something different than a “good” bounce rate today.
You’ll find this data under the Engagement reports in GA4, usually broken down by page and screen. Bounce rate isn’t front and center the way it used to be either. GA4 pushes engagement rate forward as the headline metric, and you sometimes have to add bounce rate manually as a custom column if you want to see it directly.
What’s a “Good” Bounce Rate? (Context Is Everything)
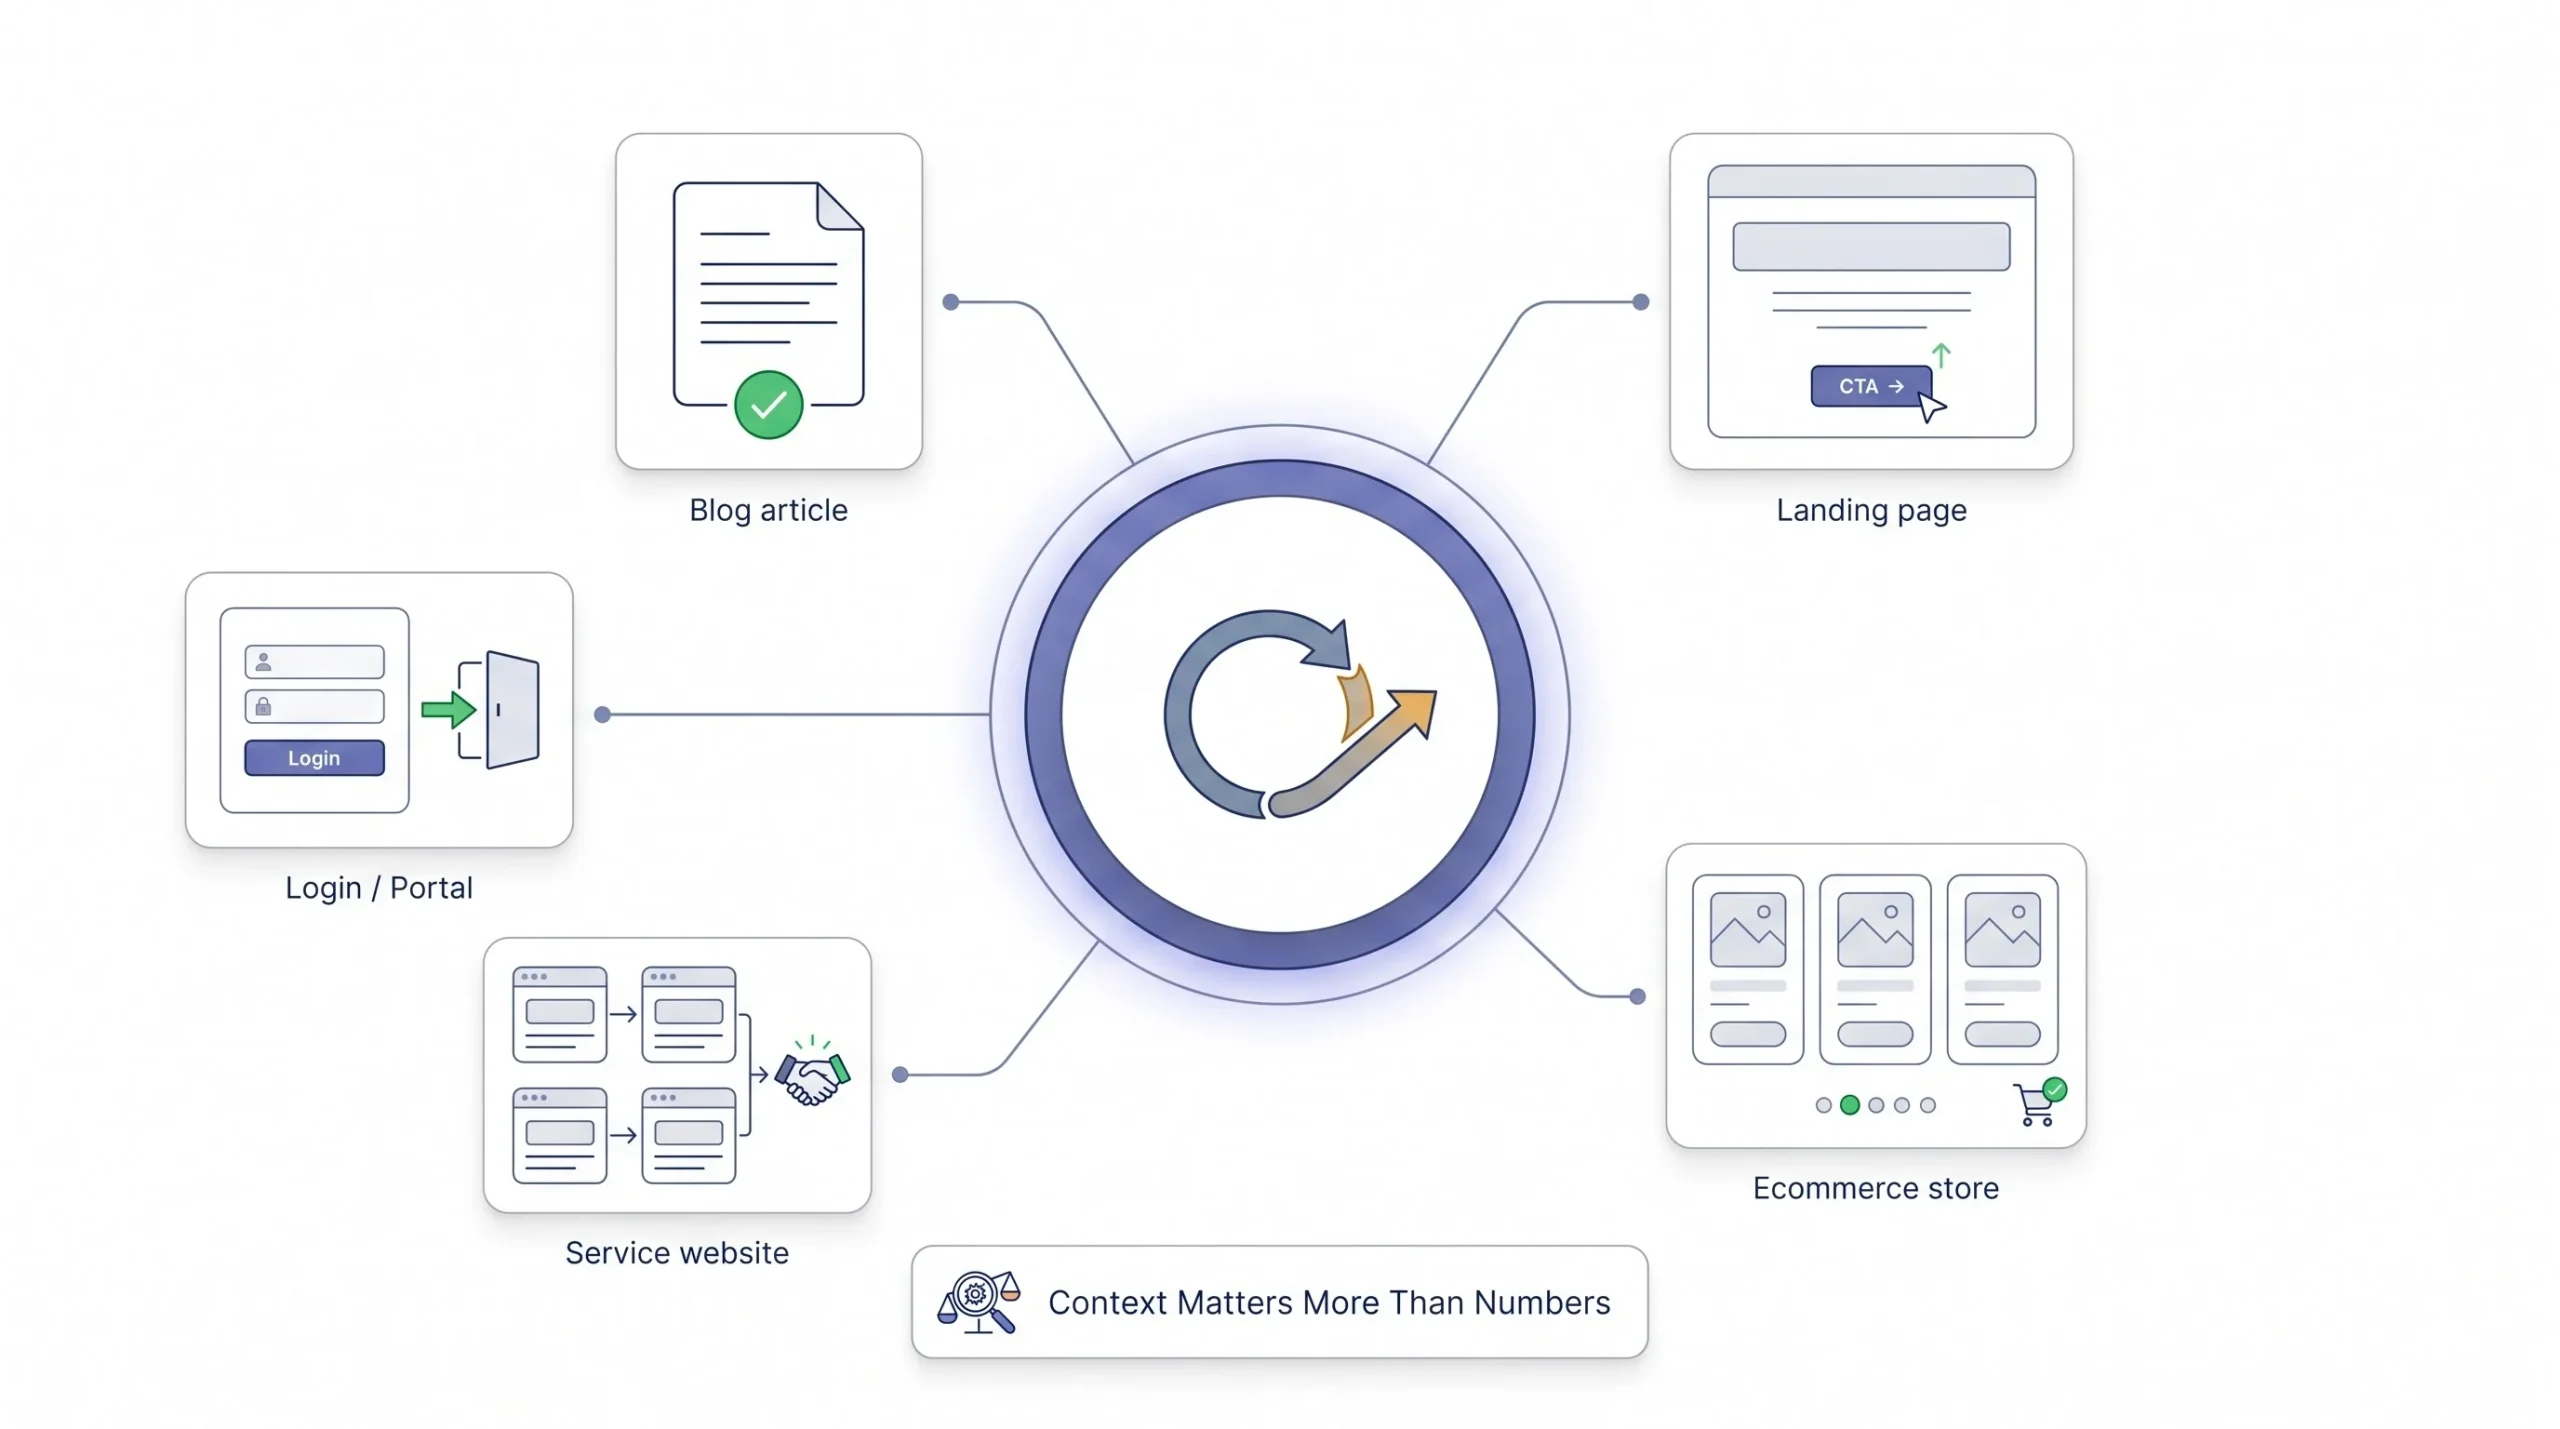
Ask ten different marketers what a good bounce rate is and you’ll get ten different numbers, and honestly, most of them are guessing. The truth is there’s no universal target. A bounce rate that would be a disaster on a checkout page might be completely normal, even expected, on a blog post.
Here’s roughly how it breaks down across different page types.
| Page Type | Typical Bounce Rate Range | Why |
|---|---|---|
| Blog or content page | 65% to 90% | Single-answer intent, people get what they need and leave |
| Landing page (paid traffic) | 60% to 90% | Depends heavily on how well the offer matches the ad |
| Ecommerce homepage | 20% to 45% | People browse across multiple products in one session |
| Service or B2B site | 25% to 55% | Research-heavy journeys, people click around before deciding |
| Portal or dashboard login | 10% to 30% | Task-based, repeat visits, users already know where they’re going |
Notice something. Blog posts sit at the top of that range, not the bottom. That’s normal. If your blog’s bounce rate is sitting at 75%, that’s not automatically a red flag. It might just mean people are finding answers quickly.
There’s a classic example that explains this better than any stat ever could. Think about searching for the cast of a movie. You type the movie name into Google, click through to the IMDb page, see the full cast list right there, and close the tab. You never clicked anything else on the site. You never needed to. IMDb records that as a bounce, but you, the actual human being, got exactly what you wanted in under five seconds. Nobody would call that a failed visit.
Sites that answer questions really well, the ones that are genuinely useful reference resources, tend to have brutally high bounce rates precisely because they’re good at their job. They don’t force people to click around to find the answer. The information is right there. So the bounce rate goes up while user satisfaction, the thing you actually care about, goes up right alongside it.
So when should you actually worry? When there’s a clear next step you want someone to take and they’re not taking it. A landing page built around a specific offer, where the entire point is to get a signup or a purchase, and the bounce rate is 85%. That’s worth investigating. A product page where people land and immediately leave without even scrolling to see the price. That’s worth investigating too. The difference is intent. If the page exists to answer a single question, a high bounce rate can mean success. If the page exists to move someone toward a conversion, a high bounce rate usually means something’s broken.
Why Visitors Actually Bounce, The Real Causes
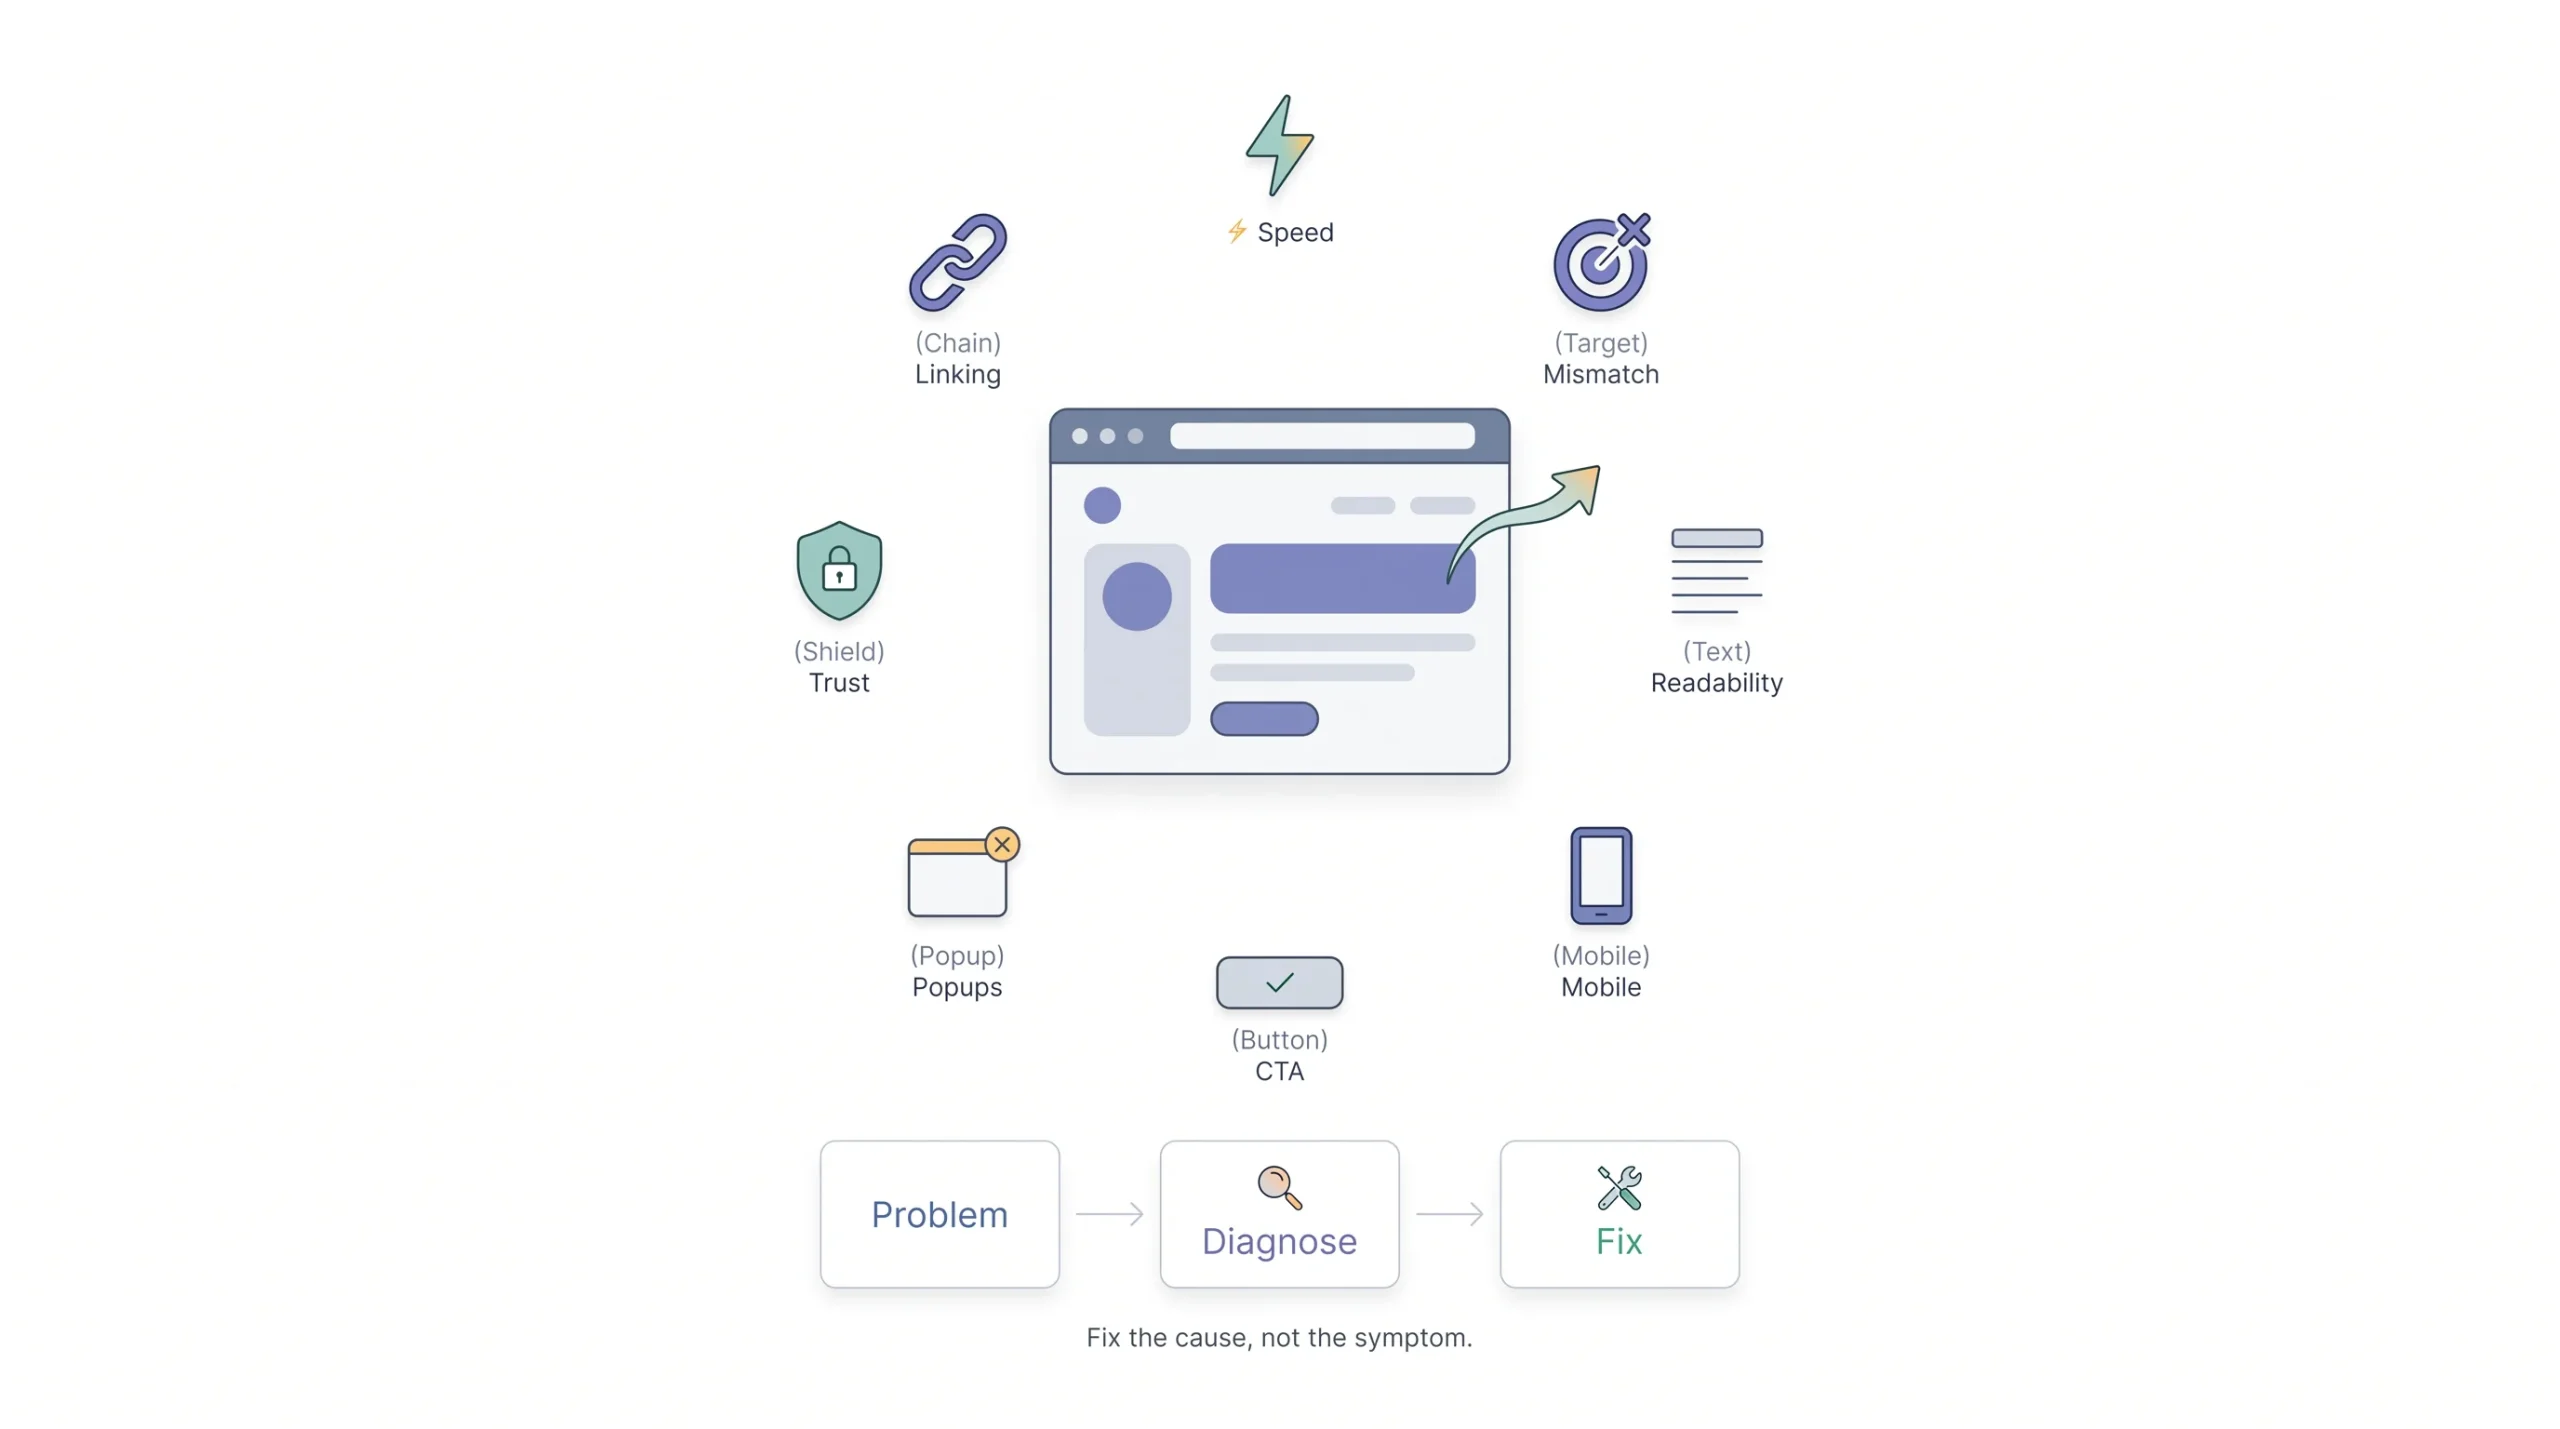
Before jumping into fixes, it helps to actually diagnose what’s going wrong instead of applying every tip from every blog post and hoping something sticks. That approach wastes time and sometimes makes things worse, especially when you “fix” something that wasn’t broken.
There are a handful of recurring causes behind most bounce problems, and they usually fall into a few buckets. Page speed issues, where the site simply takes too long to load and people leave before it even finishes rendering. Expectation mismatch, where the ad or search result promised one thing and the page delivered something else. Poor readability or design, where the content is there but it’s a mess to actually consume. Bad mobile experience, where the desktop site looks fine but the phone version is broken or clunky. Weak or missing calls to action, where visitors don’t know what to do next even if they liked what they read. Aggressive or badly timed popups, where an offer slams onto the screen before someone’s even had a chance to read a sentence. Broken trust signals, like outdated design or spelling errors that make a page feel unreliable. And poor internal linking, where there’s simply nothing else to click on even if the visitor wanted to keep exploring.
The trick is matching the symptom you’re seeing in your data to the likely cause, and that’s a lot easier with a reference point.
| Symptom in GA4 | Likely Cause | Where to Verify |
|---|---|---|
| High bounce rate, low average time on page | Expectation mismatch or slow load speed | Check page speed report and compare the SERP snippet to actual page content |
| High bounce rate, high average time on page | Content probably answered the question fully | Usually fine, just check whether this page has a conversion goal at all |
| High bounce rate on mobile specifically | Responsive design or mobile UX issue | Mobile usability report in Search Console |
| High bounce rate from paid traffic | Mismatch between ad copy and landing page | Compare the actual ad headline and copy against the page’s headline and content |
This table alone saves a ton of guesswork. Instead of randomly trying page speed fixes on a page where the real issue is a mismatched ad, you check the data first and go straight to the actual cause.
How to Reduce Bounce Rate, The Action Framework
Once the diagnosis is clear, the fixes fall into six areas. They’re not equally weighted. Speed and expectation matching tend to move the needle the most, but all six matter depending on what your data is telling you.
1. Fix Page Speed First
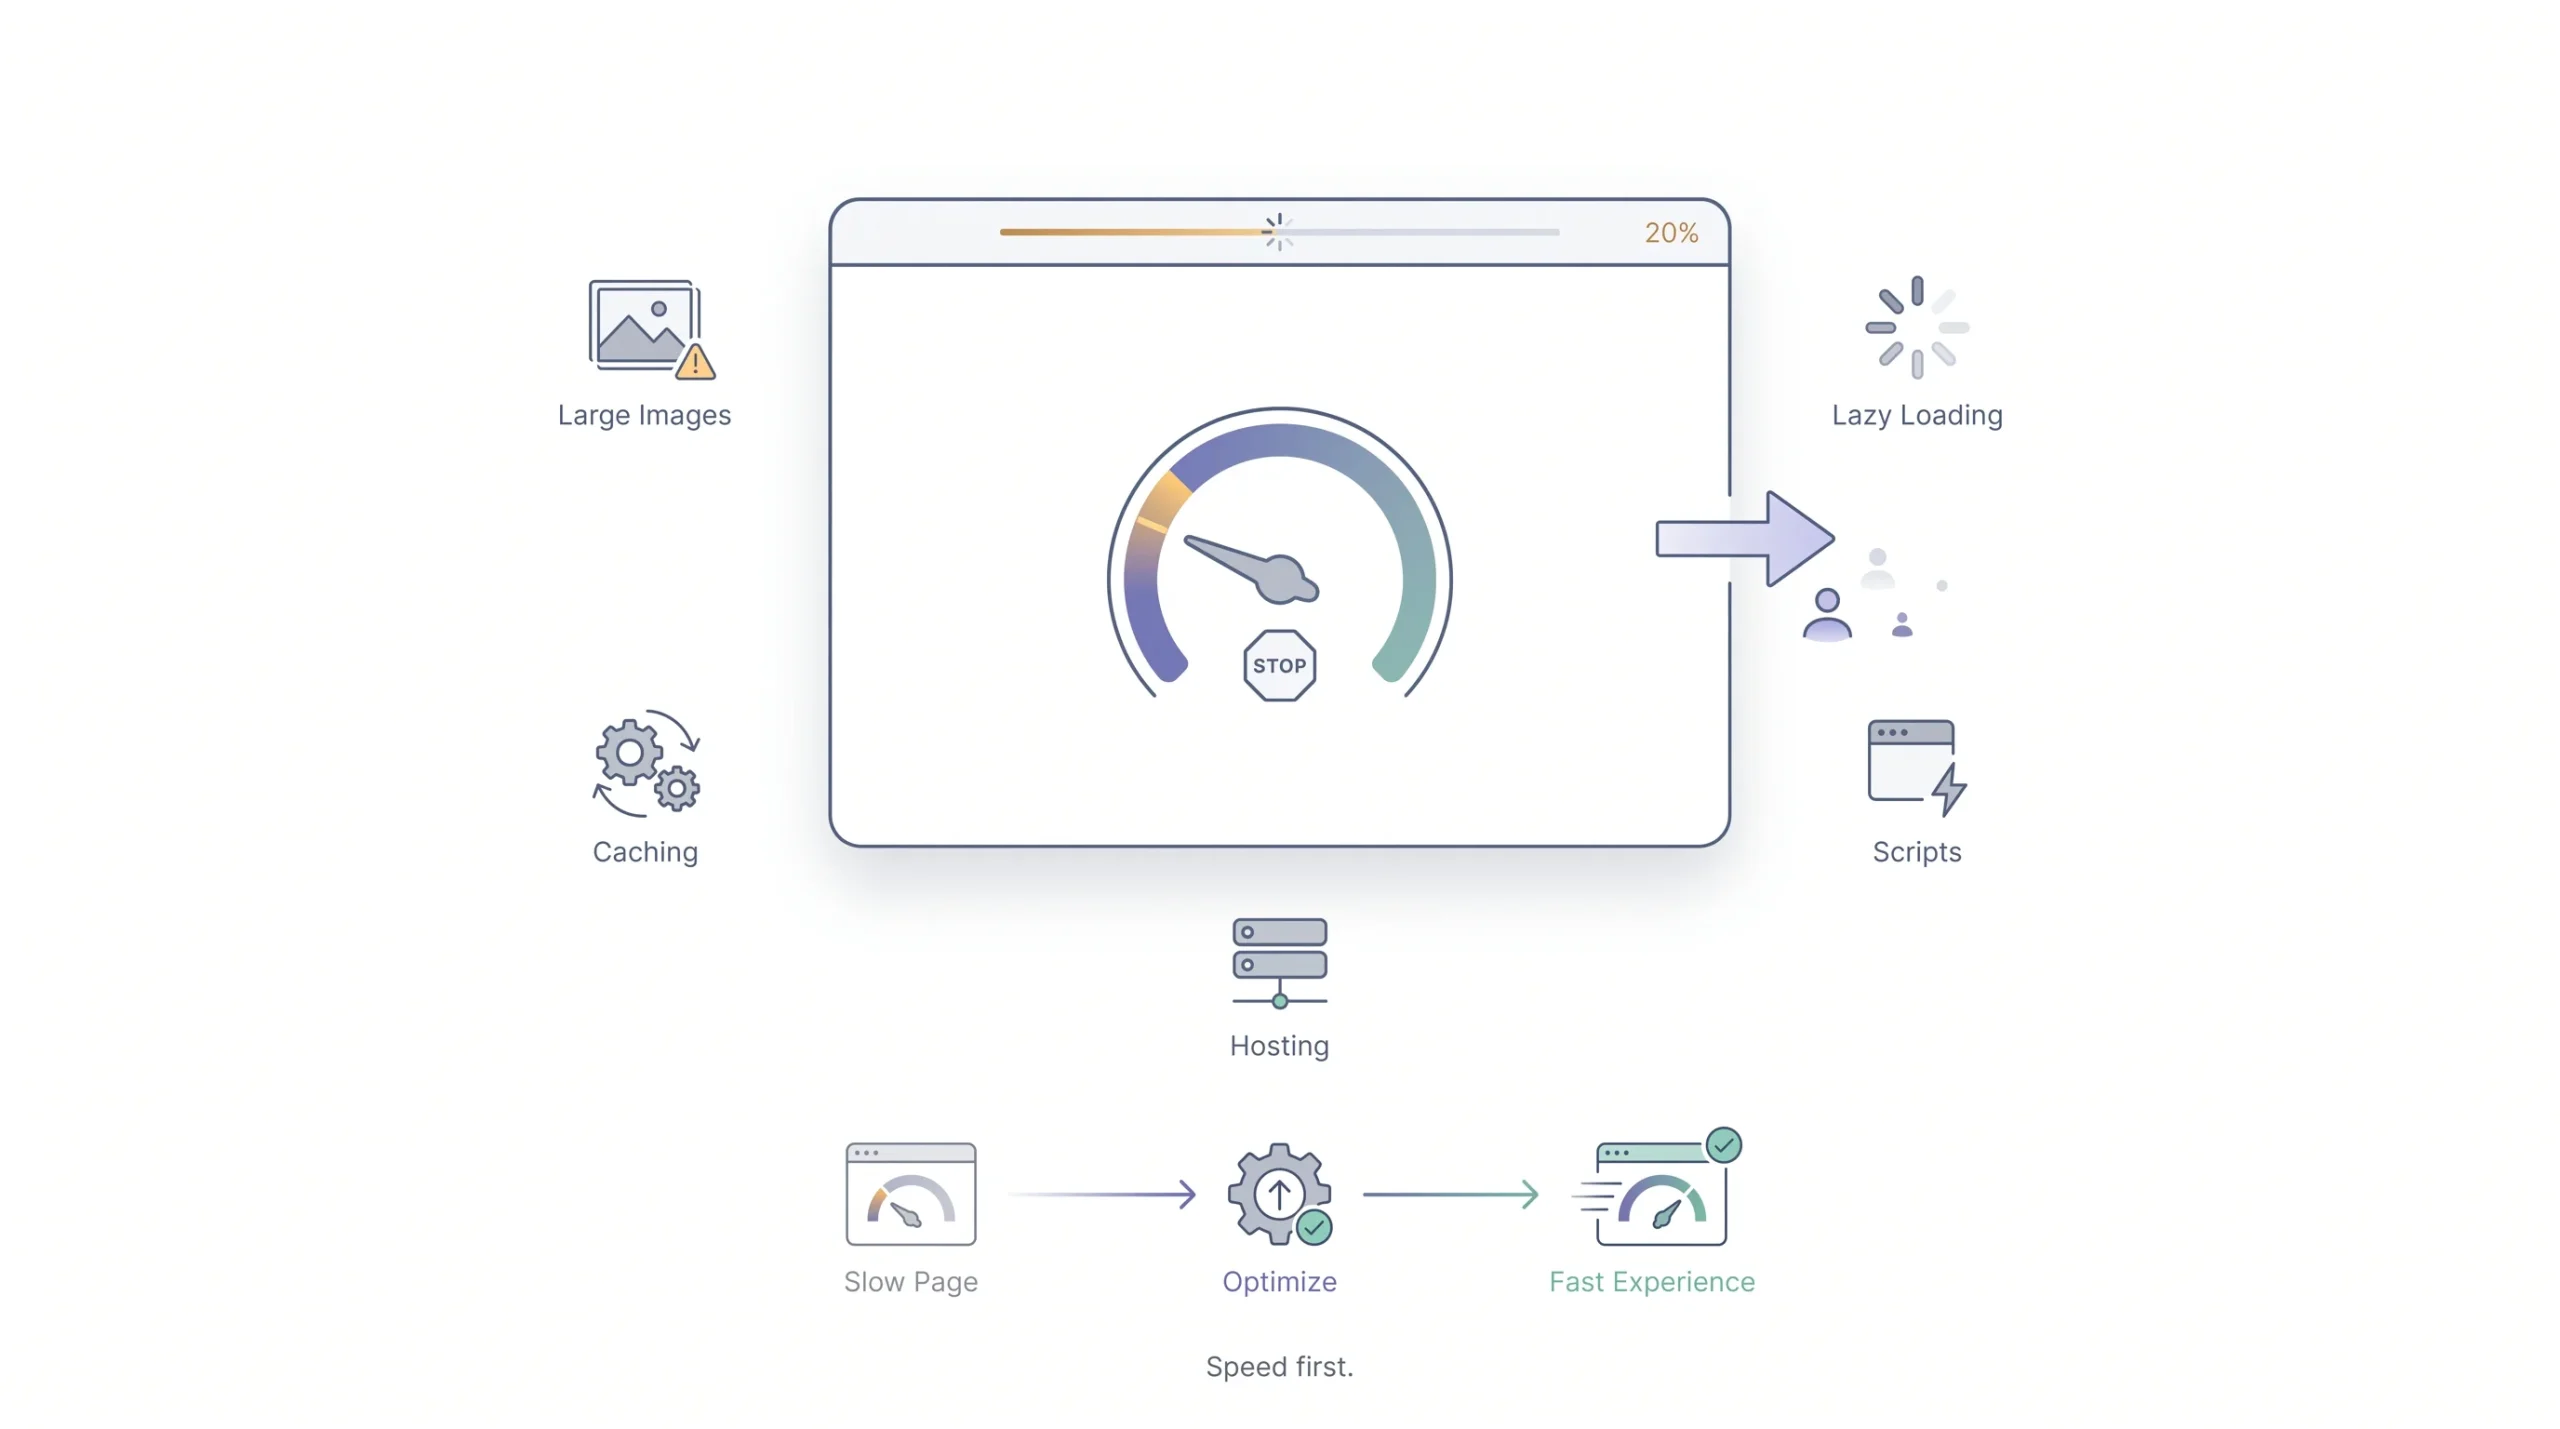
Speed is usually the single biggest lever, and it’s not close. Google’s own research has repeatedly pointed to the three-second mark as the point where people start abandoning a page that hasn’t finished loading. Every additional second past that point costs you visitors who never even saw your content, let alone judged it. Look at what actually happens on the visitor’s end. They don’t sit there staring at a spinning loader wondering if it’s worth the wait. They hit back and pick the next result. Nobody’s giving your page the benefit of the doubt anymore, especially on mobile.
This connects directly to Core Web Vitals too, since Google uses loading performance as part of how it evaluates page experience. A slow site doesn’t just lose visitors on the spot, it can also lose ranking position over time, which means fewer visitors show up in the first place.
The good news is that most speed problems come down to a short list of usual suspects.
- Uncompressed or oversized images that are way bigger than they need to be for how they’re displayed
- Lazy loading not being used for images and content below the fold
- Heavy caching not set up properly, forcing the server to rebuild pages from scratch on every visit
- Too many third-party scripts running at once, things like chat widgets, ad trackers, and analytics tools all fighting for resources
- Hosting that simply isn’t fast enough for the traffic the site gets
Tools like PageSpeed Insights and GTmetrix will point to the exact bottlenecks on a given page instead of leaving you guessing. Run the test, look at what’s flagged as the biggest opportunity, and start there instead of trying to fix everything at once.
If speed has been a recurring issue across your site rather than just one page, it’s worth digging into a broader website speed and SEO strategy rather than patching individual pages one at a time.
2. Match Content to Search Intent (Expectation Alignment)
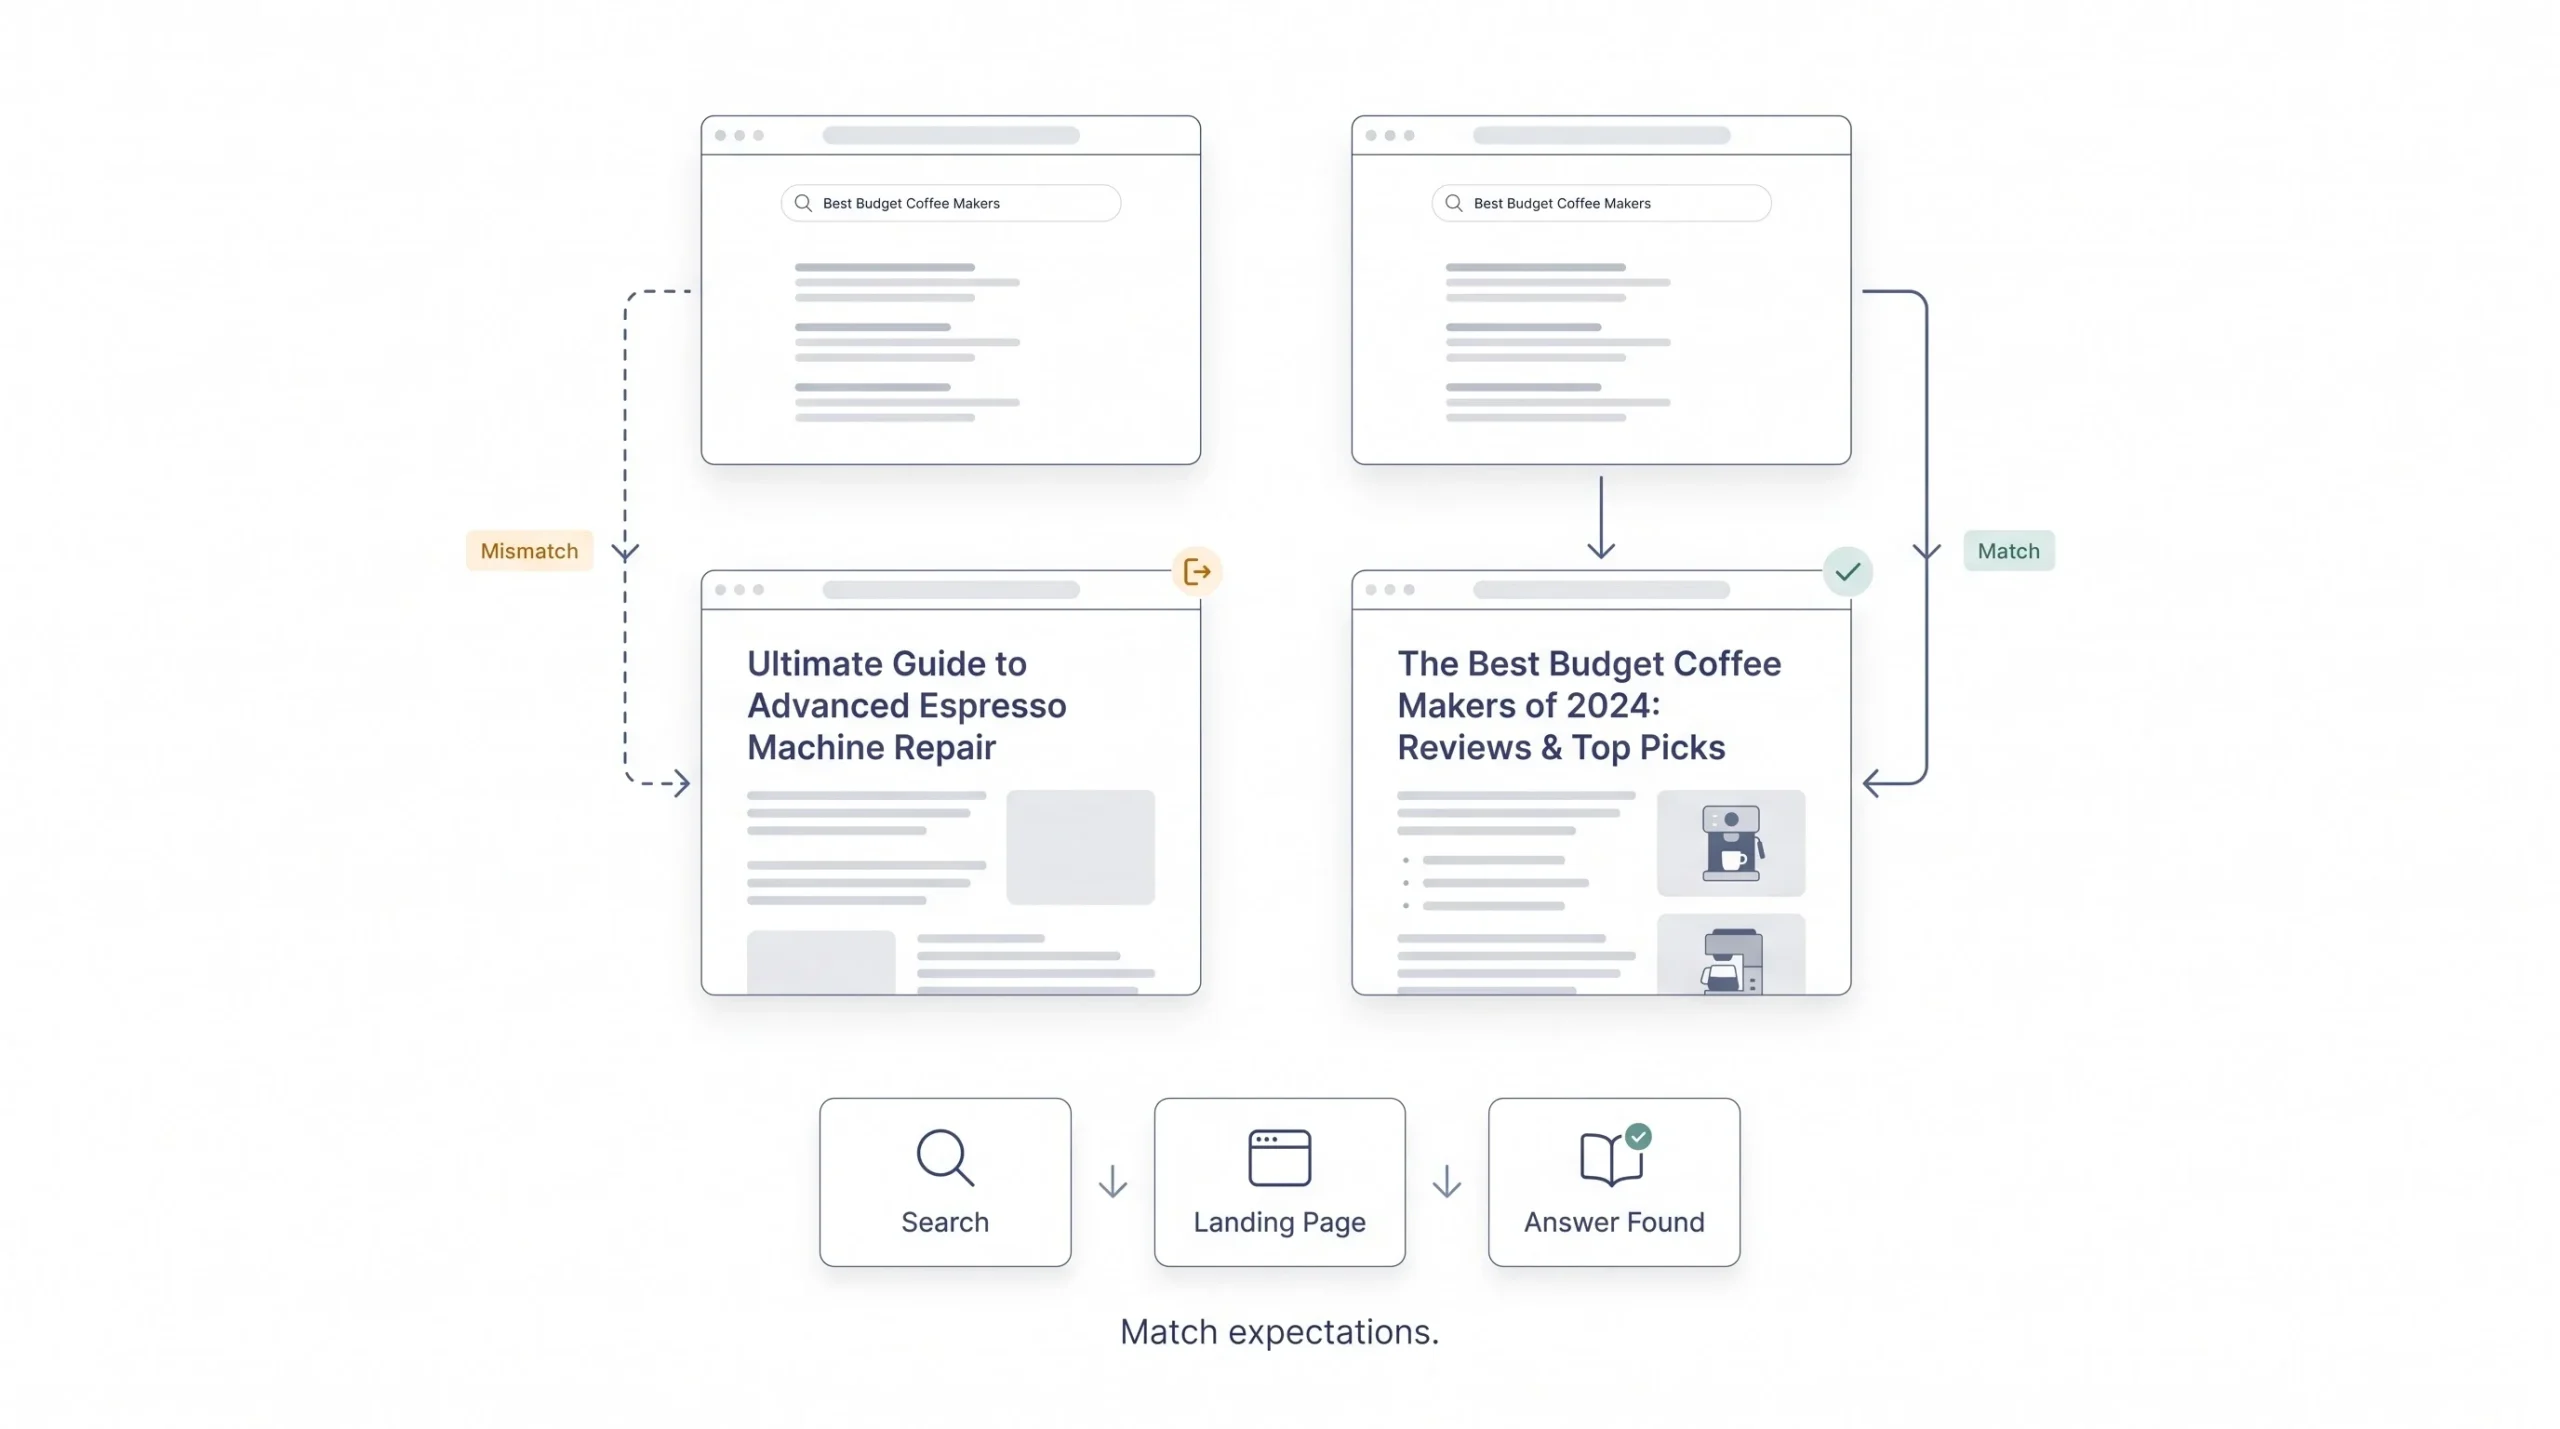
This is the one that gets overlooked constantly, and it might be the most common reason behind a high bounce rate on pages that otherwise look totally fine.
Here’s what happens. Someone searches for something specific. Your meta description or your ad copy promises a specific answer. They click through expecting that answer. And then the page either buries it three paragraphs in, or worse, doesn’t really deliver it at all. The visitor feels tricked, even if that wasn’t the intention, and they leave immediately.
The fix starts with an honest audit. Pull up your top pages by bounce rate and actually read them the way a first-time visitor would. Does the headline match what brought them there. Does the first hundred words actually answer the core question, or does it warm up with a long introduction before getting to the point.
Answer the core question before trying to impress anyone with how much you know. That single habit fixes more bounce rate problems than almost anything else on this list, and it costs nothing to implement.
This applies just as much to paid landing pages as it does to organic blog content. If a Google Ad promises “same-day quotes” and the landing page headline says something generic like “Welcome to our services,” that mismatch alone can tank conversion and spike bounce rate, even if the rest of the page is well designed.
3. Improve Readability and On-Page Structure
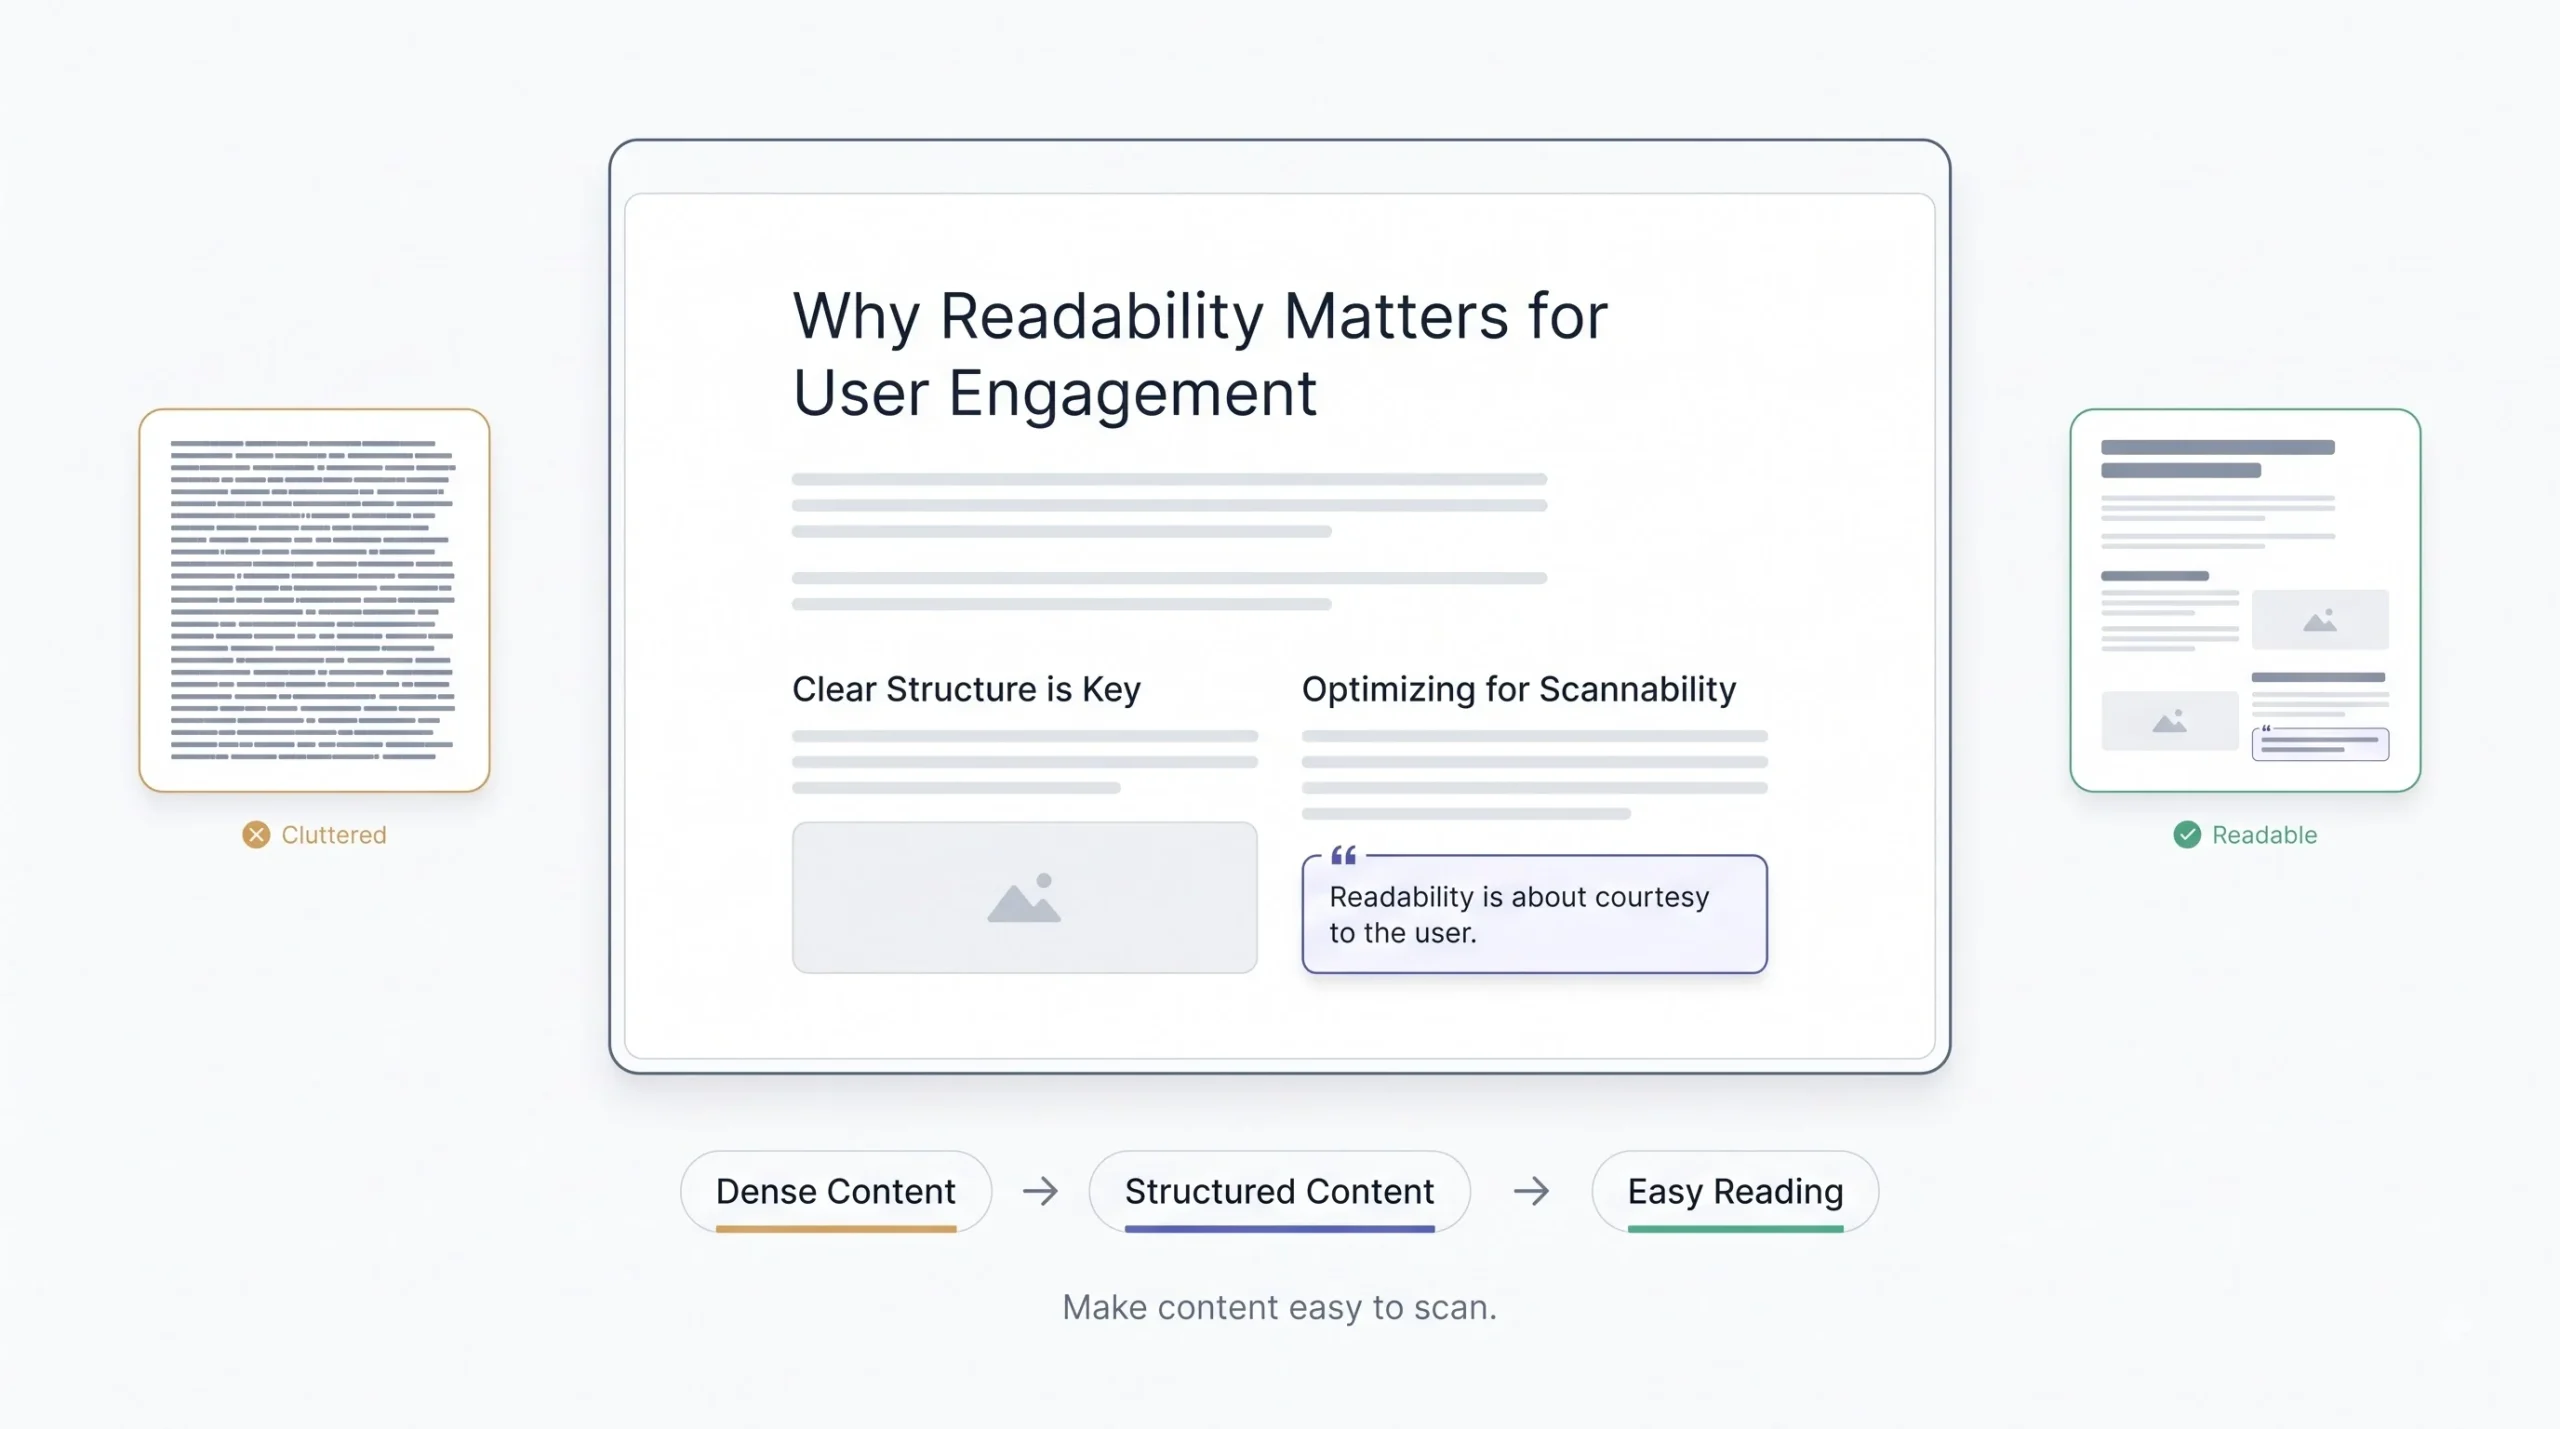
Content can answer the right question and still lose people because it’s exhausting to actually read. Big blocks of text, no visual breaks, tiny font, low contrast. All of that adds friction, and friction pushes people back to the search results.
Headers and subheaders do more work than people give them credit for. They let visitors scan the page and confirm, within a couple seconds, that the information they need is somewhere on it. Short paragraphs matter for the same reason. A wall of text feels like work before anyone’s even read a word of it.
Breaking things up with images, relevant examples, or a well-placed pull quote gives the eye somewhere to rest. It also signals that the page was actually built with the reader in mind, rather than just stuffed with keywords and left alone.
Basic readability rules go a long way here too. Reasonable font size, decent contrast between text and background, line lengths that aren’t stretched across the entire screen on desktop. None of this is complicated, but it’s the kind of thing that gets skipped when a site is focused purely on getting content published fast.
And error-free content matters more than people think. A page riddled with typos or broken formatting reads as sloppy, and sloppy reads as untrustworthy. Visitors don’t always consciously notice the individual errors, but they feel the overall impression, and that impression affects whether they stick around.
4. Strengthen Internal Linking and Related Content
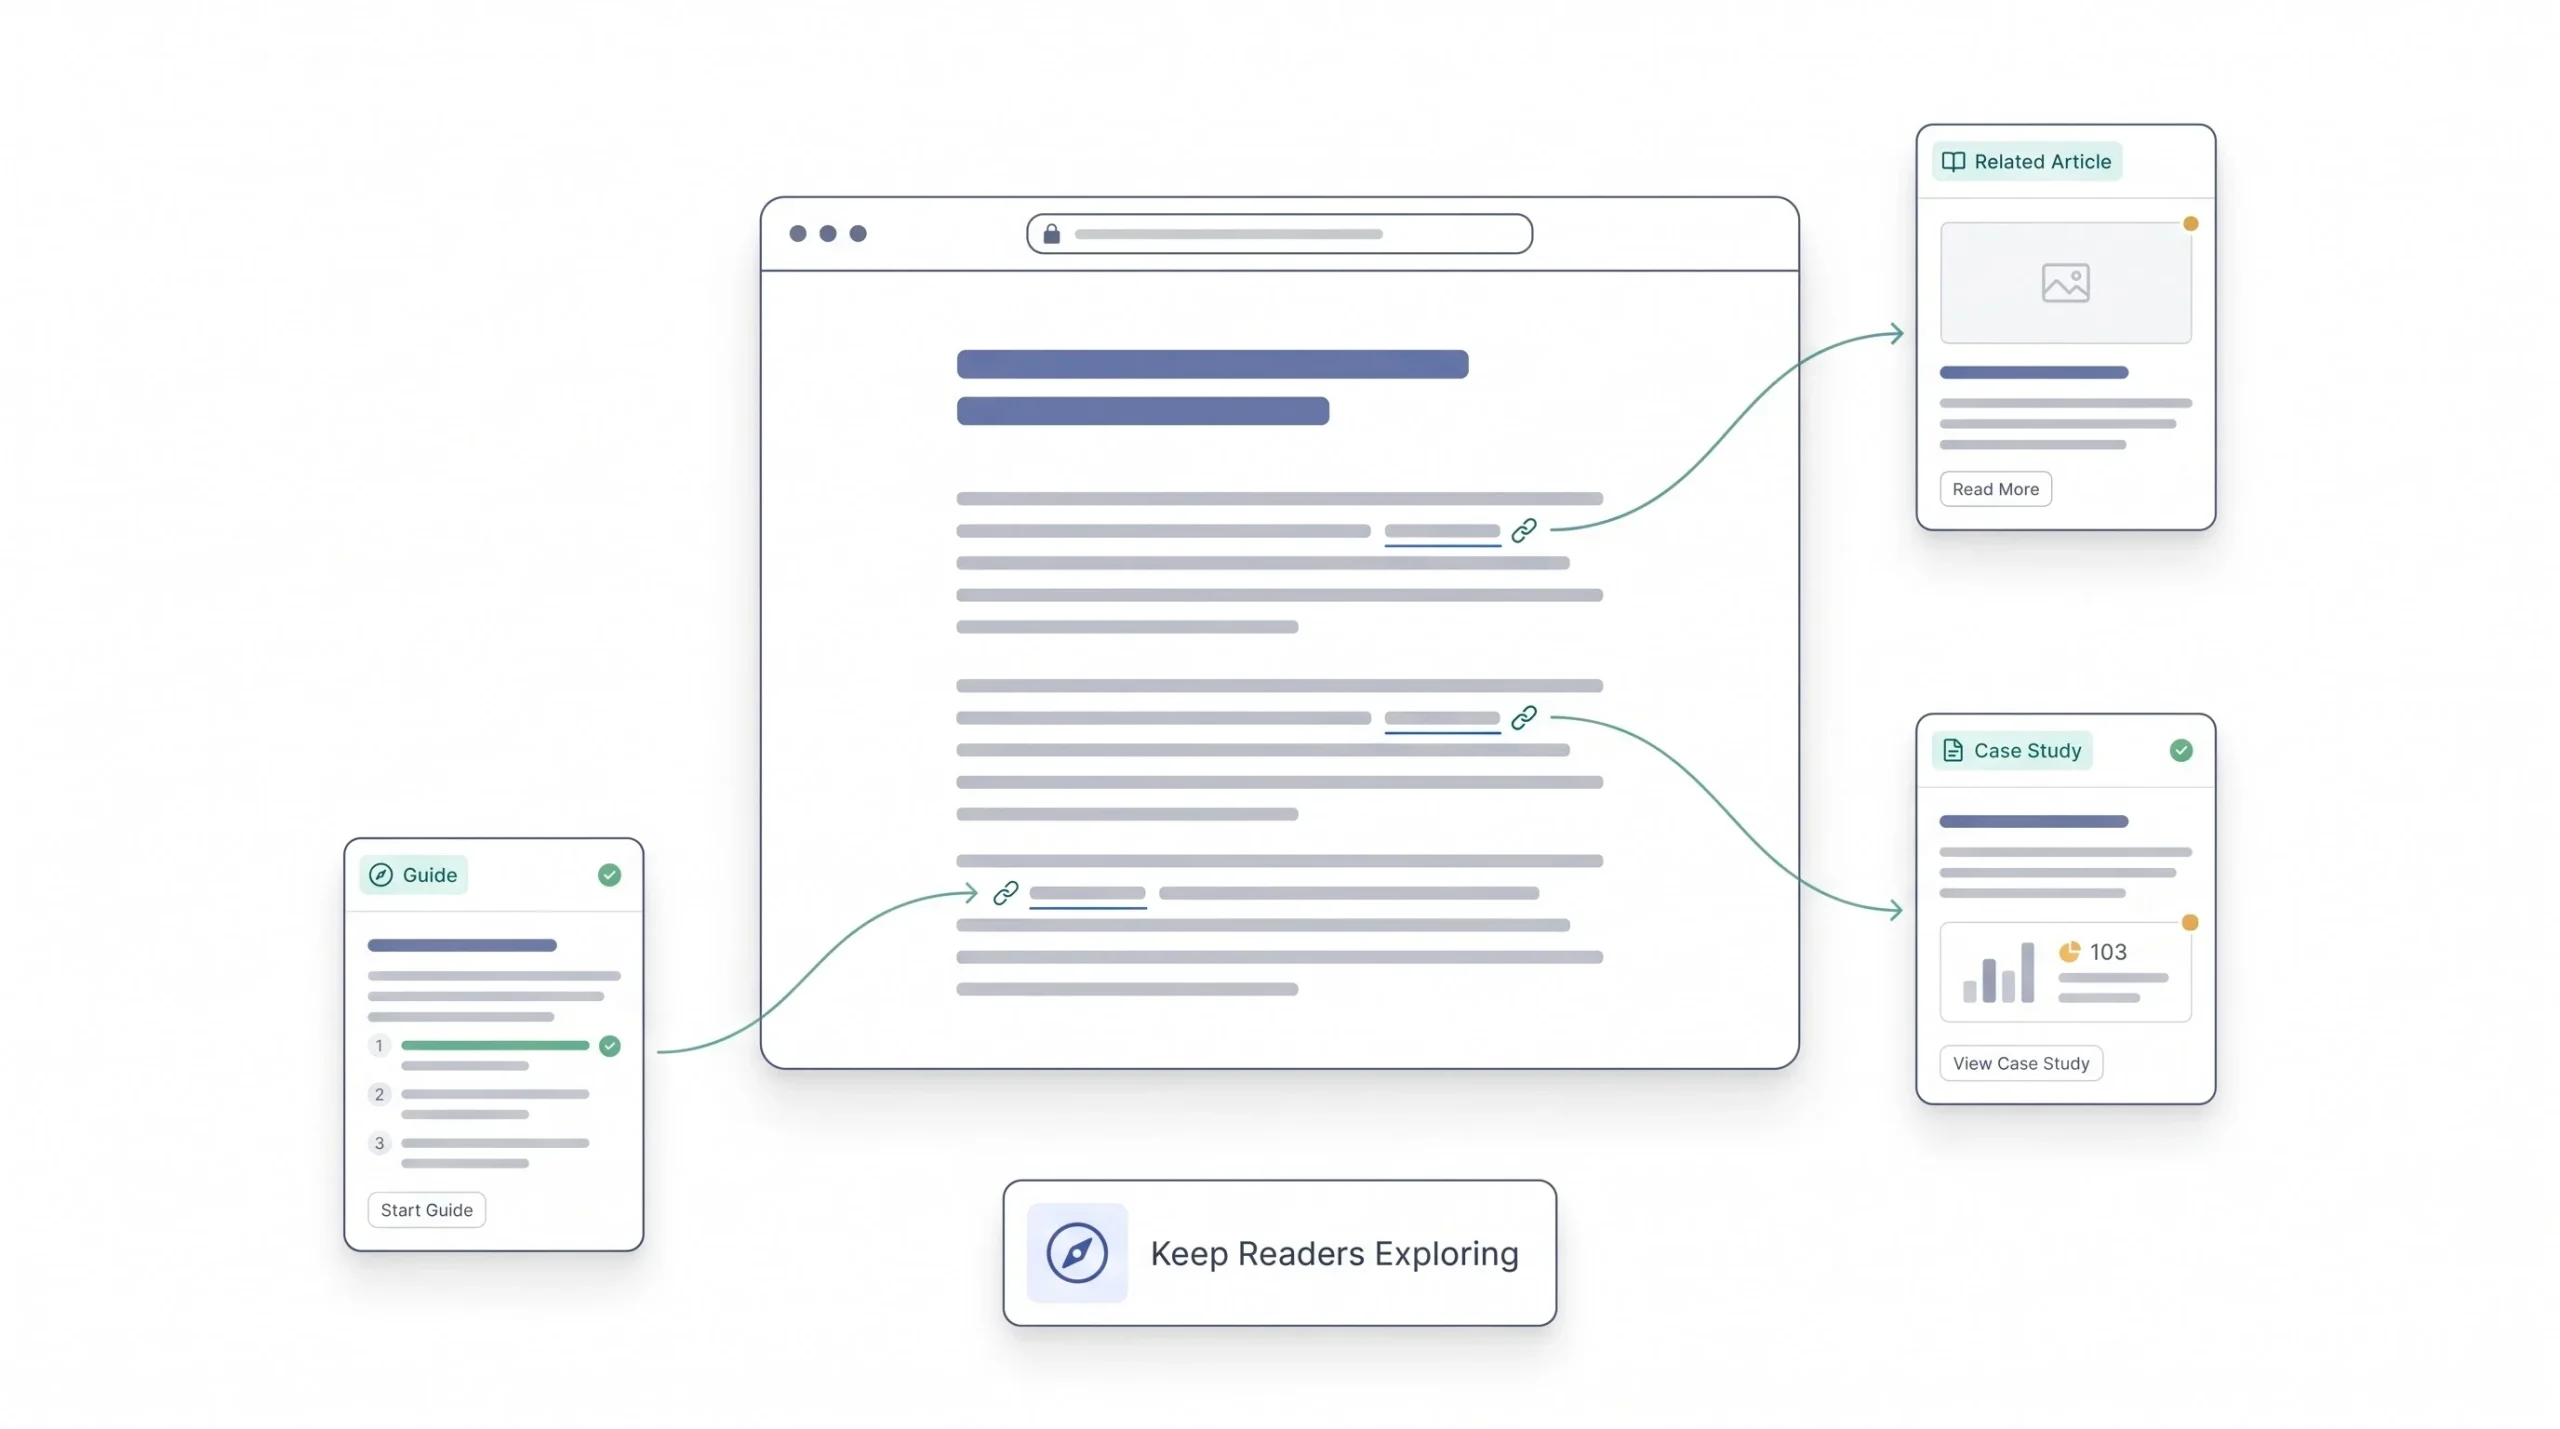
This is one of the highest-return fixes on this entire list, and it’s often the easiest to implement since it doesn’t require touching design or hosting at all.
The logic is simple. If someone finishes reading a piece of content and there’s nothing else obvious to click, they leave, because leaving is the default action. But if there’s a genuinely relevant next piece of content sitting right in front of them, a meaningful chunk of people will click through instead.
There are a few different ways to do this, and they’re not mutually exclusive.
- Contextual links placed naturally inside the body of an article, pointing to genuinely related content rather than random pages
- Related-post modules or widgets at the end of an article, showing a handful of relevant pieces
- Navigational links in menus or categories that help people explore a topic cluster
Contextual, in-content links tend to perform the best because they show up exactly when the reader’s interest is highest, right in the middle of engaging with a topic. A related-posts widget at the very bottom only works if the person actually scrolls all the way down, which not everyone does.
A reasonable target is somewhere around one to three genuinely relevant internal links per post. Not links stuffed in for the sake of hitting a number, actual links to content someone reading that specific paragraph would find useful. Quality over quantity matters a lot here, since irrelevant links just create clutter and get ignored anyway.
5. Design Clear, Non-Intrusive CTAs
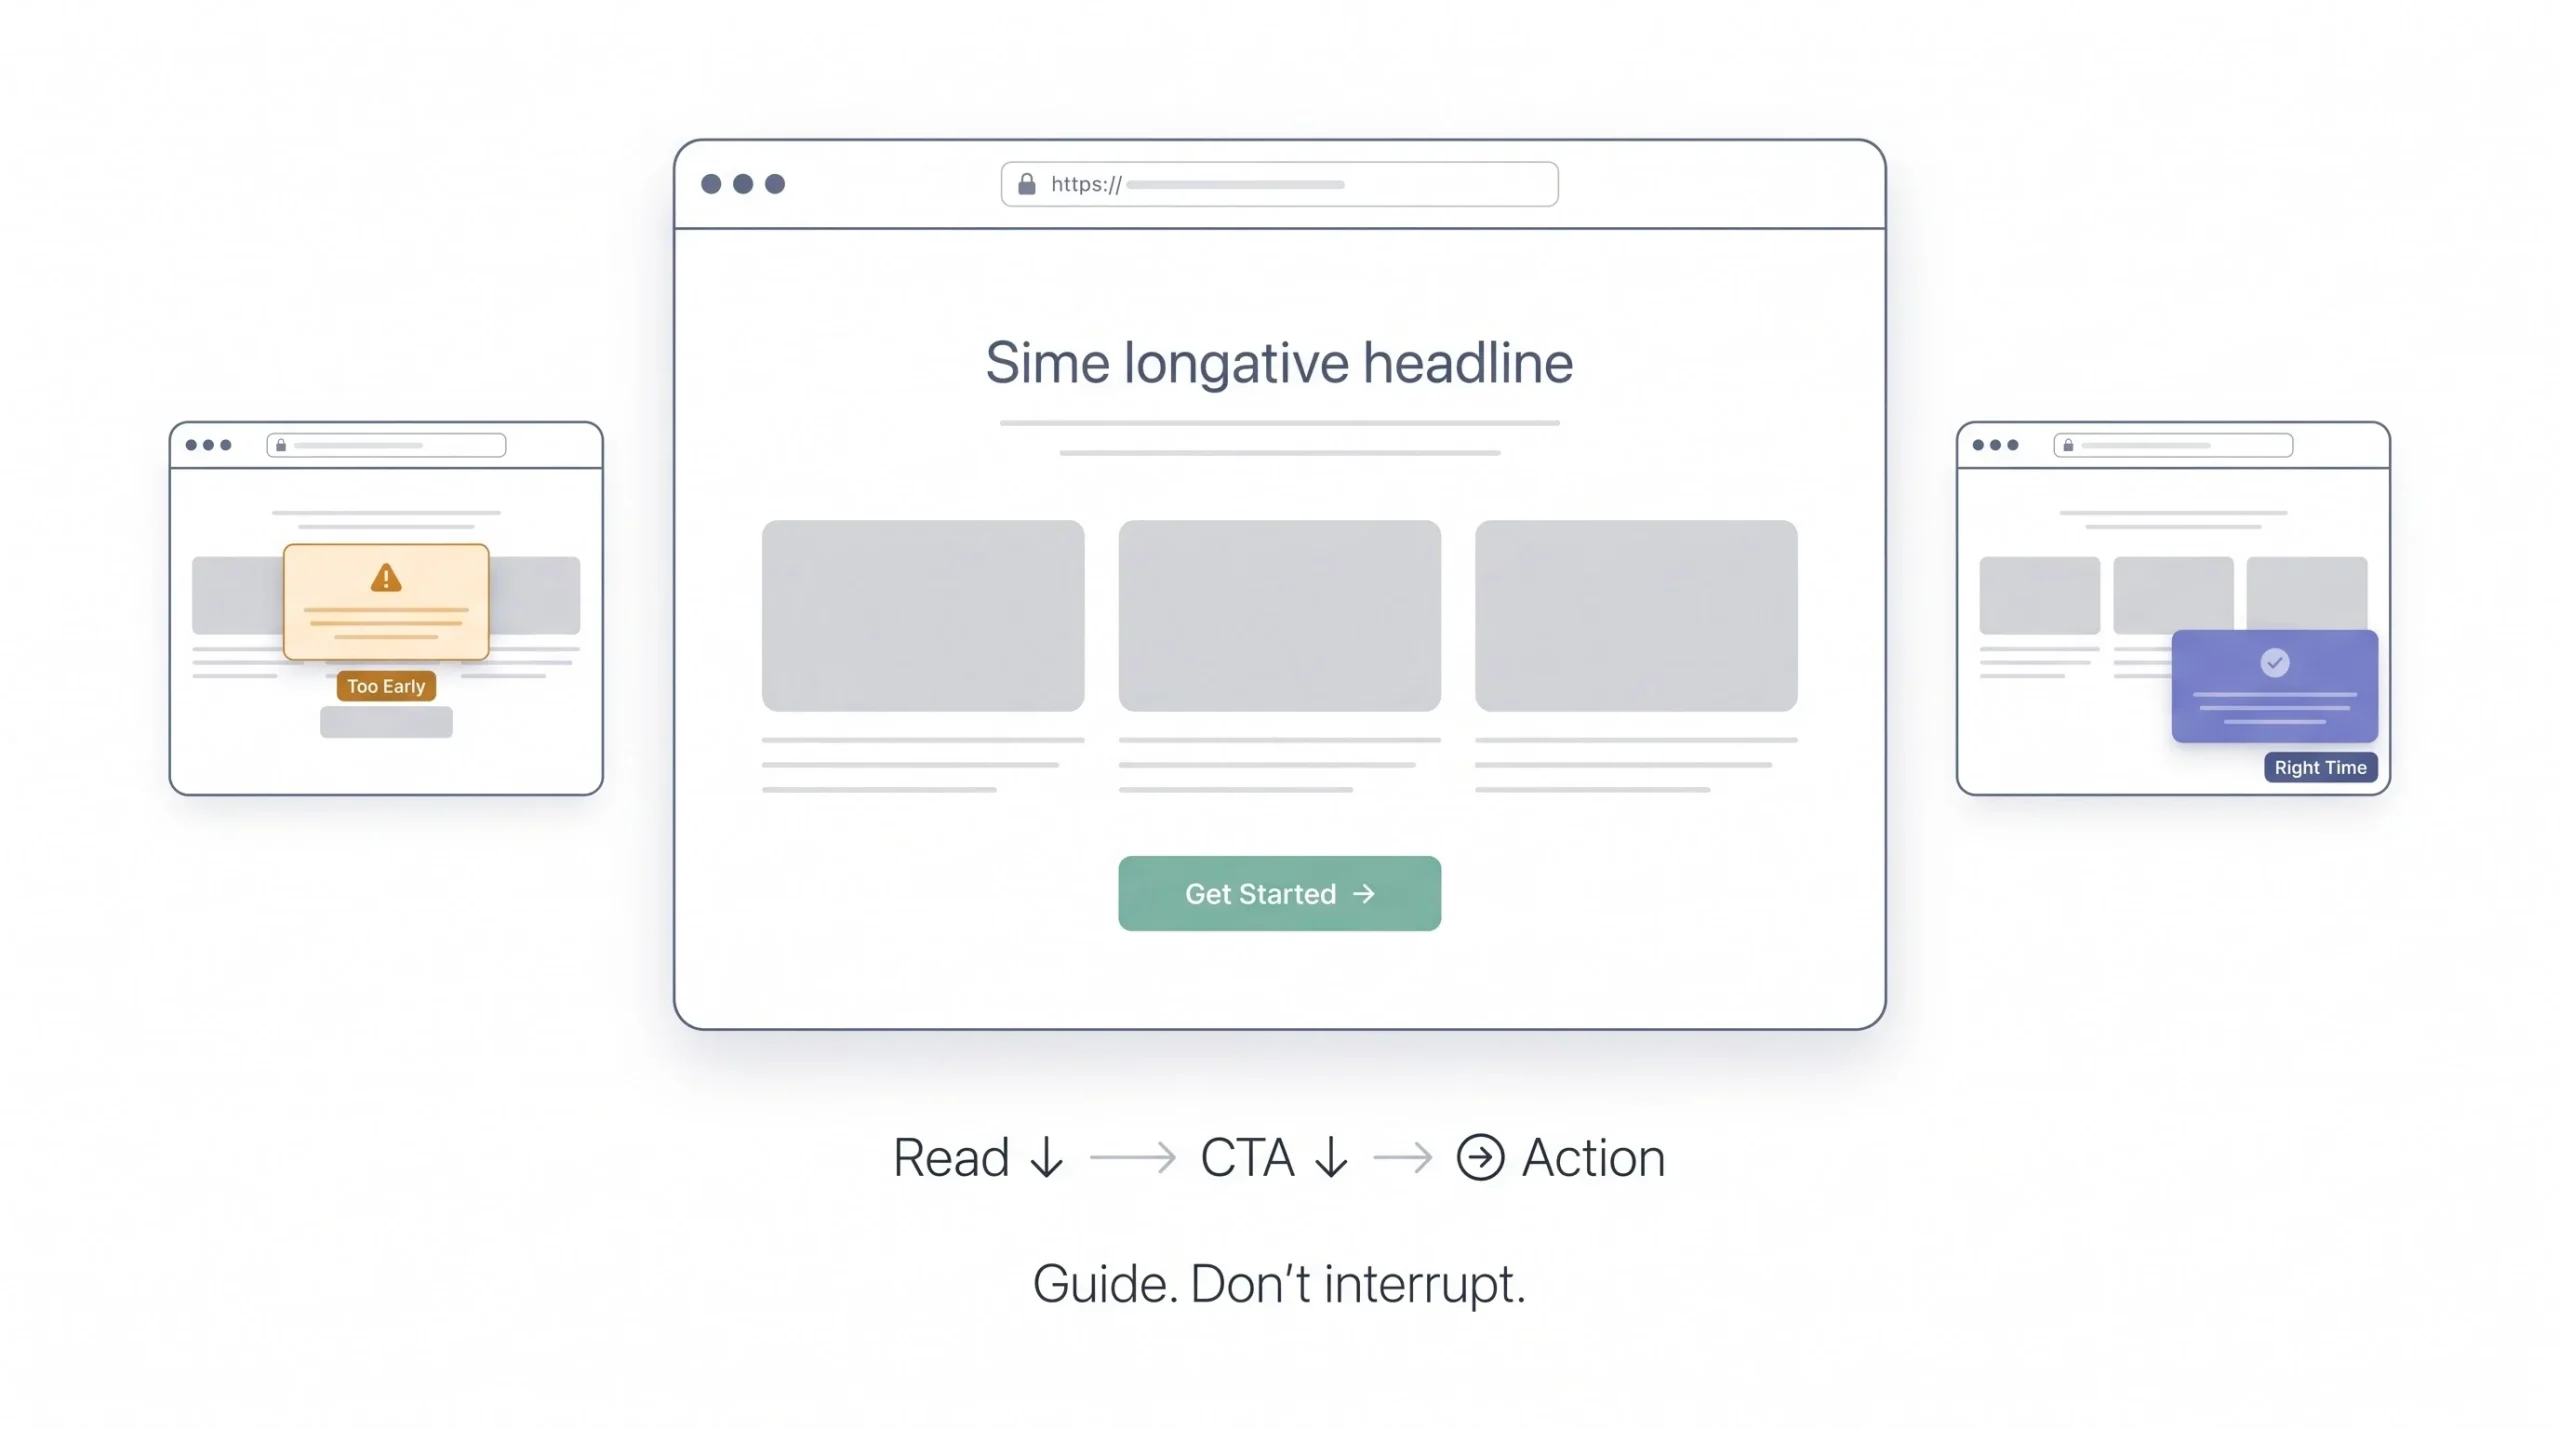
A page can nail everything else and still bleed visitors if there’s no clear next step. People don’t naturally guess what you want them to do. If it’s not obvious, most won’t bother figuring it out, they’ll just leave.
One primary call to action per page is usually the right approach. Not five competing buttons fighting for attention, one clear next step that matches the intent of the page.
Timing matters just as much as clarity. This is where a lot of sites shoot themselves in the foot. A popup that slams onto the screen the instant someone lands, before they’ve read a single sentence, does more harm than good. It interrupts before there’s any context for why the offer might even be relevant.
There’s a well-known example from Larry Kim, founder of WordStream and later MobileMonkey, who reported reducing bounce rate by as much as 60% using exit-intent popups instead of immediate ones. The difference wasn’t the popup itself, it was the timing. Exit-intent popups trigger when someone’s mouse moves toward the browser’s close or back button, which means the offer shows up right as someone’s about to leave anyway, rather than interrupting them while they’re still engaged.
Compare two approaches. One site throws a newsletter signup box in someone’s face the second the page loads. Another site waits, lets the visitor actually read the content, and only offers something relevant, like a related guide or a discount, when the visitor shows signs of leaving. The second approach respects the reader’s time, and it tends to convert better precisely because of that.
6. Optimize for Mobile and Technical Health
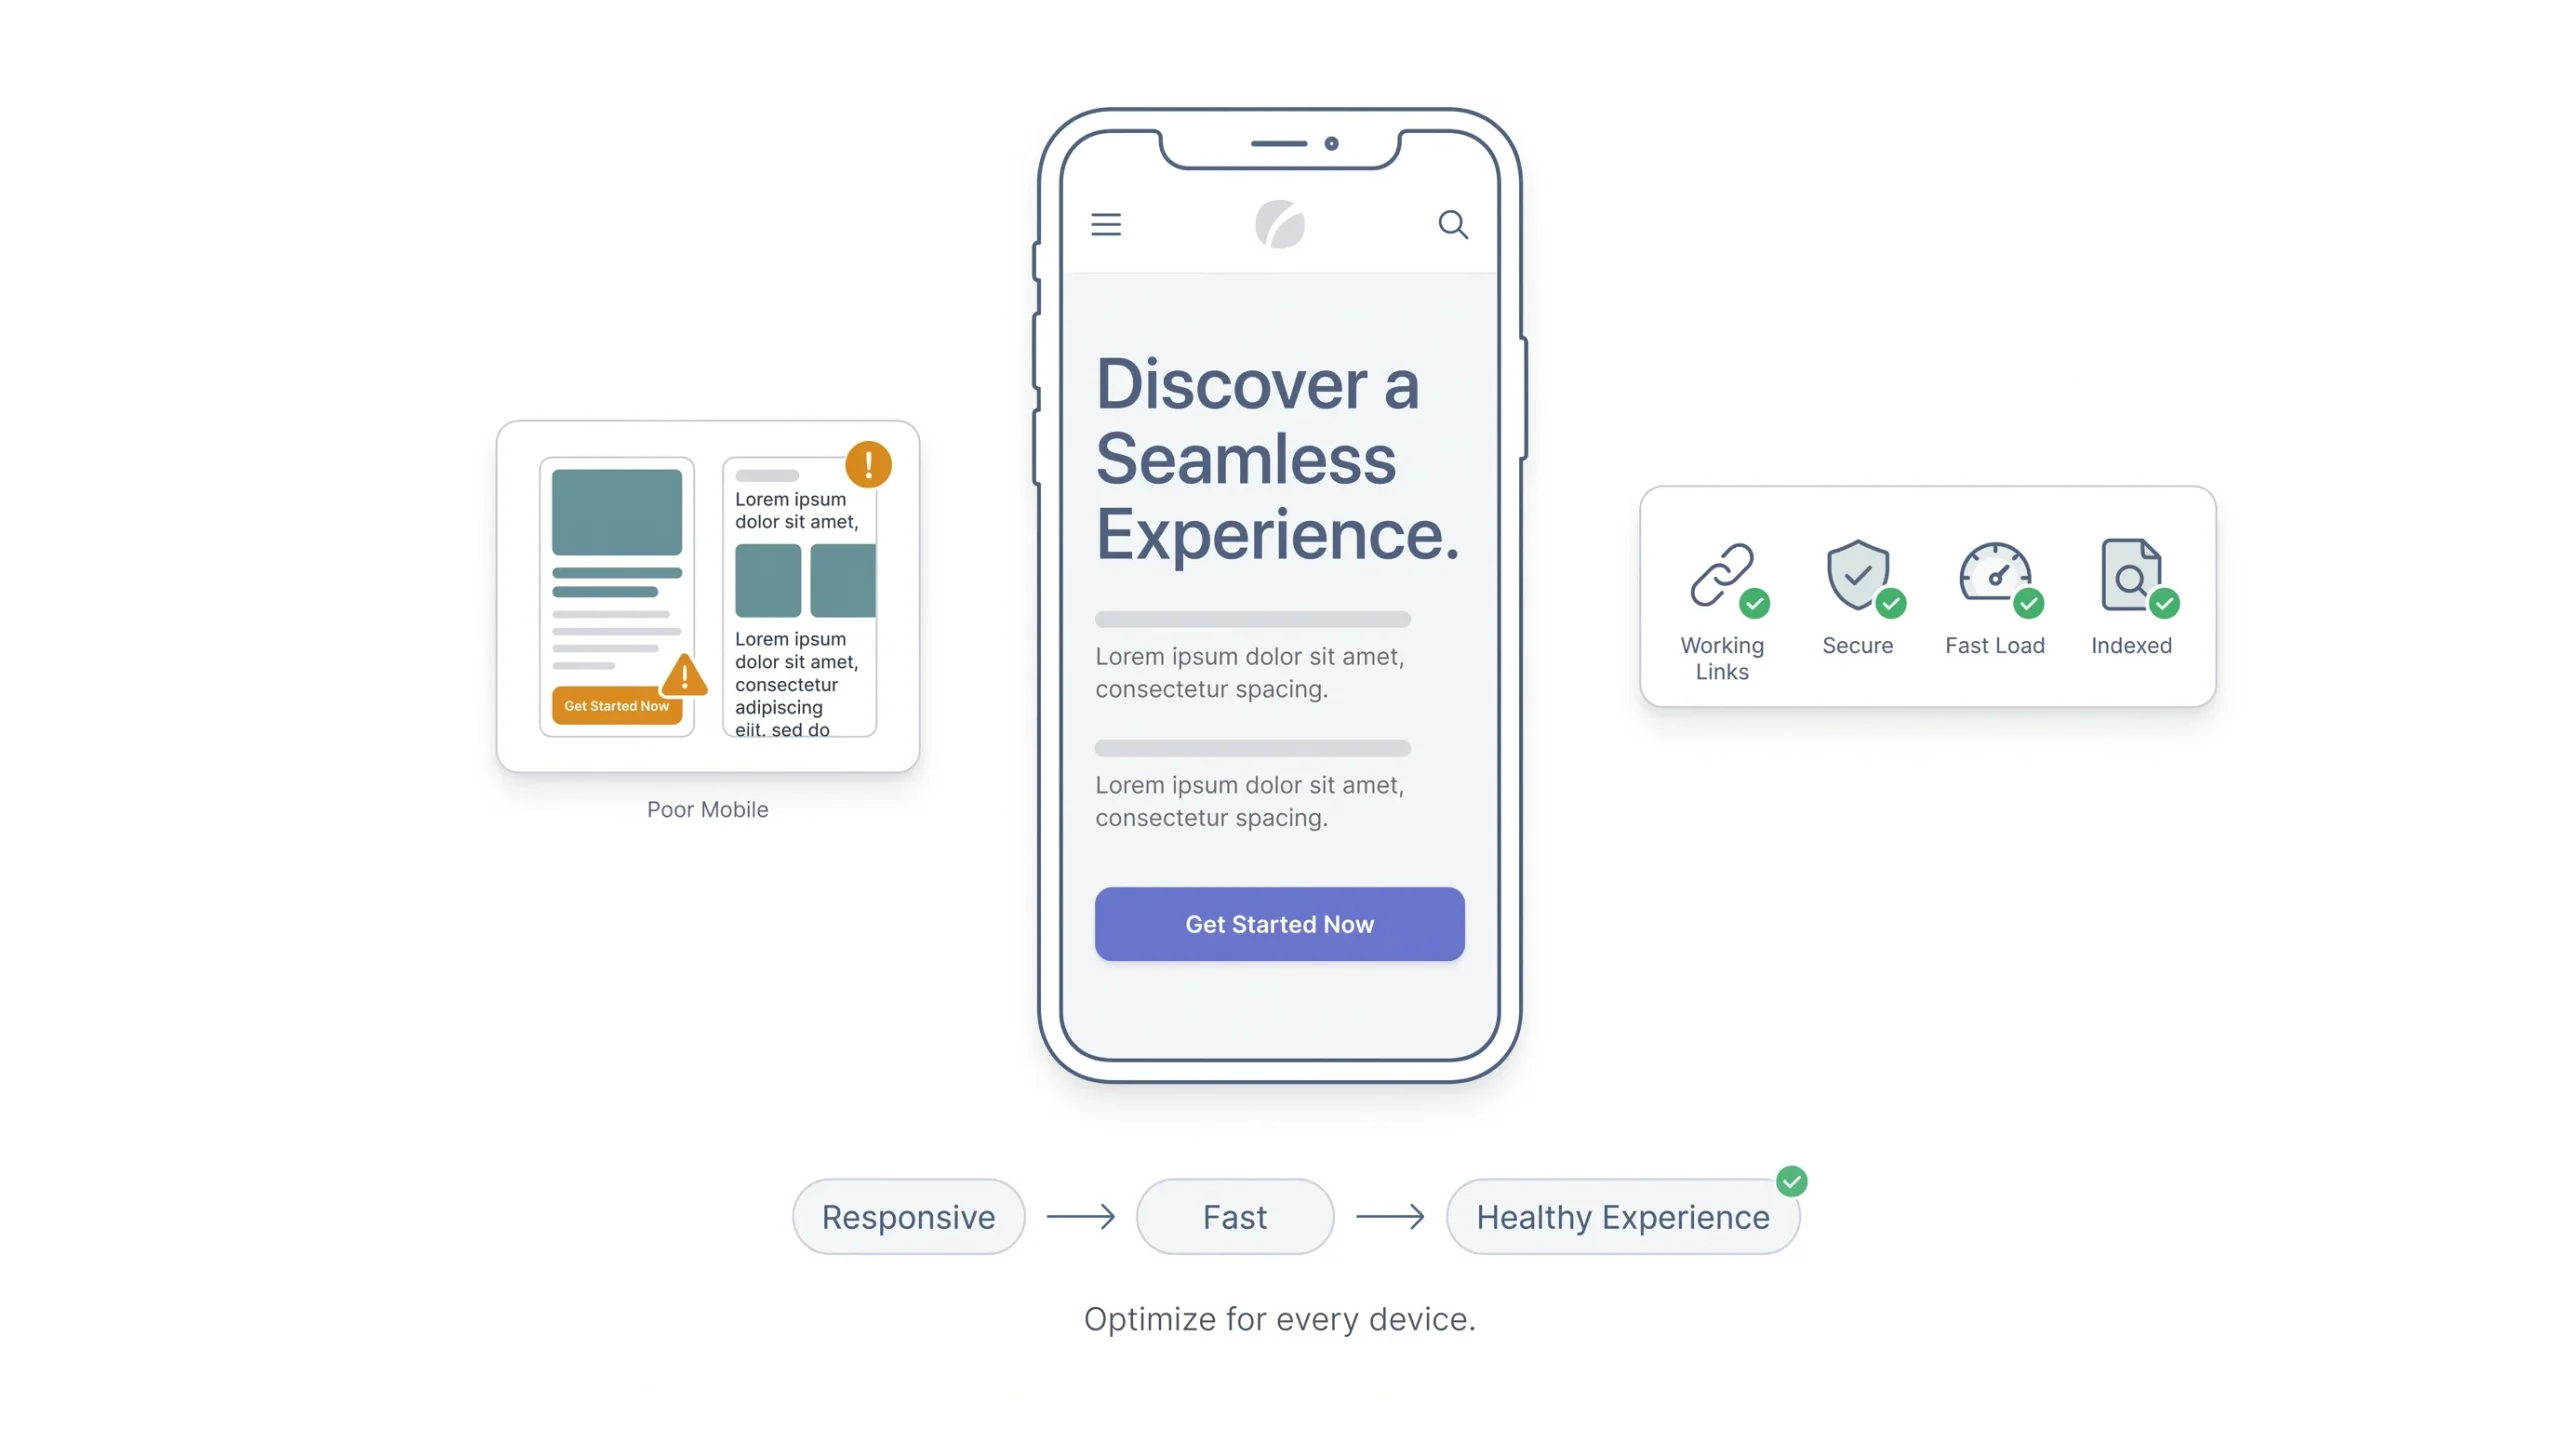
A huge chunk of traffic on most sites comes from phones, and if the mobile experience is even slightly broken, that shows up directly in bounce rate. Buttons too small to tap accurately, text that requires zooming, layouts that break on smaller screens. All of it pushes people away fast.
Responsive design needs to be checked specifically, not assumed. A site can look perfect on a designer’s laptop and still be a mess on an actual phone in someone’s hand. Tap target sizing matters here too. If a button is too small or too close to another clickable element, people misclick, get frustrated, and leave.
Mobile page speed deserves its own separate check as well, since mobile connections are often slower and less consistent than desktop broadband, especially outside major cities.
Broken links and 404 errors are another quiet source of lost visitors. Someone clicks through from a search result or an old backlink and lands on a dead page, and unless there’s something to catch them, they bounce immediately. A well-designed 404 page, one that actually offers a search bar or links to popular content instead of just saying “page not found,” can rescue a decent chunk of that traffic instead of losing it outright.
Google Search Console’s mobile usability report flags a lot of these issues automatically, and it’s worth checking regularly rather than only after a redesign.
How to Diagnose Your Own Bounce Rate Problem, Step-by-Step
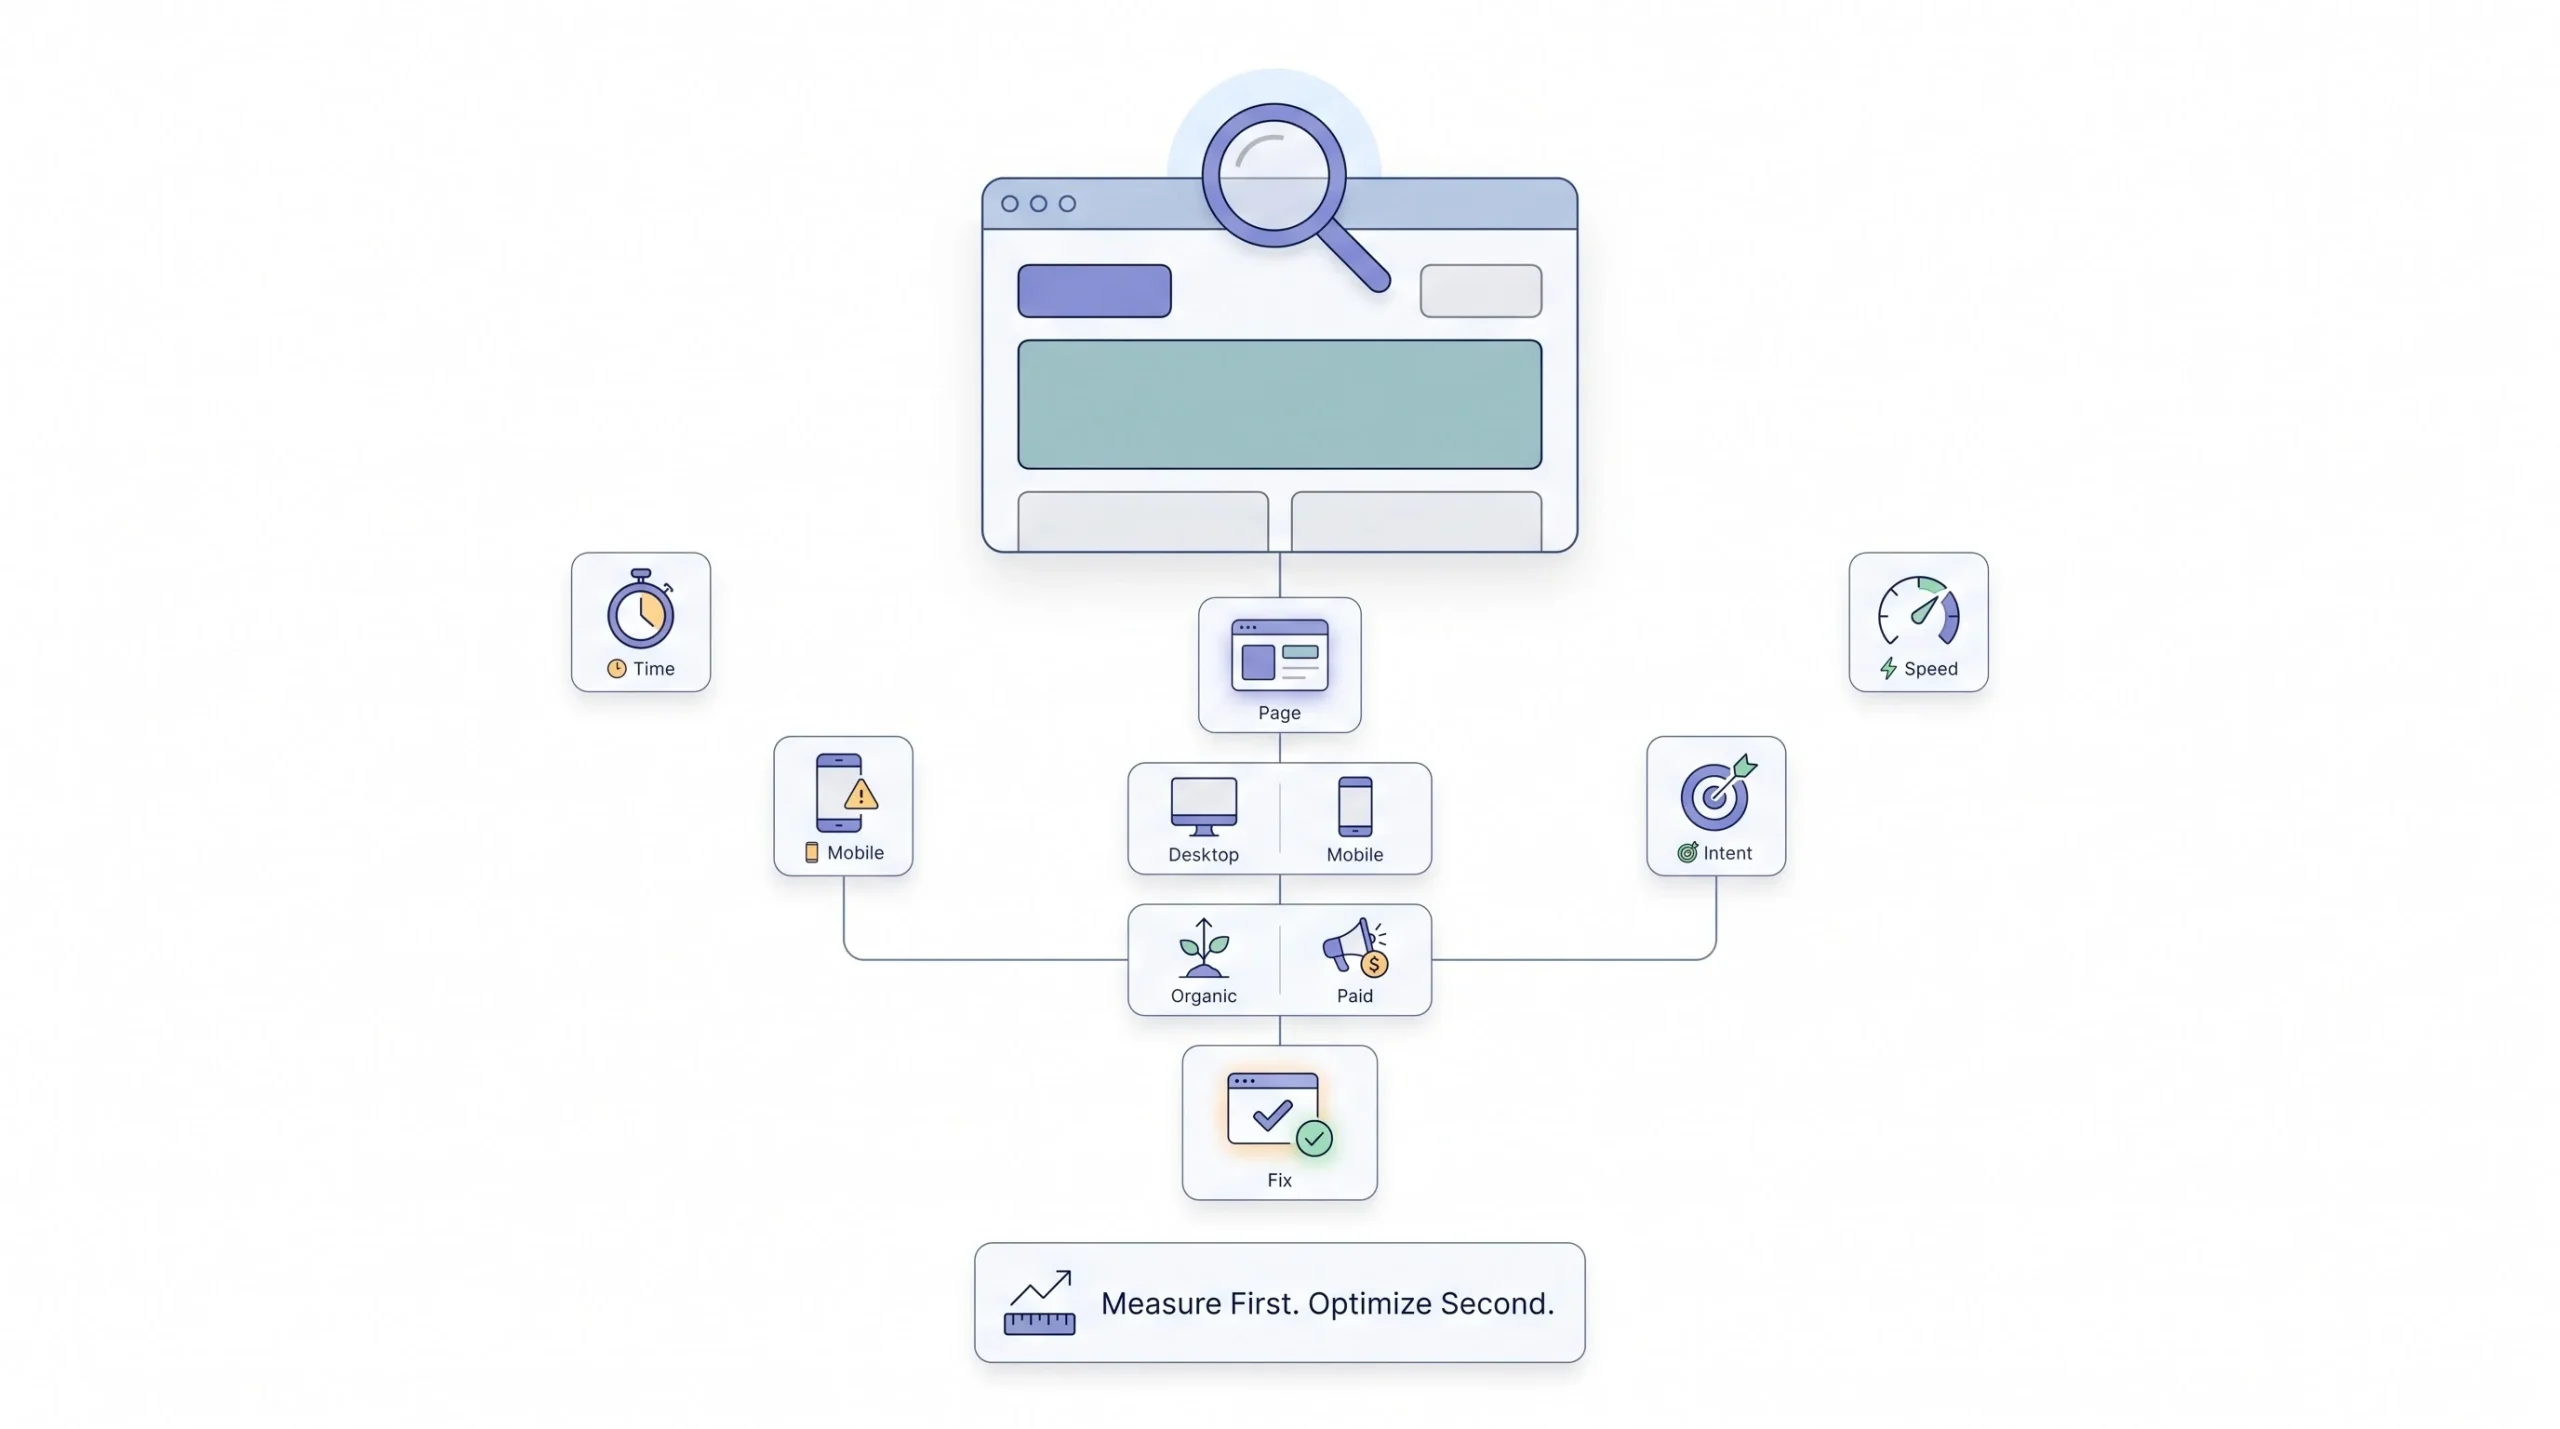
Instead of guessing which of the six fixes above applies, the smarter move is to actually walk through the data first. Open GA4 and look at bounce rate segmented by individual page, not the site-wide average, since the site-wide number hides way too much.
From there, break it down by device. If mobile bounce rate is significantly higher than desktop on the same page, that points straight toward a mobile UX or speed issue rather than a content problem. Then check traffic source. If bounce rate is high specifically from paid campaigns but reasonable from organic search, that’s a strong signal the ad copy and landing page aren’t lined up the way they should be.
Cross-reference whatever you find against the symptom table from earlier in this guide. High bounce with low time on page usually points toward speed or expectation mismatch. High bounce with high time on page is often completely fine, especially on content pages, and probably doesn’t need fixing at all.
The decision flow, in plain terms, looks something like this. If the bounce rate is high on a page meant to inform, and average time on page is also high, that’s likely a success story, not a problem, so leave it alone. If the bounce rate is high and time on page is low, check speed first, then check whether the page content actually matches what brought people there. If bounce rate is high specifically on mobile, check responsive design and mobile load speed before touching anything else. And if bounce rate is high specifically from one traffic source, compare that source’s messaging directly against the landing page before assuming the page itself is broken.
Tools to Track and Improve Bounce Rate
A handful of tools cover almost everything needed to diagnose and fix bounce rate issues, and each one answers a slightly different question.
| Tool | What it’s best for |
|---|---|
| Google Analytics 4 | Tracking engagement and bounce rate by page, device, and traffic source |
| Google Search Console | Mobile usability issues, indexing problems, and how pages appear in search |
| Hotjar or Microsoft Clarity | Heatmaps and session recordings that show exactly where people click, scroll, and drop off |
| PageSpeed Insights | Pinpointing specific speed bottlenecks on individual pages |
| Nelio or VWO | A/B testing different headlines, layouts, or CTAs to see what actually reduces bounce rate |
GA4 tells you where the problem is. Search Console tells you about technical and mobile issues. Session recording tools like Hotjar or Clarity show the actual human behavior behind the numbers, which is often the most eye-opening part of the whole process, watching someone land on a page and immediately scroll past the exact thing you thought was the highlight. Speed tools isolate loading issues, and A/B testing tools let you validate a fix before rolling it out everywhere.
Common Mistakes That Make Bounce Rate Worse
A few habits show up again and again, and they tend to make bounce rate worse rather than better, even when the intention behind them was good.
Chasing the raw number without checking intent is probably the biggest one. Someone sees a high bounce rate on a blog post that’s actually performing exactly as it should, panics, and starts making changes that hurt the content just to move a metric that didn’t need moving in the first place.
Overcorrecting is another common trap. Autoplay videos, popups that show up within two seconds of page load, aggressive newsletter overlays that block the content entirely. These tactics sometimes look like they’re “working” in isolation, but they often push people away faster than they retain them, especially on mobile where screen space is already tight.
Ignoring the mobile and desktop split leads to wasted effort too. Fixing something on desktop when the real issue lives entirely on mobile means the underlying problem never actually gets solved, it just looks slightly better in the site-wide average.
And treating every page the same way is probably the most common mistake of all. A landing page built for conversions and a blog post built for informing don’t follow the same rules, and applying landing page logic, like aggressive CTAs everywhere, to a blog post built for casual reading usually backfires. Different job, different rules. Trying to force one playbook onto every page on the site is exactly how you end up “fixing” something that was never broken in the first place.
Conclusion
Bounce rate isn’t a scoreboard, and it was never meant to be one. It’s a diagnostic signal, and like any diagnostic signal, it only means something once you understand the context behind it. A high number on a reference article might be the best possible outcome. That same number on a paid landing page might be costing real money every single day.
The mindset shift matters more than any individual tactic in this guide. Check context first. Segment by page type, device, and traffic source before assuming anything’s broken. Then, and only then, move to fixes, starting with speed and expectation matching since those two tend to carry the most weight. Everything else, readability, internal linking, CTA placement, mobile optimization, builds on top of that foundation.
Get that order right, and the fixes that follow actually stick instead of becoming another round of guesswork six months from now.
Frequently Asked Questions
What is a good bounce rate for a website?
There’s no single number that works across the board. Blog and content pages usually sit anywhere from 65% to 90% and that’s normal. Ecommerce homepages tend to run lower, somewhere between 20% and 45%, because people browse across multiple products in one visit. The right question isn’t “is my bounce rate low enough,” it’s “does this bounce rate match what this specific page is supposed to do.”
Does GA4 still show bounce rate?
Yes, but it’s not the headline metric anymore. GA4 leads with engagement rate, and bounce rate is just calculated as whatever’s left over, 100% minus engagement rate. You can still find it in the Engagement reports, and you can add it as a column if it’s not showing by default.
Is a high bounce rate always bad for SEO?
No, and this is where a lot of people get it wrong. Google has never confirmed bounce rate as a direct ranking factor. What actually matters more is whether people are getting a good experience, which bounce rate only partially reflects. A reference page that answers a question in ten seconds can have a sky-high bounce rate and still rank well, because it’s doing exactly what it’s supposed to do.
Why did my bounce rate suddenly drop after switching to GA4?
Almost certainly because of the definition change, not because your site improved. GA4 counts a session as “engaged” if it lasts 10 seconds or more, even with zero clicks. Universal Analytics didn’t give you that grace period. Same traffic, same content, different math.
What’s the difference between bounce rate and exit rate?
Bounce rate only counts single-page sessions with no interaction at all. Exit rate counts any session where a specific page happened to be the last one visited, regardless of how many pages came before it. A page can have a low bounce rate and still have a high exit rate if people usually visit it near the end of a longer browsing session.
How much does page speed actually affect bounce rate?
A lot. Google’s own research points to the three-second mark as the point where abandonment starts climbing fast. Past that, every extra second of load time is costing visitors who never even saw the page, so it’s genuinely one of the highest-leverage fixes on this whole list.
Can popups increase bounce rate?
They can, if the timing is wrong. A popup that appears the instant someone lands, before they’ve read anything, tends to push people away. Exit-intent popups, which trigger when someone’s about to leave anyway, work a lot better because they don’t interrupt the actual reading experience.
How do I check if my bounce rate problem is a mobile issue?
Segment bounce rate by device inside GA4. If mobile is noticeably higher than desktop on the same page, that’s a strong signal pointing toward responsive design, tap target sizing, or mobile page speed rather than a content problem. Google Search Console’s mobile usability report is worth checking too.
Should blog posts and landing pages be judged by the same bounce rate standard?
No. A blog post is often built to answer one question and a high bounce rate there can mean success. A landing page exists to move someone toward a specific action, so a high bounce rate on that kind of page is a much bigger red flag and usually points to a mismatch between the offer and the page itself.
How long does it take to see bounce rate improve after making changes?
It depends on traffic volume. High-traffic pages can show meaningful shifts within a couple of weeks. Lower-traffic pages need more time before the data is reliable enough to draw conclusions from, so it’s worth resisting the urge to judge a fix after just a few days.
Does internal linking really reduce bounce rate?
Yes, and it’s one of the easier fixes to implement since it doesn’t touch design or hosting. If there’s nothing relevant to click after someone finishes reading, leaving is the default. A few genuinely relevant contextual links inside the content give people an obvious next step instead.
Is it possible to have too high a bounce rate but still have a healthy website?
Absolutely. Reference-style content, single-answer articles, and pages designed to solve one specific problem fast can carry very high bounce rates while still doing exactly what they were built to do. The number only becomes a real concern when it’s paired with a page that has a clear conversion goal it isn’t hitting.