


Somebody on your team just pulled up PageSpeed Insights, watched the number load, and made a face. You know the face. Then the questions started. Should we fix this now or later? Is this actually costing us money, or is it just a tool yelling numbers at us for no real reason?
Here’s the honest answer. It’s costing you money. And it’s costing you rankings too, though not in the dramatic “Google slapped you with a penalty” way people love to imagine. Speed doesn’t work like a switch that gets flipped one day. It works more like a slow leak in a tire. You don’t notice it in the first hour. You notice it three weeks later when you’re wondering why the ride feels off. Visitors trickle away before they read your content. Some of them never even see the hero image finish loading, they’re gone before it shows up. Google notices that pattern over time, across thousands of visits, and quietly adjusts how it treats your site. None of this happens in one dramatic moment. It happens every single day, in tiny increments, until someone finally opens the analytics and asks where the traffic went.
Look, this isn’t a “nice to have” topic anymore. Page experience has been baked into how Google evaluates sites for years now, and honestly, most site owners still treat speed like an afterthought, something you glance at once and never touch again. That’s exactly why it’s worth doing properly. This post walks through what website speed actually means, how it touches SEO, how it touches conversions, how to measure it without guessing, what’s actually dragging your site down, and what to do about it. No vague “optimize your site” filler that says nothing. Just the real mechanics, explained the way someone would explain it to a friend who just started paying attention.
What “Website Speed” Actually Means
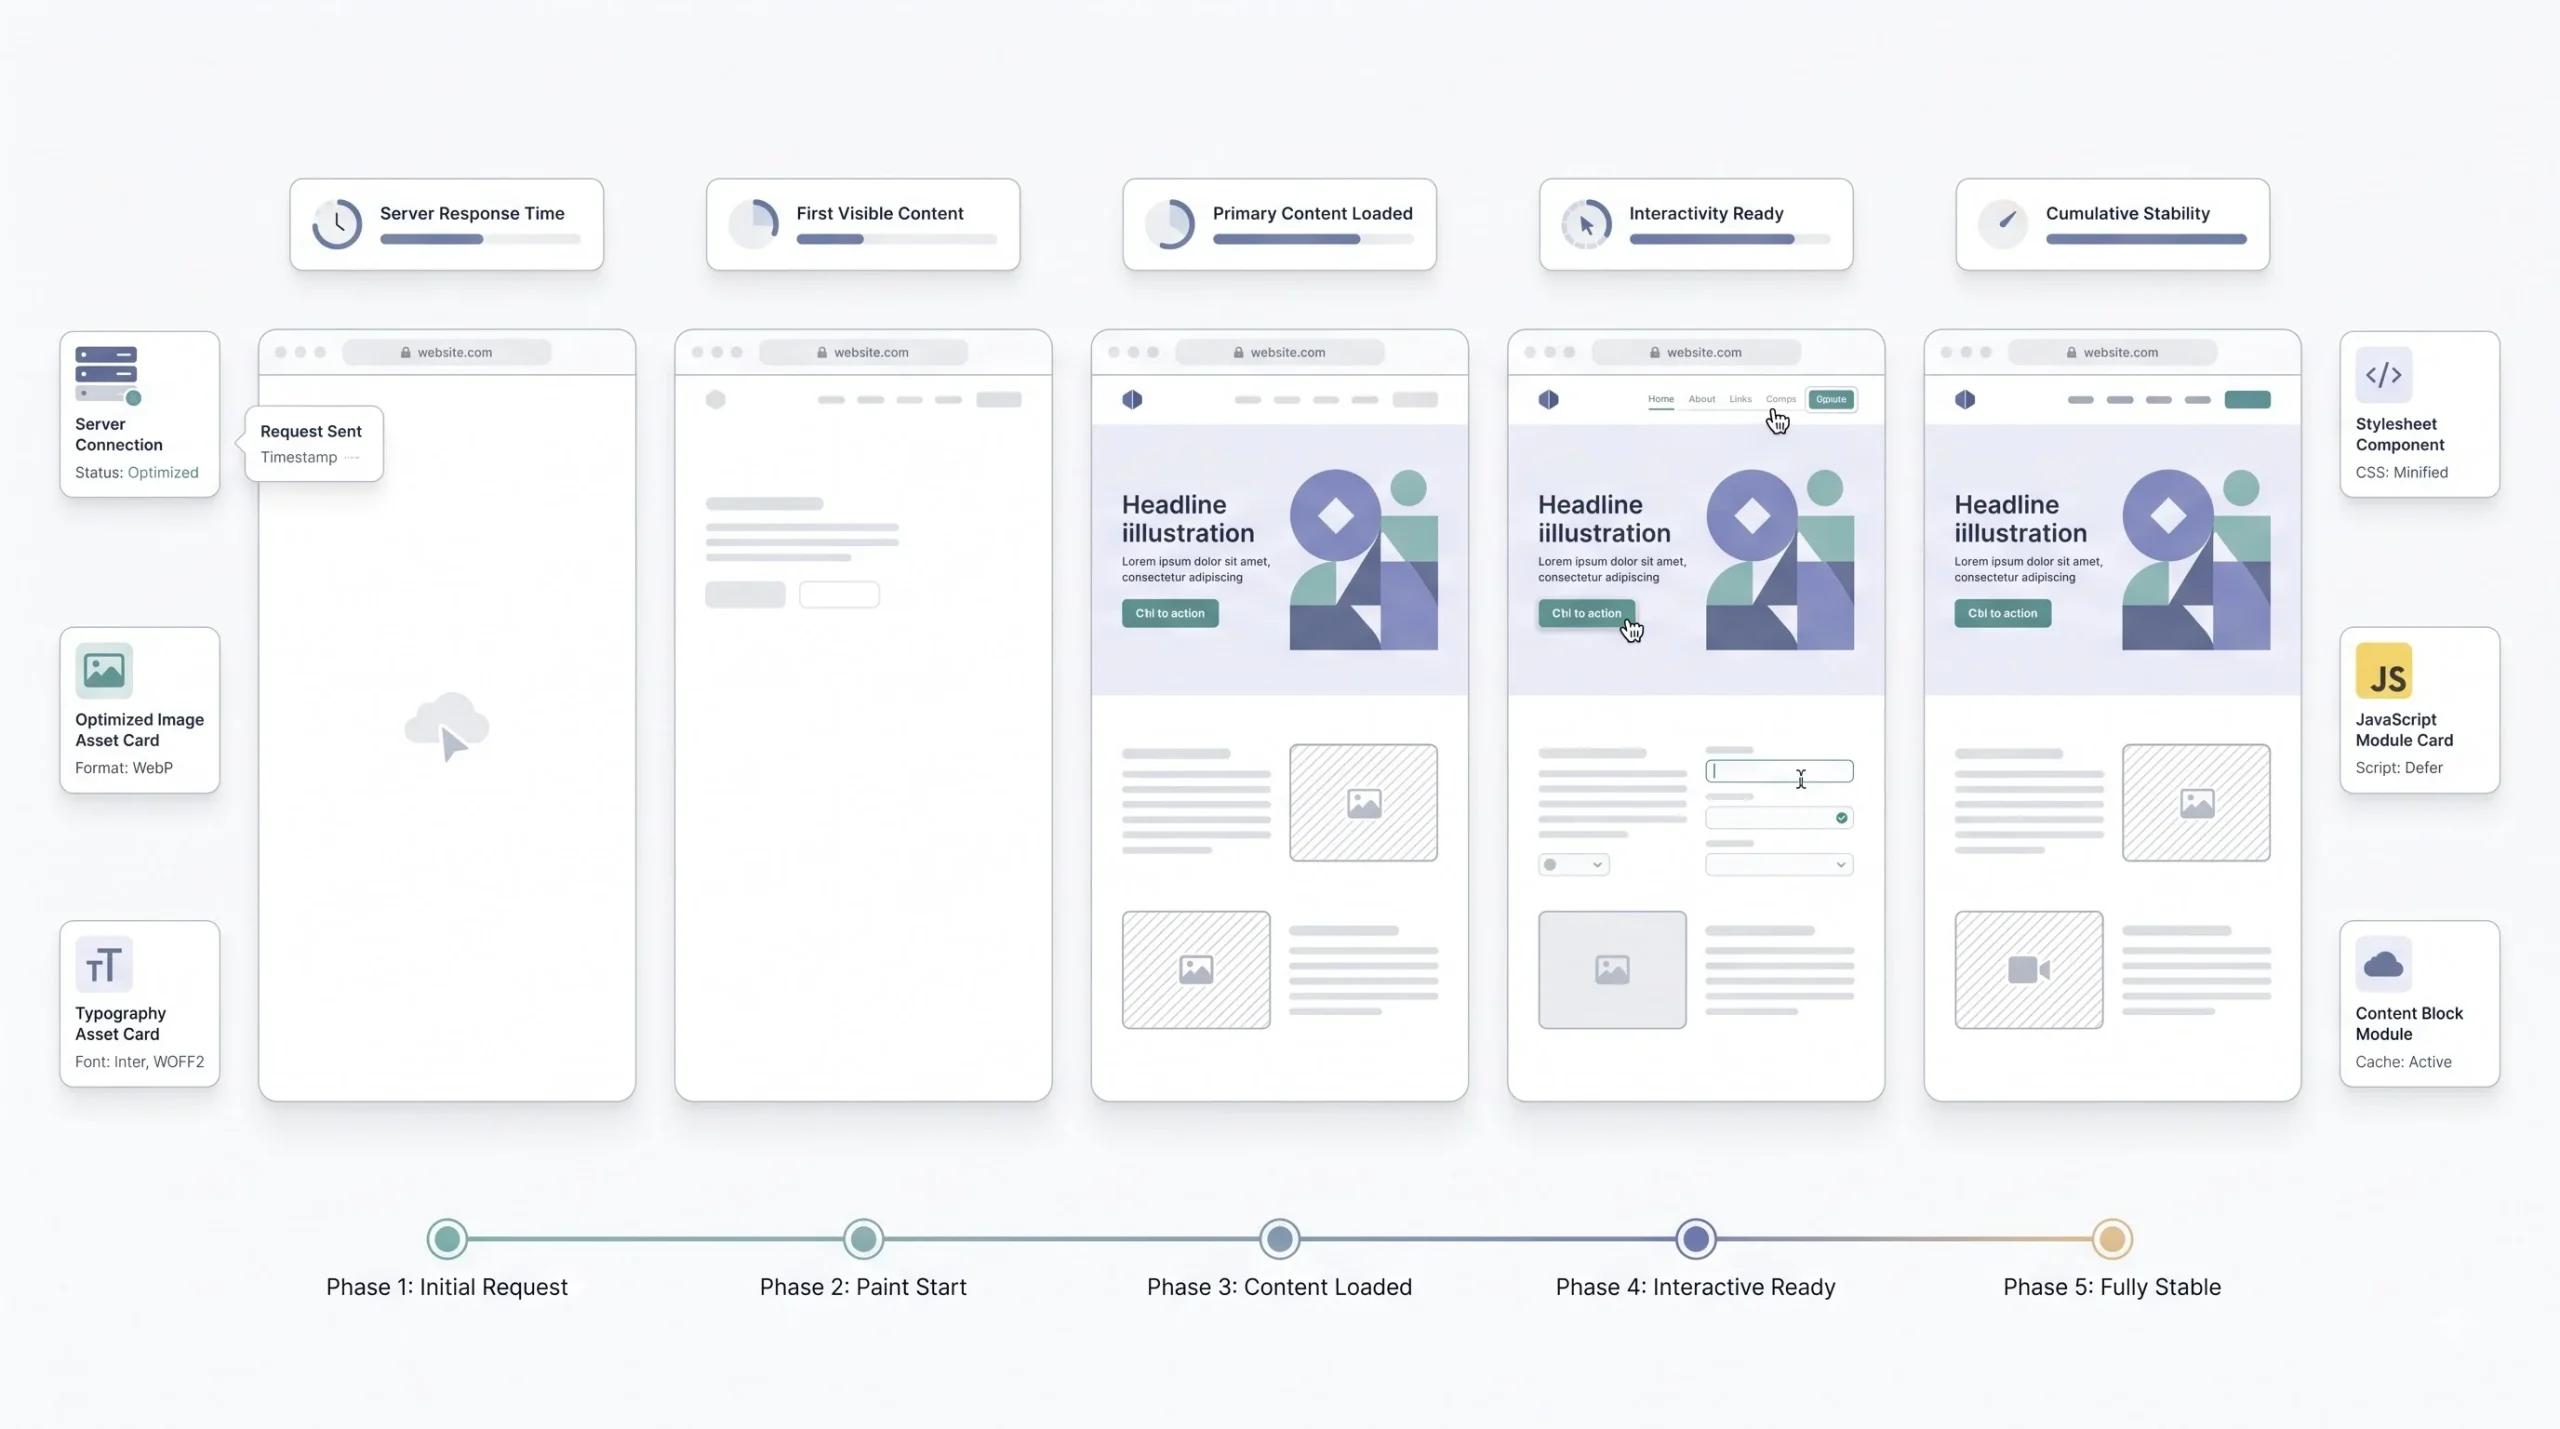
Most people say “my site is slow” like it’s one single problem. It’s not. Speed is actually a handful of separate moments stacked on top of each other, and each one matters for a different reason. Miss that, and you end up fixing the wrong thing, or worse, fixing something that was never broken in the first place.
Think about what happens the second someone clicks a link to your site. Their browser has to ask your server for the page. That takes time. The server has to respond. Then the browser starts painting stuff on screen, piece by piece, not all at once. Then, eventually, the page becomes something the visitor can actually click and scroll and use without it lagging behind their thumb. Every one of those steps has its own name and its own number attached to it, and honestly, once you learn these five, half the confusing speed jargon out there starts making sense.
- TTFB (Time to First Byte) — how long it takes your server to respond after someone requests a page. Slow hosting, an overloaded server, or a bloated backend all show up here first. This one matters more than people give it credit for, because everything else on this list happens after TTFB. A bad TTFB drags the entire experience down before a single pixel shows up on screen.
- FCP (First Contentful Paint) — the moment something, anything, appears. Text, a background color, a logo in the corner. This is the first proof to a visitor that the page is alive and not just a blank white screen staring back at them.
- LCP (Largest Contentful Paint) — the moment the biggest, most important chunk of content finishes loading. Usually a hero image, a big headline block, or a large product photo. This is the one Google actually leans on the most, because it’s meant to represent the moment a page feels loaded to a real human being, not just technically finished.
- TTI (Time to Interactive) — when the page stops looking done and actually starts working. You’ve had this happen. Page looks finished, you tap a button, nothing happens for a beat or two. That gap is TTI.
- CLS (Cumulative Layout Shift) — less about speed, more about stability. It’s what happens when you’re about to tap something and the whole page jumps because an ad or an image finally loaded and shoved everything else down. Infuriating, right? Google puts a number on that annoyance.
| Metric | What It Measures | Good Score | Why It Matters |
|---|---|---|---|
| TTFB | Server response time | Under 0.8s | First domino in the whole load sequence |
| FCP | First visual content | Under 1.8s | User’s first sign the page is alive |
| LCP | Main content visible | Under 2.5s | Core Web Vital, ranking factor |
| CLS | Layout stability | Under 0.1 | Prevents rage clicks and misclicks |
| TTI | Page becomes usable | Under 3.8s | Determines when users can actually act |
None of these numbers mean much sitting alone. Together, they decide two things. Whether Google trusts your page enough to rank it well, and whether a real visitor sticks around long enough to actually do something, buy, read, sign up, whatever the page was built for. That’s the whole game, really. Keep these five in your back pocket, because everything below is built on them.
A one-second delay somewhere in this chain doesn’t register as “one second” to a visitor. It registers as “something’s broken here.”
Core Web Vitals and Google’s Stance on Speed
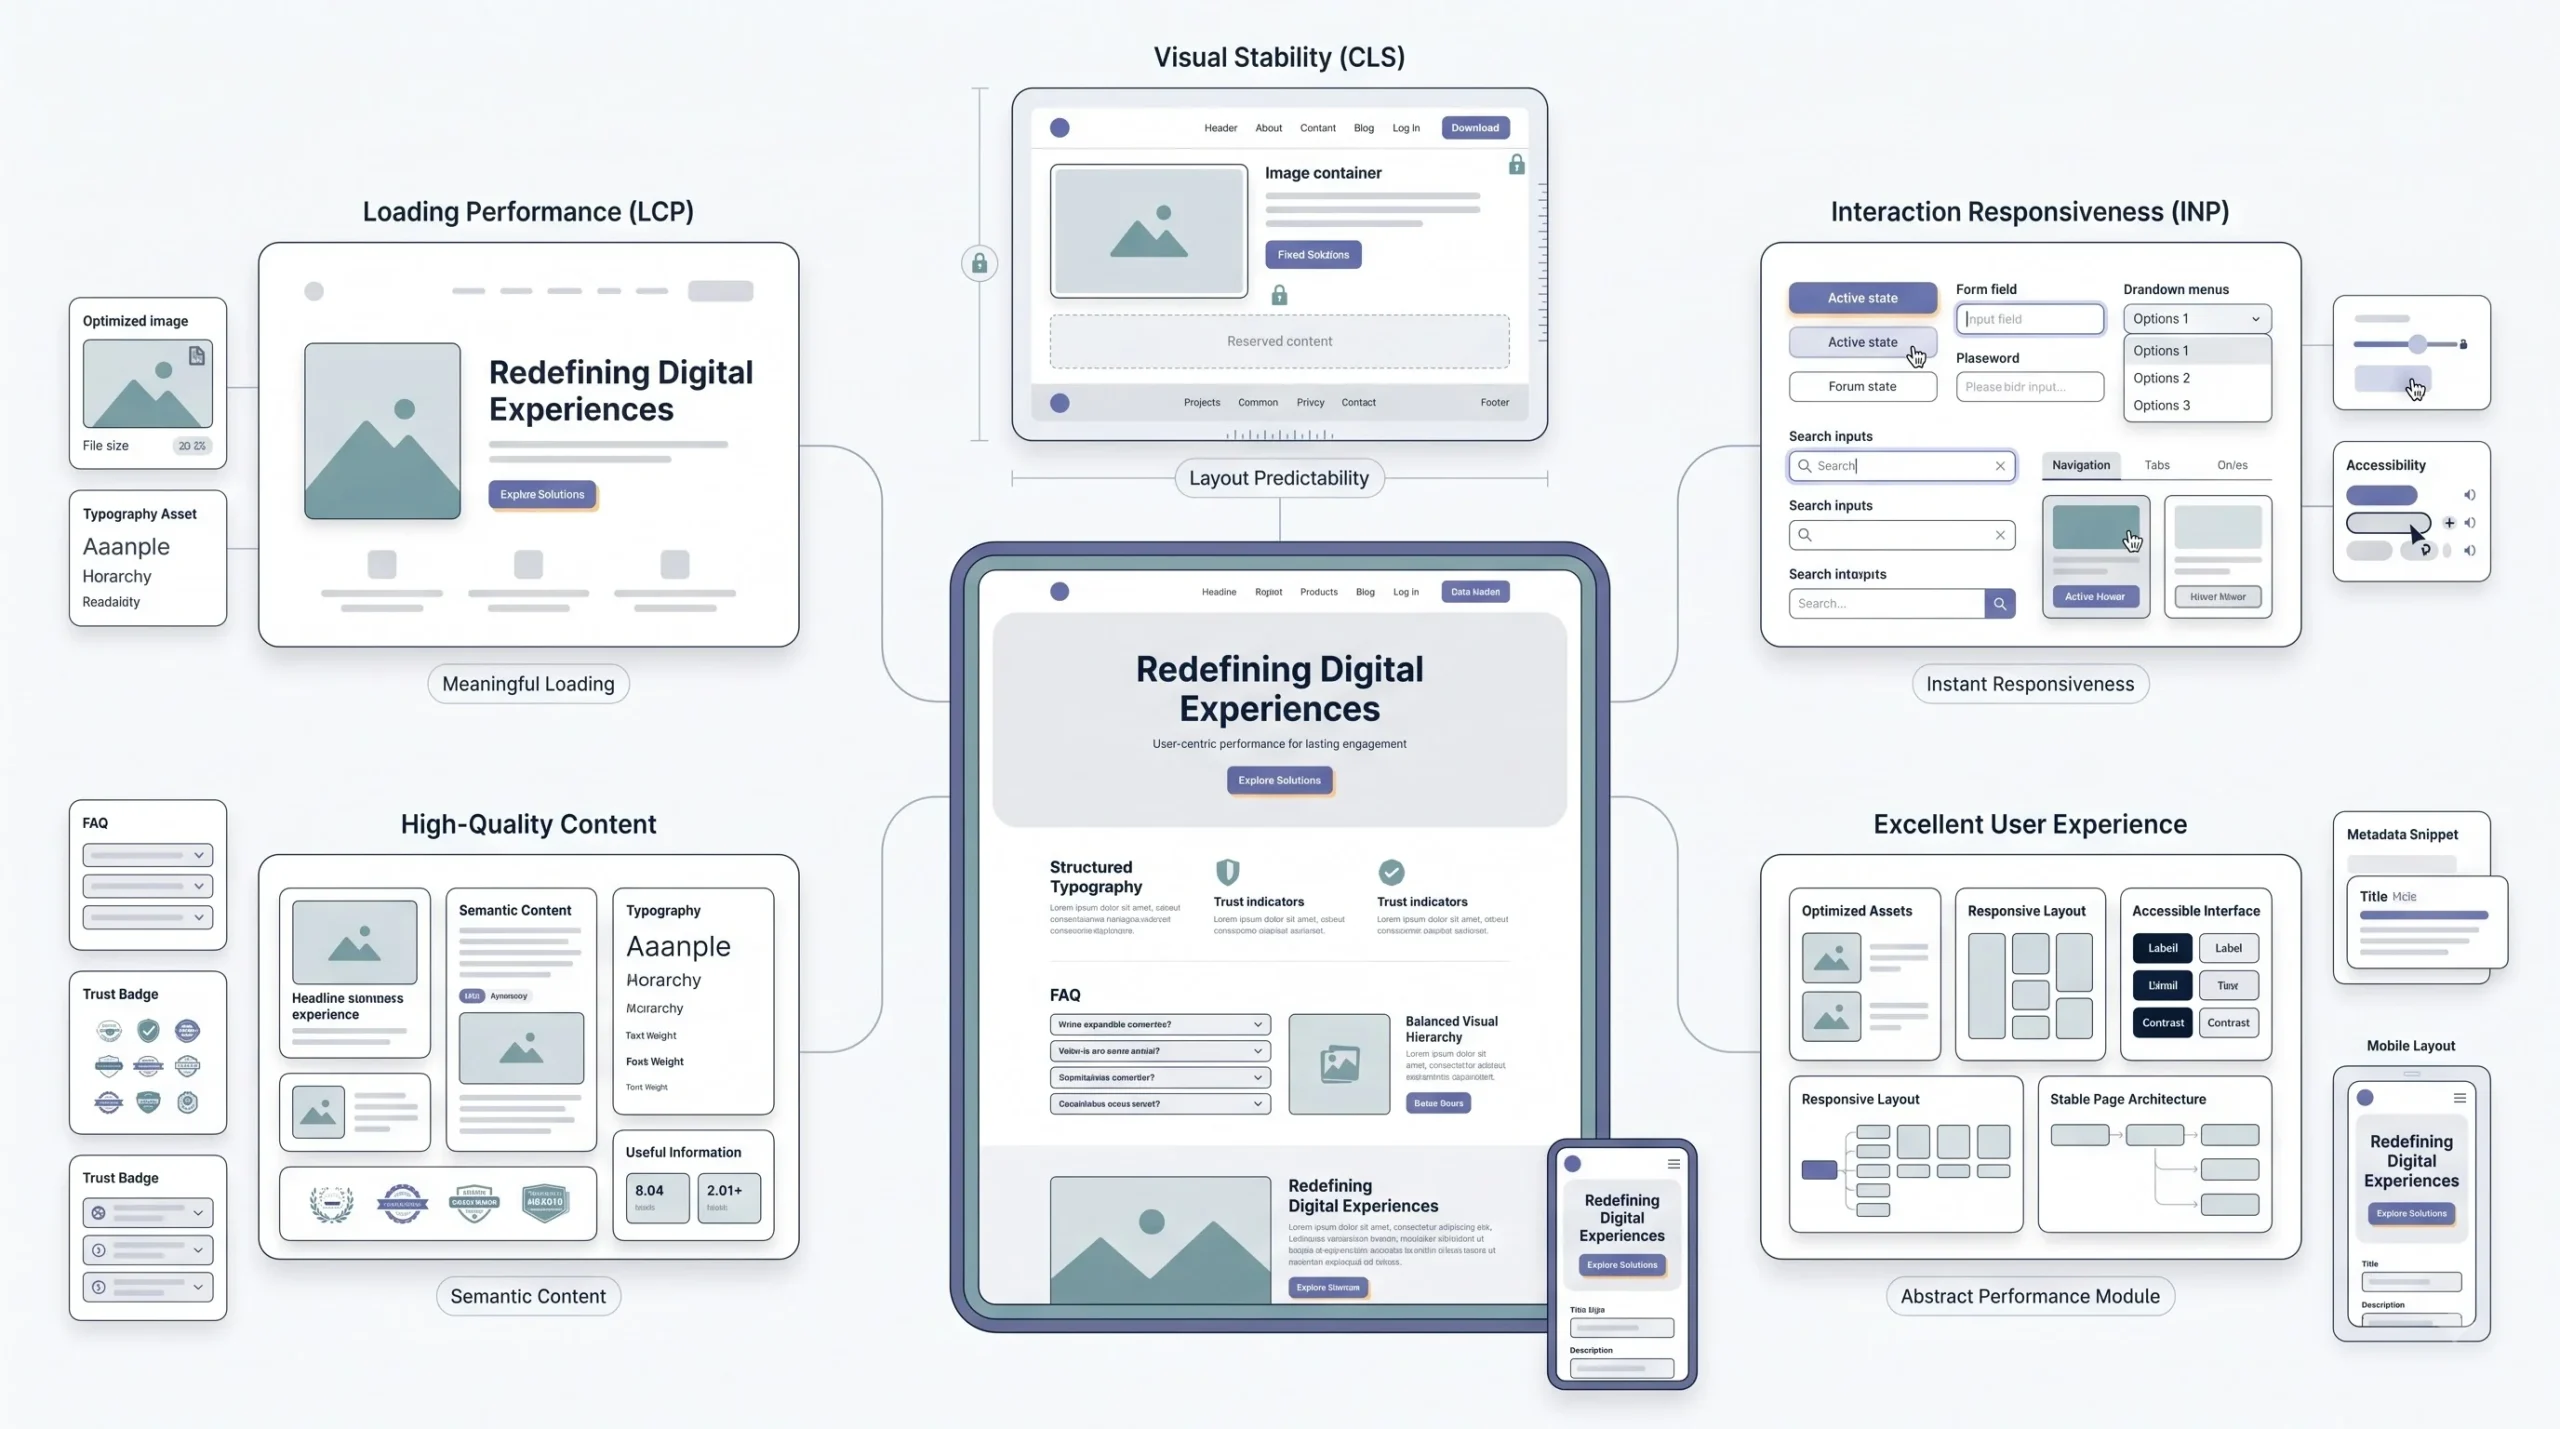
Google didn’t wake up one day and randomly decide speed was important. They built an actual, named scorecard around it, called Core Web Vitals. It’s made up of three metrics, LCP and CLS from the list above, plus a newer one called INP, which measures how responsive a page feels when someone actually interacts with it, clicking, tapping, typing. INP replaced an older metric called FID a while back because it does a better job capturing what interactions actually feel like across a full visit, not just the first click.
Now here’s where people get it twisted. Speed is not the biggest ranking factor. Never has been, probably never will be. Content relevance, backlinks, matching what the searcher actually wants, all of that still carries more weight in the ranking equation. But speed works differently than a typical ranking factor. It behaves more like a threshold you need to clear. Fall below it and Google starts treating your page like it’s fighting uphill, even when the content itself is genuinely good. Clear it comfortably, and speed basically steps out of the way and lets your content do the actual work of ranking.
Then there’s the indirect stuff, and honestly, this might matter even more than the direct signal. Slow pages push people to hit back faster than they otherwise would. That behavior gets read by Google as “this page didn’t satisfy the search.” Do that across enough visitors, enough times, and rankings start sliding, not because Google penalized a speed score directly, but because your own visitors, through nothing but their behavior, told Google something was off.
Mobile makes all of this sharper. Most of your traffic is probably coming from a phone. Google evaluates the mobile version of your site first now, that’s what “mobile-first indexing” actually means, the mobile version is basically the version that counts. And mobile networks are nowhere near as consistent as home wifi or office broadband. A site that feels perfectly snappy on a laptop plugged into fiber can feel painfully sluggish on a phone bouncing between two bars of signal. Google knows this reality exists, which is exactly why mobile speed carries its own separate weight in how a site gets judged.
Where do you actually check these numbers? PageSpeed Insights gives you the fastest single-page snapshot. Search Console has a Core Web Vitals report that shows how real visitors experienced your entire site over time, not just one test run. GTmetrix goes deeper if you want the full breakdown. More on how to actually use these properly a bit later.
Google isn’t ranking fast sites higher just because they’re fast. It’s ranking sites that don’t frustrate people. Speed happens to be the easiest thing to measure that lines up with a good experience. That’s the whole reason it’s there.
How Site Speed Impacts SEO
“Speed affects SEO” is the kind of sentence that sounds true but teaches you nothing on its own. So let’s actually pull it apart, piece by piece, and look at what’s really happening underneath.
Crawl Budget and Indexing
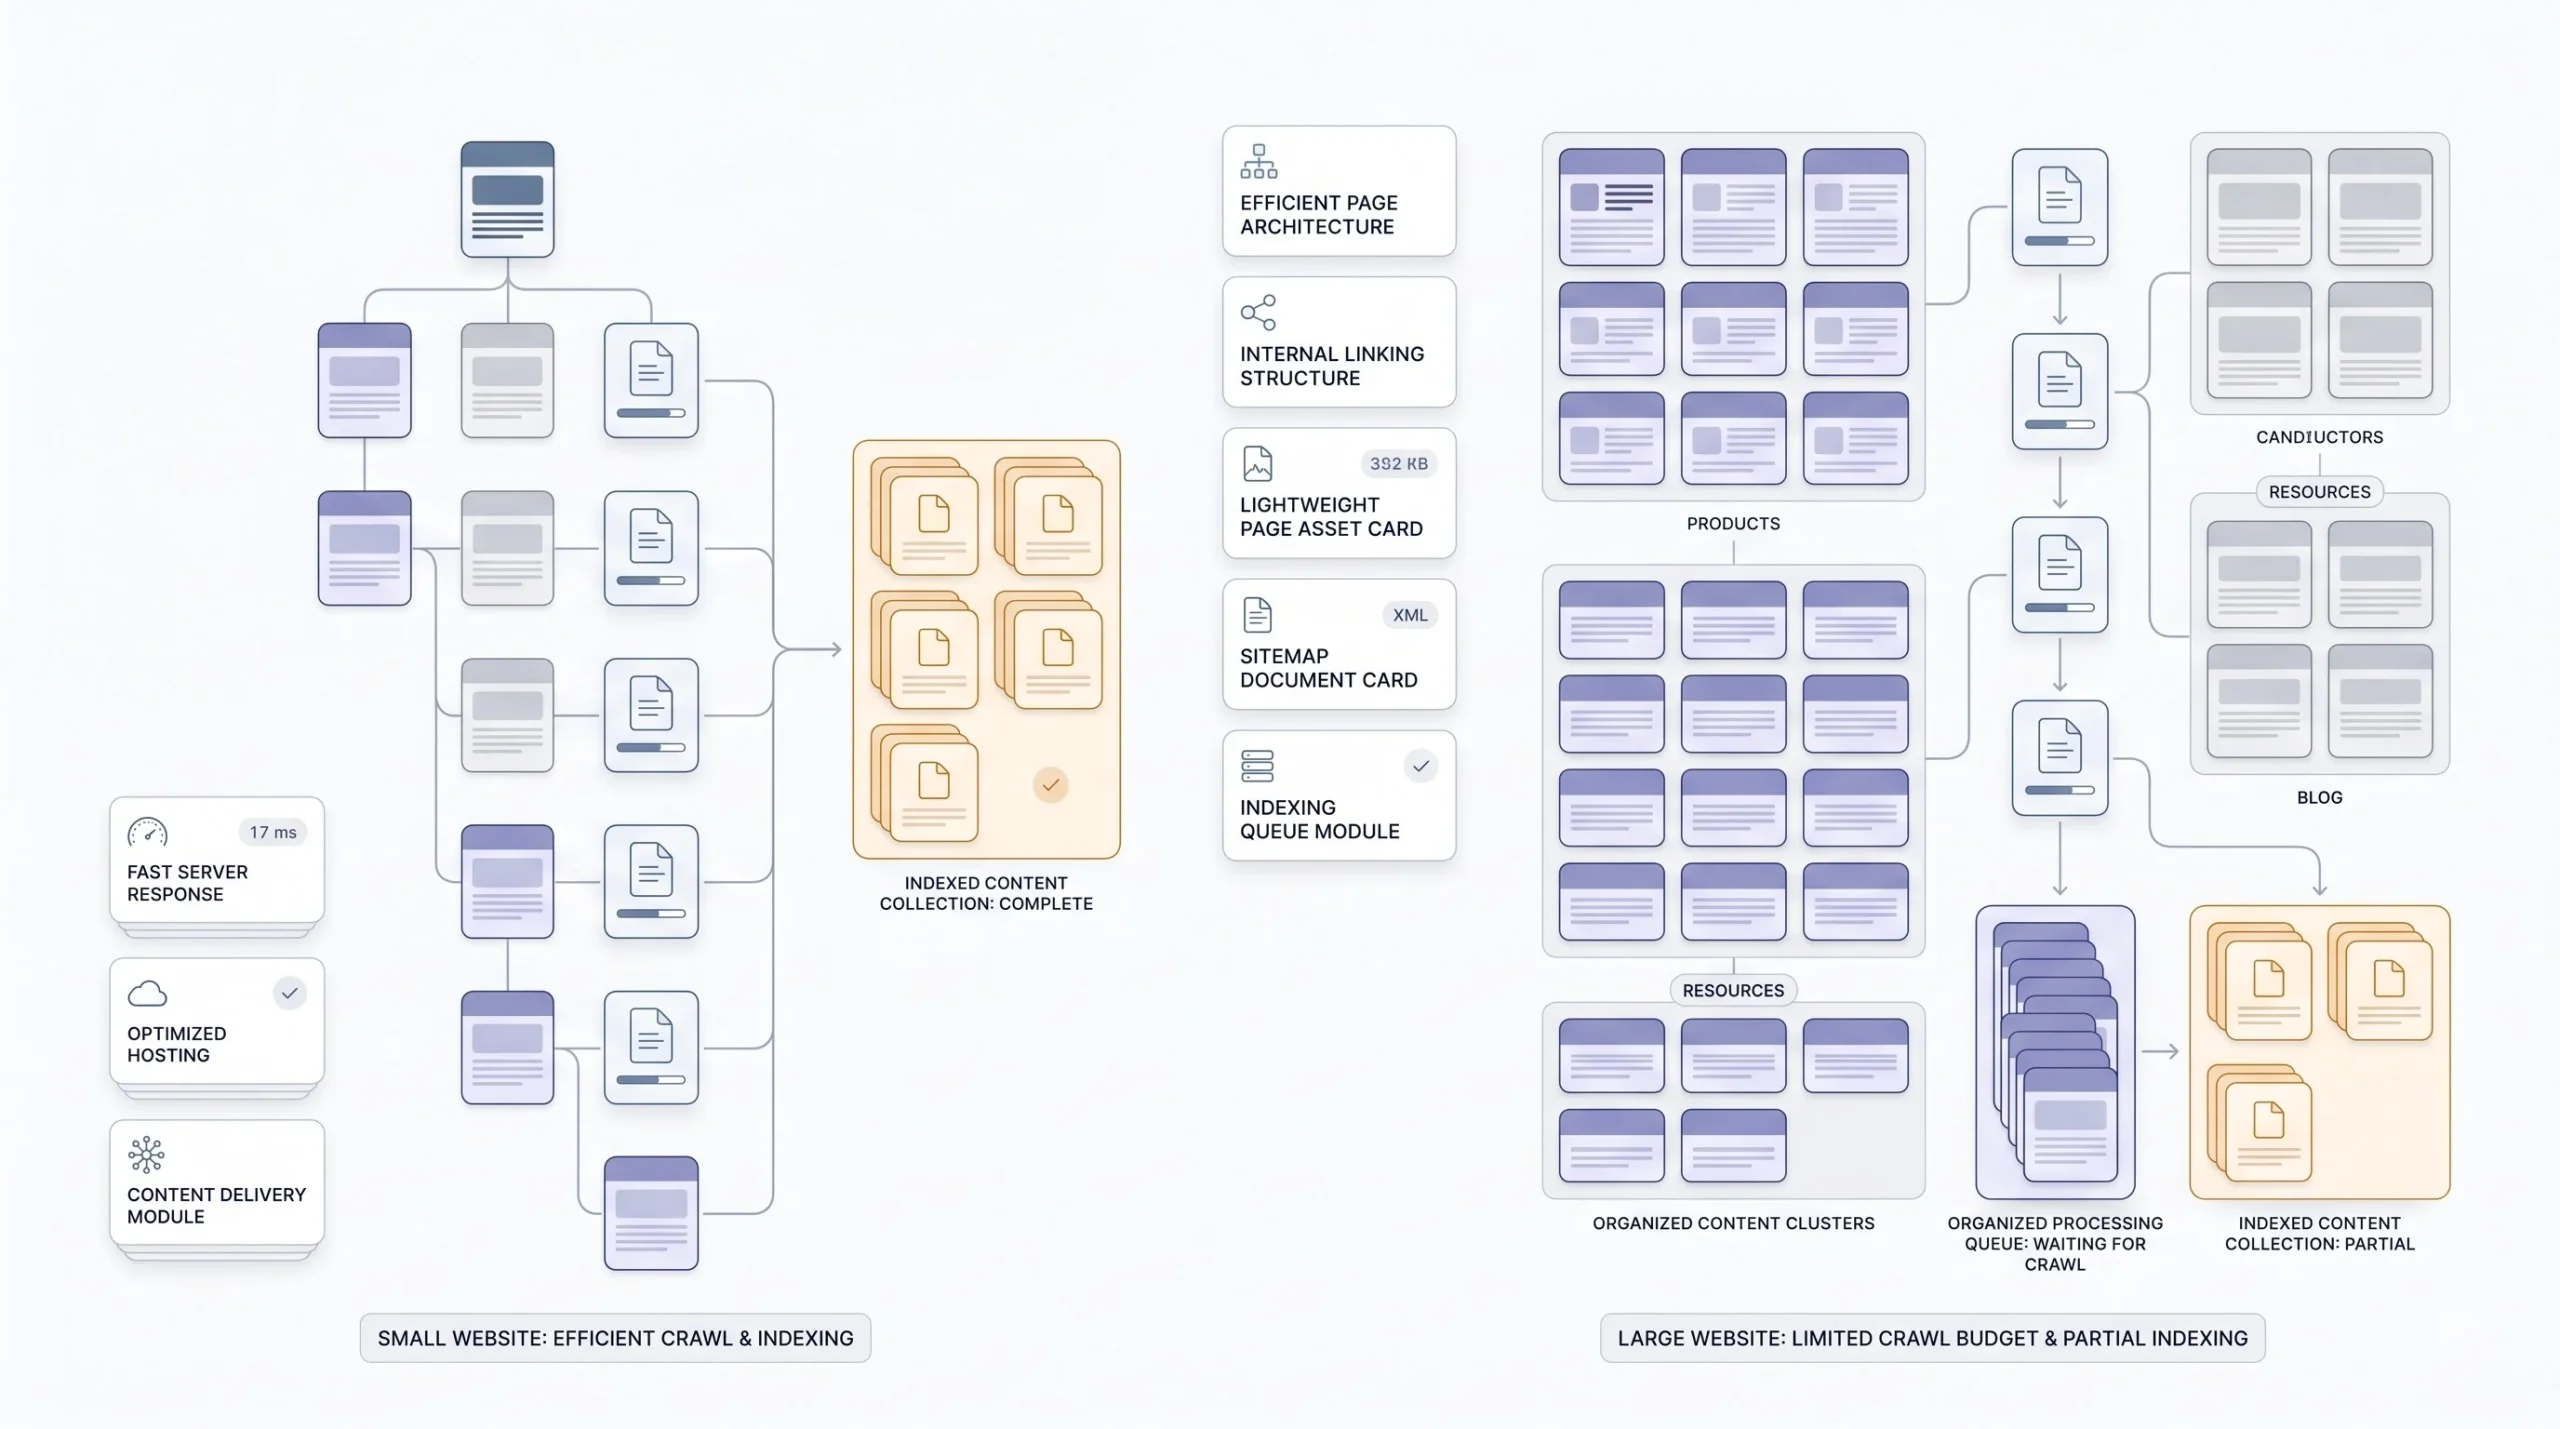
Google doesn’t have infinite time to spend crawling your site. Every site gets what’s basically an allowance, called crawl budget, and Googlebot spends that allowance visiting pages, reading them, deciding what’s worth indexing. If your server is slow to respond, Googlebot simply gets through fewer pages in the same window of time it would’ve spent on a faster site. That’s not theory, that’s just arithmetic. Slower response, fewer pages crawled per visit, plain and simple.
This hits harder the bigger your site gets. A ten-page brochure site with sluggish hosting is annoying, sure, but survivable, Google will eventually crawl all ten pages regardless of how long it takes. A five-hundred-page blog, or an ecommerce catalog running into the thousands, is a completely different situation. Slow server response there means some pages get crawled less often, and freshly published content can take longer to even show up in search at all.
Rankings and the Page Experience Signal
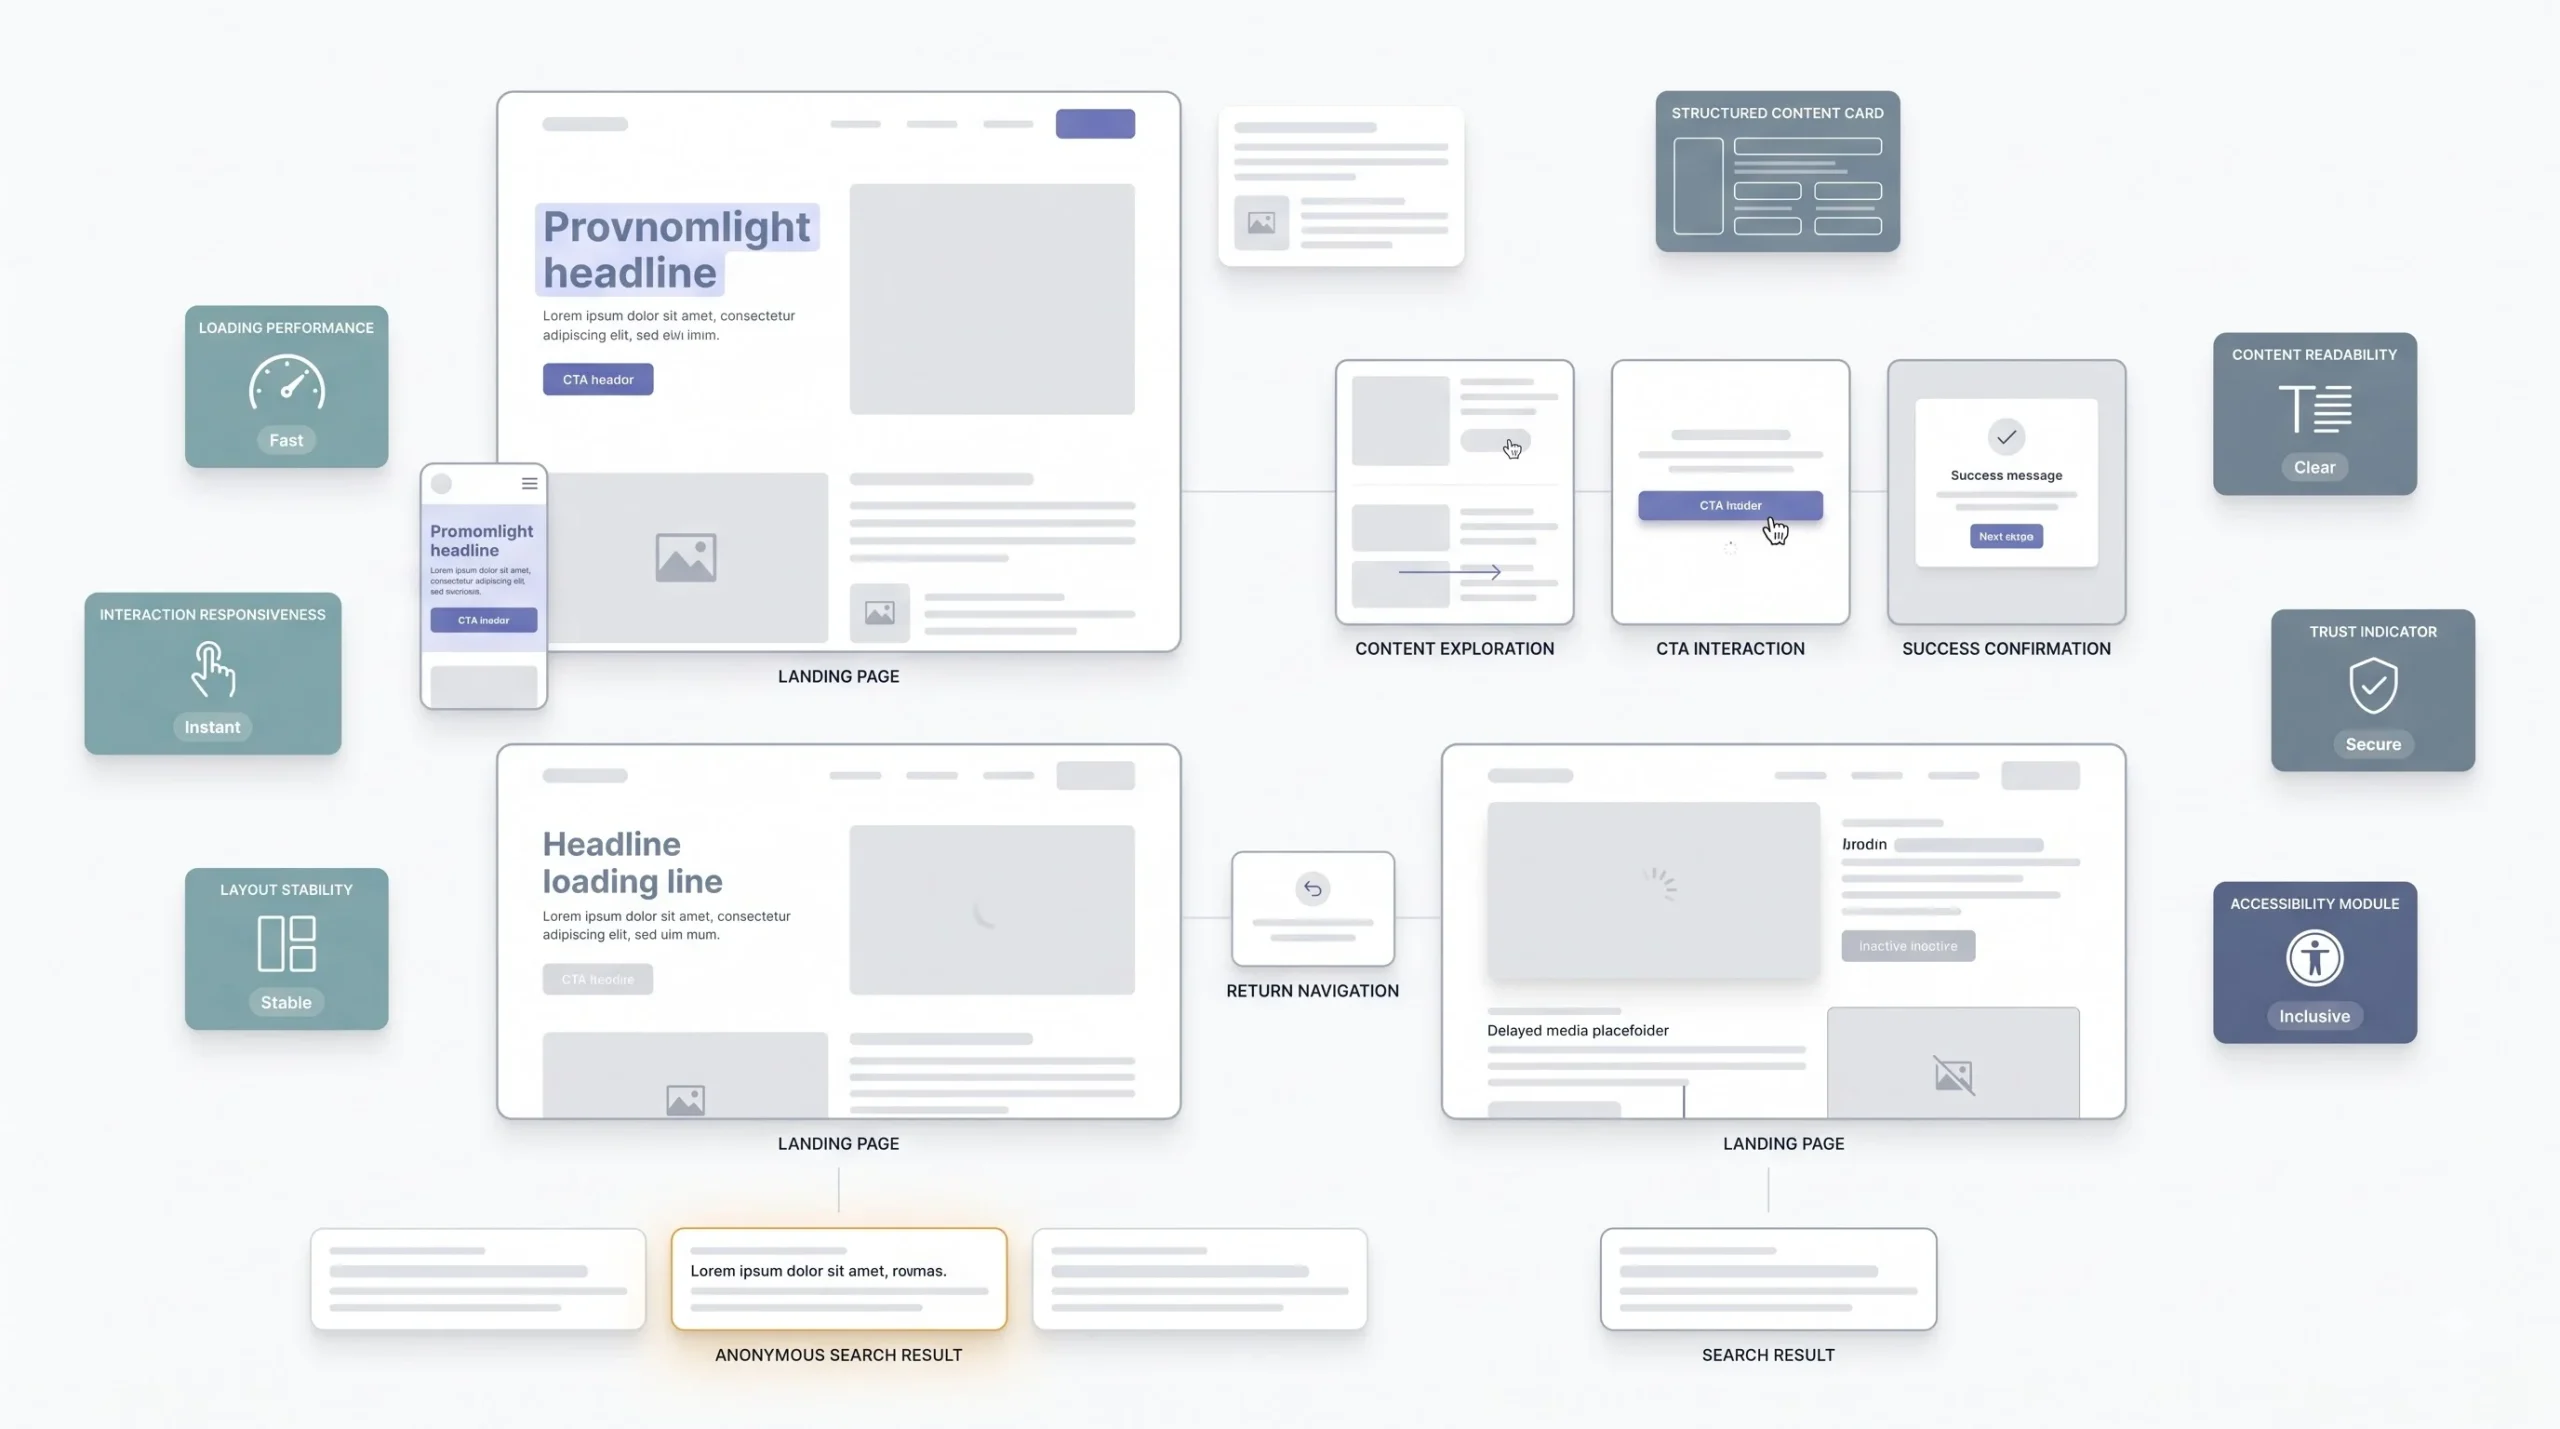
This is where the direct and indirect effects blur together. Core Web Vitals feed straight into how Google scores page experience, which factors into rankings, especially when two competing pages are otherwise pretty evenly matched on content quality. But the bigger story, honestly, is behavioral. Slow pages produce higher bounce rates. People land, they wait, they get annoyed, they leave, sometimes before your content even finishes rendering. Shorter dwell time follows that same pattern, because a frustrated visitor isn’t sticking around to read your carefully written six paragraphs.
There’s also pogo-sticking, a slightly odd name for when someone clicks your result, bounces straight back to the search results page, and clicks a different result instead. That’s about as clear a signal as Google ever gets that your page didn’t deliver, and speed alone can trigger that outcome even when your content is genuinely solid.
Mobile Rankings Specifically
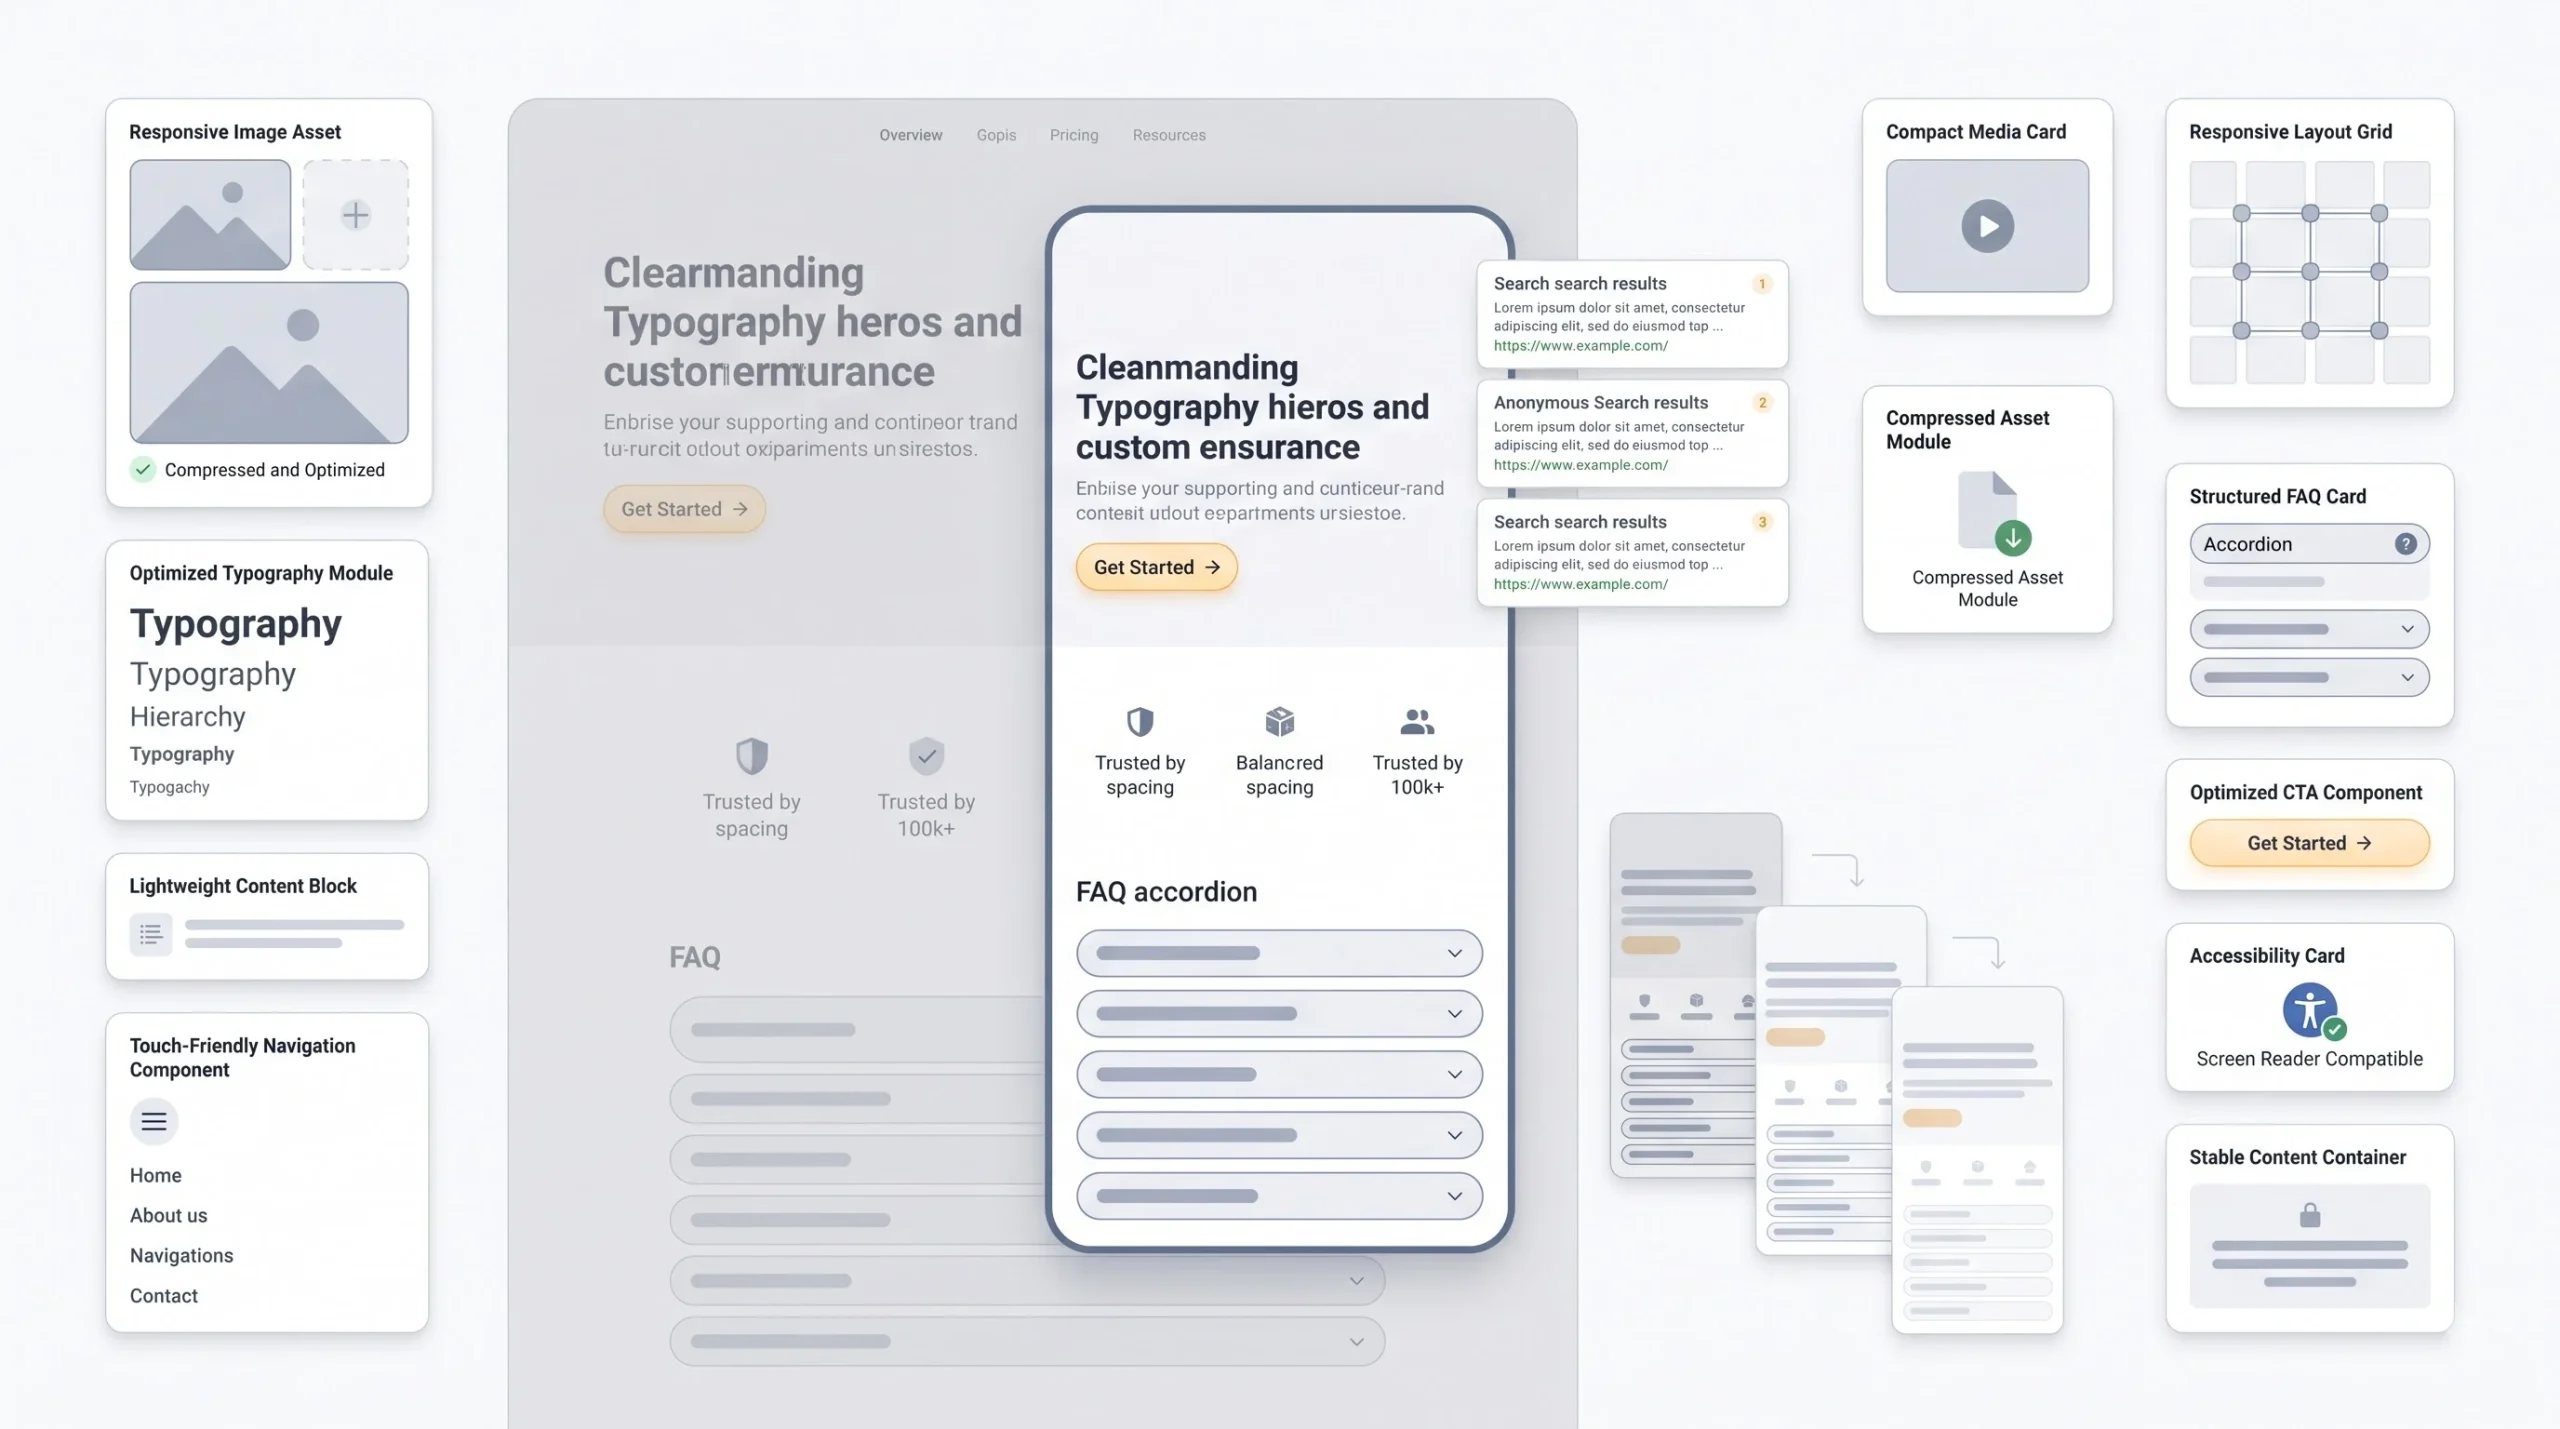
Mobile-first indexing means the mobile experience is the one getting evaluated first and weighted heaviest, full stop. If your desktop site loads fine but the mobile version drags, that’s the version Google is actually basing its judgment on. And mobile networks are wildly inconsistent depending on where someone is. Someone on solid home wifi is a completely different experience from someone on patchy mobile data in a smaller town, where a heavy, image-loaded homepage can take noticeably longer just to become usable. If a meaningful chunk of your audience is browsing on mobile data instead of wifi, mobile speed stops being optional. It becomes the whole ballgame.
| SEO Element | Effect of Slow Speed |
|---|---|
| Crawl budget | Fewer pages crawled and indexed per visit |
| Bounce rate | Higher, signals poor relevance to Google |
| Dwell time | Shorter, weakens topical authority signal |
| Mobile rankings | Penalized more heavily than desktop |
| Rich results eligibility | Some SERP features tied to page experience thresholds |
None of this is one dramatic lever that tanks your rankings overnight. It’s death by a thousand tiny cuts. Slightly worse crawl efficiency here, slightly worse bounce behavior there, a mobile score that’s just okay instead of good. Stack that up over six months and it turns into a real, visible gap between you and a competitor who fixed their speed a year before you did.
How Site Speed Impacts Conversions
SEO is one half of this. But honestly, this next part should worry you more, because it’s not about search engines reading signals. It’s about real people, real money, people who were genuinely ready to buy and walked away because your page made them wait.
The Psychology of Waiting

Nobody sits down expecting to wait for a website. That’s just not how brains work anymore, whether we like it or not. Someone clicks a link because they want an answer, a product, a form, right now, not in a few seconds. The instant there’s a gap between clicking and seeing something happen, doubt creeps in. Did it work? Is this broken? Should I just go back and pick a different result? That doubt doesn’t need to sit there long to do real damage. It just needs to last long enough for a thumb to twitch toward the back button.
This is the part people consistently underestimate. Two seconds doesn’t sound like much when you say it out loud. But sitting there staring at a half-loaded, stuttering screen, two seconds feels completely different. It feels like the site stalled out entirely.
Bounce Rate and Abandonment

Slower pages get abandoned more. Not controversial, just cause and effect playing out the way it always does. Someone lands, the page takes its sweet time, they’re gone before they even see what you had to offer them. This shows up everywhere across a site, but it shows up worst on ecommerce checkout pages specifically. Somebody has already decided to buy. Card in hand, mentally or literally. Then the checkout page hangs for a couple seconds loading a payment widget or a tracking script nobody remembers adding. That’s the single worst place on your entire site for speed to fall apart, because you’re losing someone who was already sold on saying yes.
Trust and Perceived Quality
Here’s something that doesn’t get talked about nearly enough. Speed isn’t purely a technical thing, it’s a trust signal, whether anyone consciously registers it or not. A slow site, even one packed with genuinely great content or a genuinely great product behind it, reads as unpolished. Unreliable. Like nobody’s really watching the shop. First-time visitors especially make snap judgments based on how a site feels in the first few seconds on screen, and a laggy, stuttering page quietly whispers “maybe this isn’t a serious business” without saying a word out loud. You never actually hear that objection. Nobody emails you saying “didn’t buy because your site felt slow.” They just leave, and you never find out why the number didn’t move.
Funnel-Stage Impact
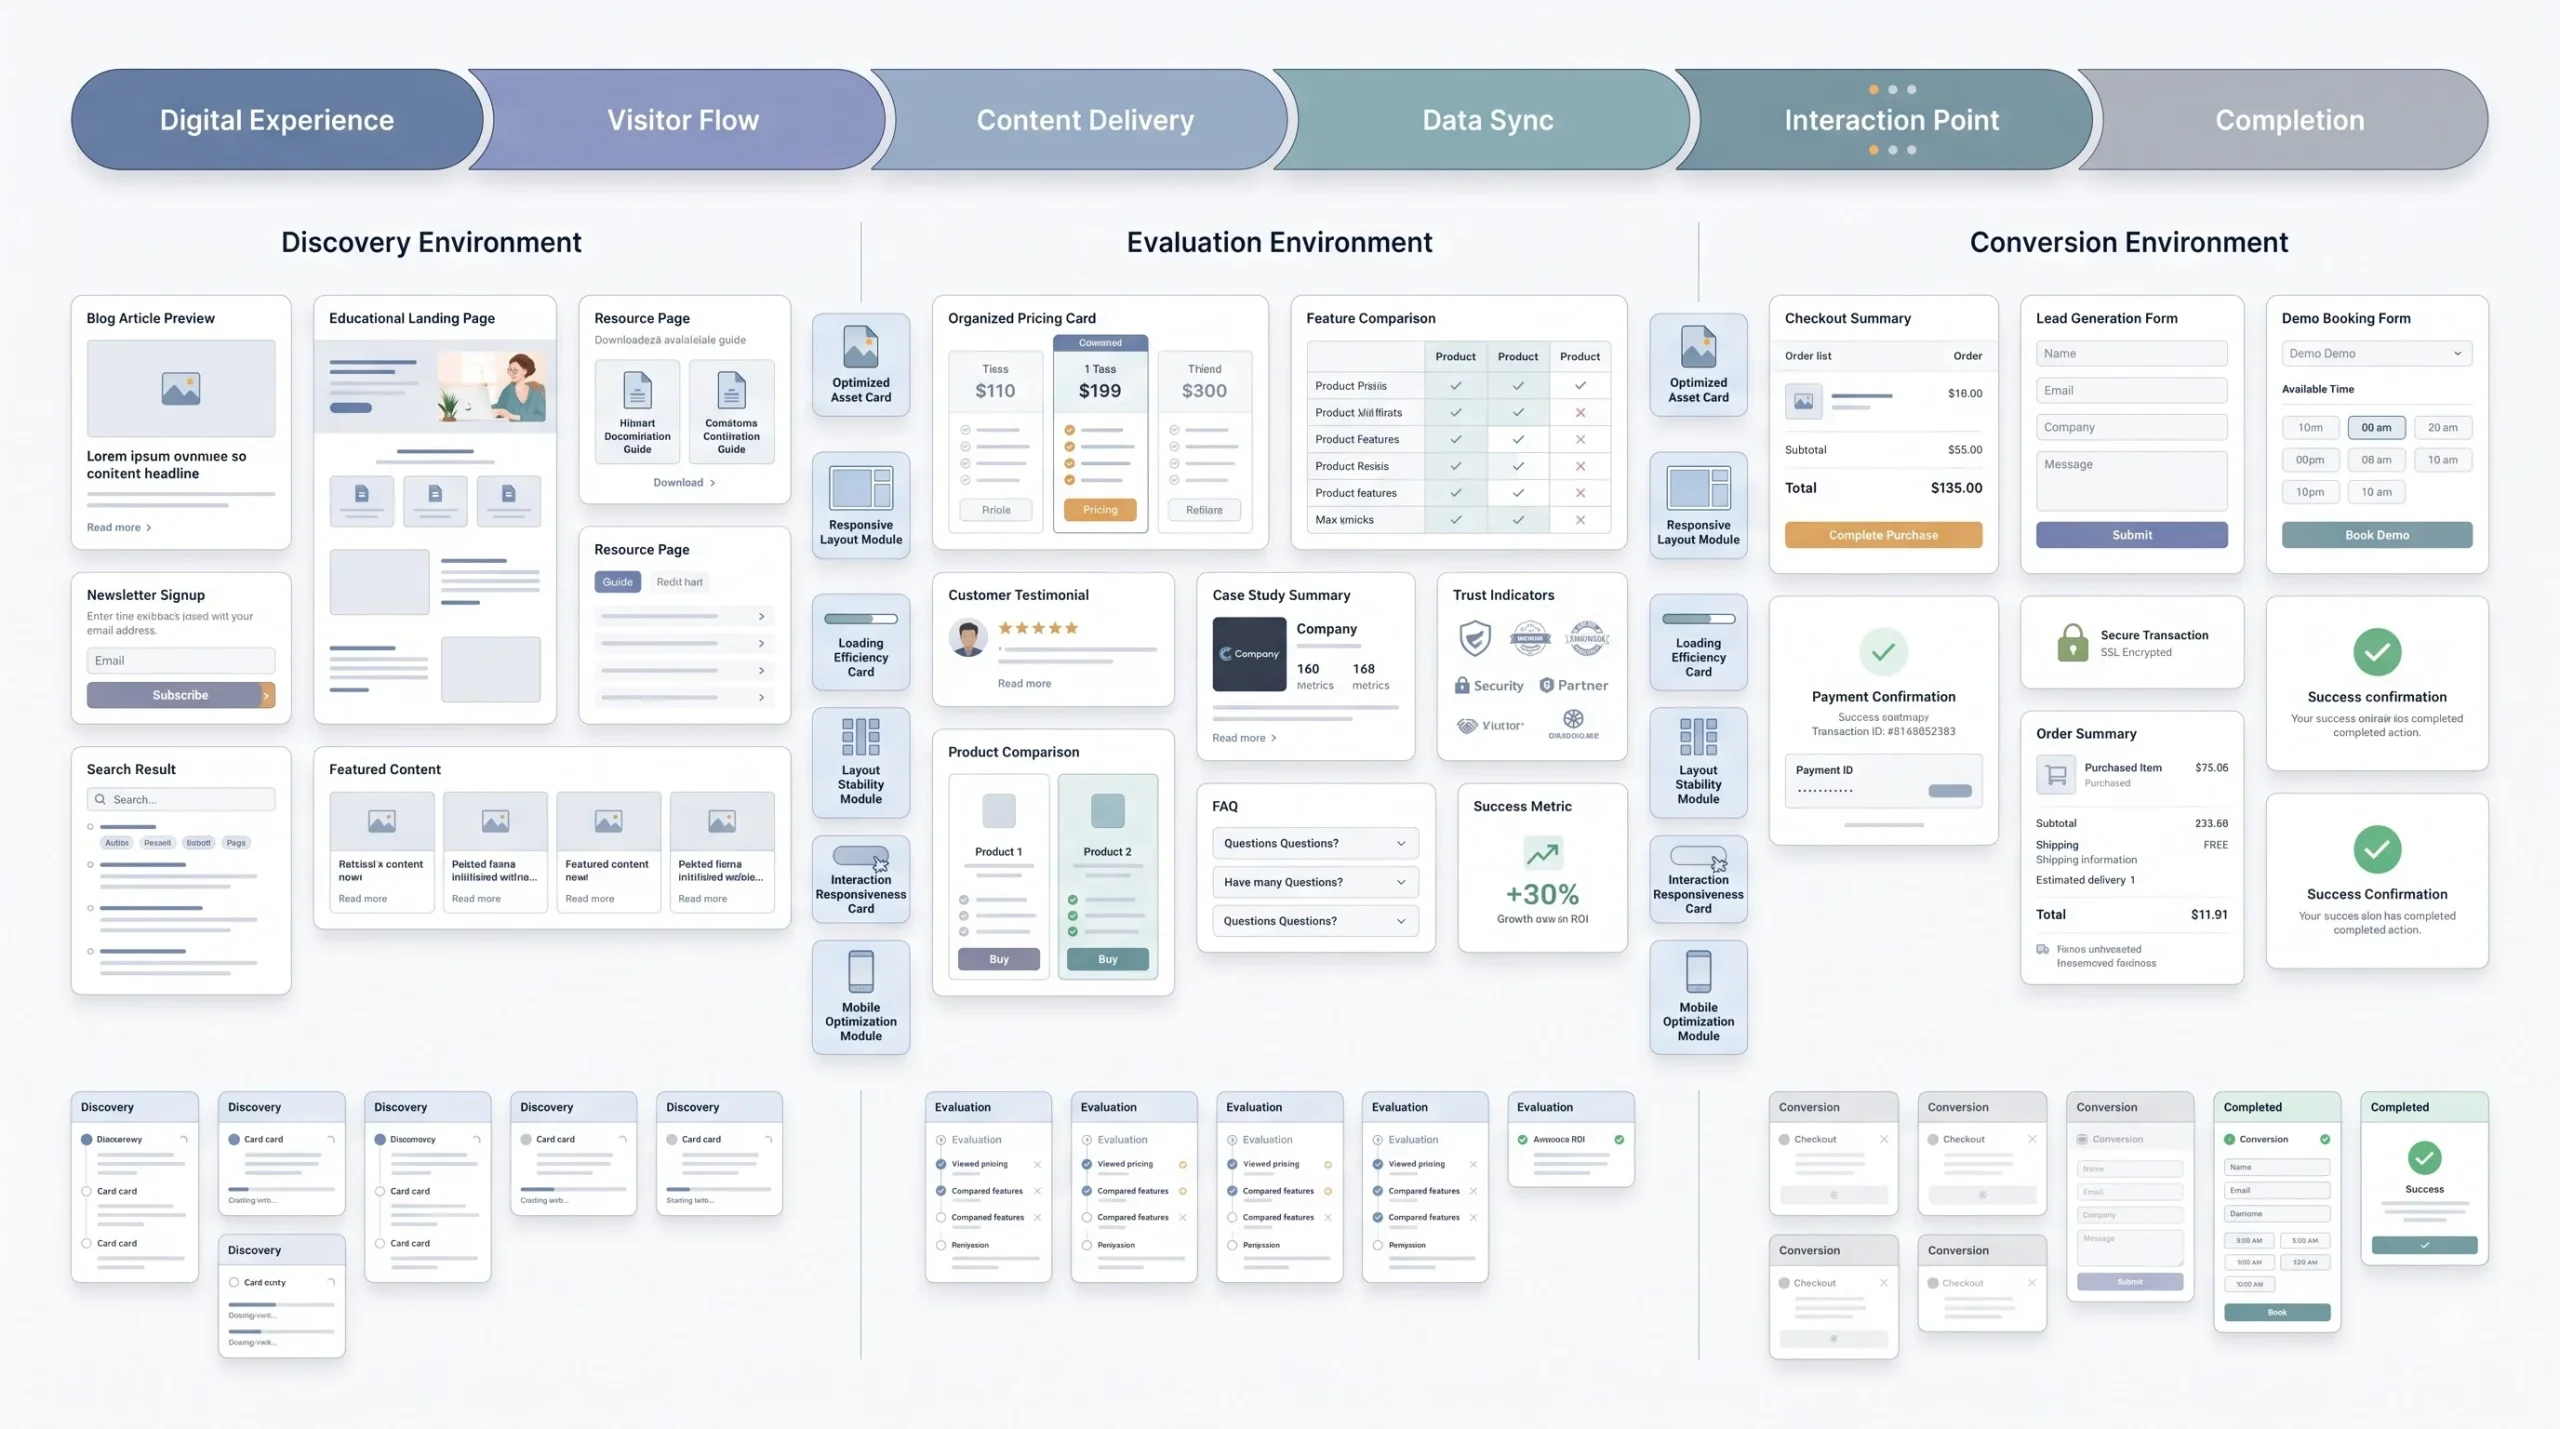
Worth mapping this against a standard TOFU, MOFU, BOFU structure, because speed doesn’t hit every stage of the funnel the same way, not even close.
At the top of the funnel, blog posts and landing pages are the front door. Slow load there and you’re losing organic visitors before they ever get the chance to sign up for your email list, let alone finish reading what you wrote. That’s traffic you worked hard for through SEO, wasted right at the entrance.
In the middle of the funnel, pricing pages, comparison pages, case studies, this is where people are actively weighing a decision in their heads. A slow page here doesn’t just annoy them, it interrupts the exact moment they were trying to think something through carefully. That interruption alone can be enough to make someone close the tab and never circle back to finish evaluating you against whoever else they’re comparing you to.
At the bottom of the funnel, checkout pages, contact forms, demo requests, speed touches revenue directly, no interpretation needed, no maybe. Slow page, fewer completed forms, fewer completed purchases. That’s it, no nuance required.
| Funnel Stage | Page Type | Cost of Slow Speed |
|---|---|---|
| TOFU | Blog, landing pages | Lost organic traffic retention, no email capture |
| MOFU | Pricing, comparison, case studies | Drop-off before consideration completes |
| BOFU | Checkout, contact form, demo request | Direct revenue loss, cart or form abandonment |
Every extra second of load time works like a small tax charged at every single stage of your funnel. It’s not one big hit that shows up on a report. It’s a toll booth nobody told you about, quietly collecting a little bit at every single stop along the way.
How to Measure Your Website’s Speed
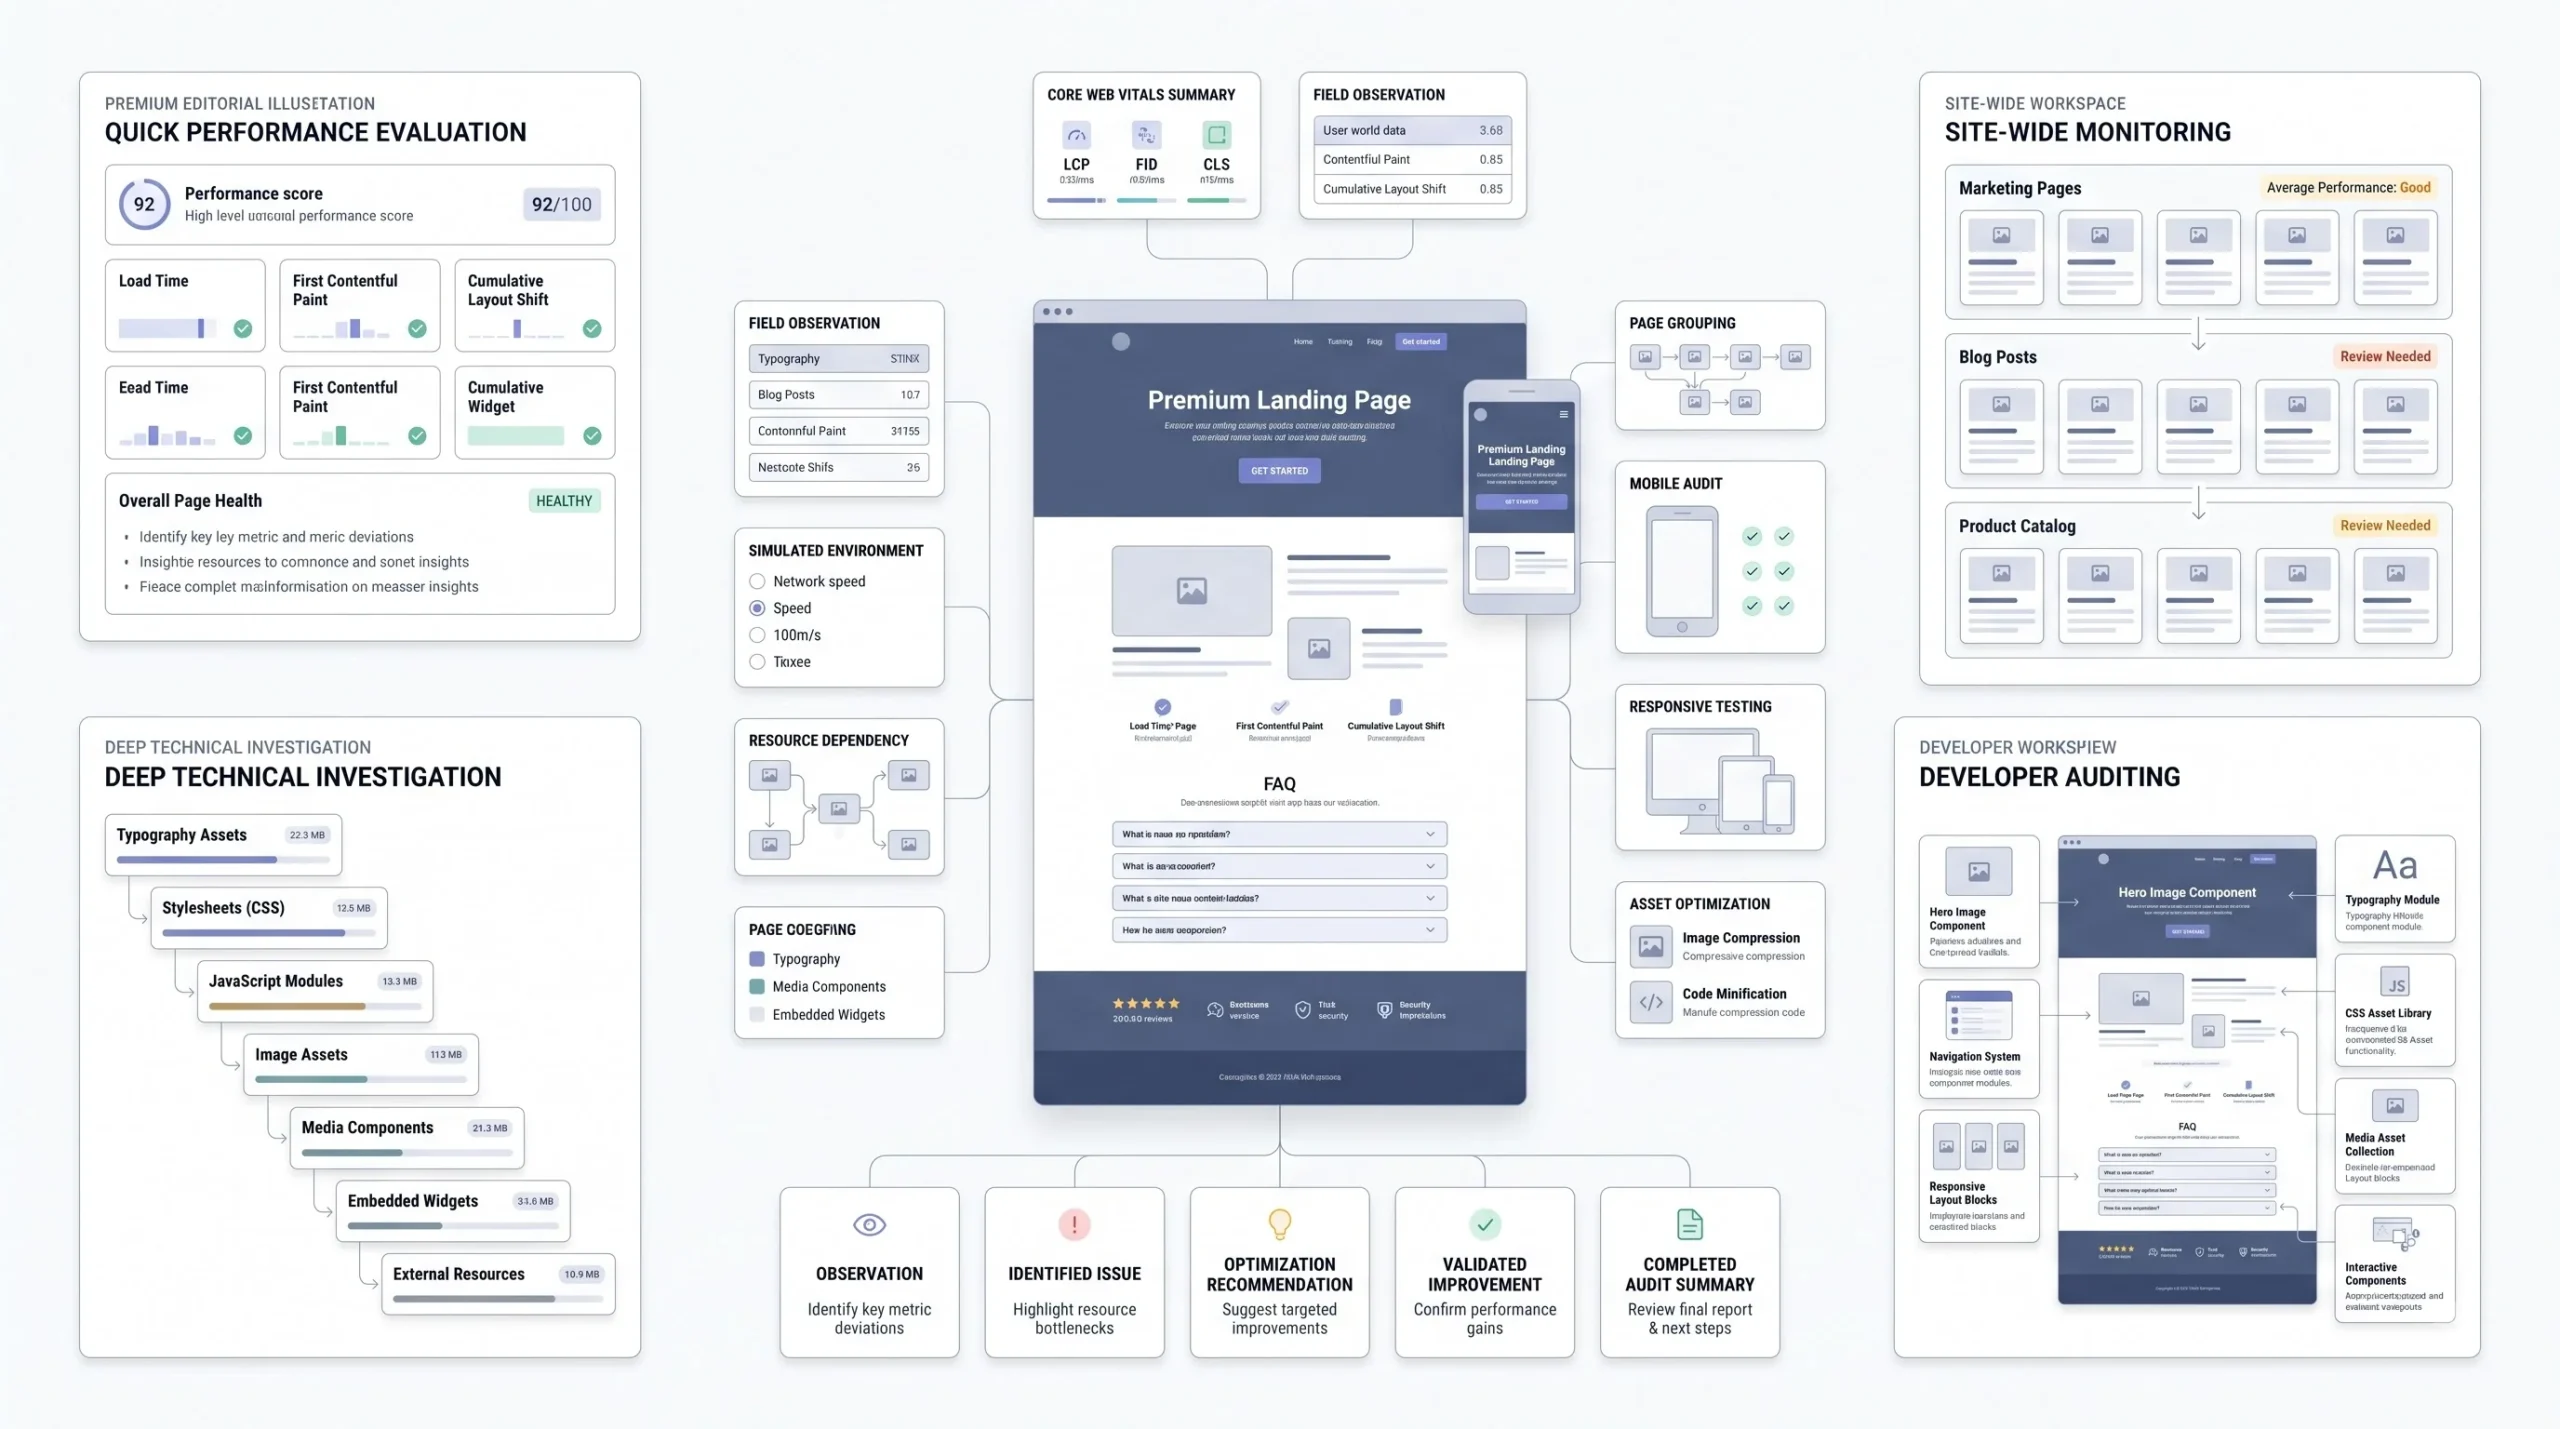
You can’t fix what you haven’t actually looked at, so before touching a single line of code or switching hosting providers, go pull up the real data first. Here’s where to look and what each tool is actually telling you underneath the number it shows.
Google PageSpeed Insights is the easiest place to start. Paste in a URL, and it hands you a score plus a full Core Web Vitals breakdown. Here’s the part most people skim past though. PageSpeed Insights shows two different kinds of data. Lab data comes from a simulated test run in a controlled environment, basically a snapshot of how the page performs under one specific test condition on one specific run. Field data, when it’s available, comes from actual visitors who loaded your page in the real world over the past twenty-eight days. Field data is the one that matters more, because it reflects what real people, on real devices, on real networks, actually experienced, not a lab simulation. Lab data is useful for debugging a specific issue. Field data is useful for knowing the truth about your site.
Google Search Console’s Core Web Vitals report gives you that field data view, but at a site-wide level instead of one page at a time. Instead of testing individual URLs, it groups your pages by performance and flags which groups need attention first. This is where you go for the big picture, not a single-page snapshot.
GTmetrix goes a layer deeper than PageSpeed Insights does. It hands you a waterfall chart, essentially a visual timeline showing every single resource loading on your page, in order, with exactly how long each one took to load. This is where you actually start spotting the one specific image or script that’s quietly dragging the whole page down.
Chrome DevTools, specifically the Lighthouse tab, is the developer-level option. If you or your dev team wants to run audits directly inside the browser without leaving the page being tested, this is the tool for that. It’s essentially the same engine running behind PageSpeed Insights, just running locally on your own machine.
| Tool | Best For | Data Type | Free? |
|---|---|---|---|
| PageSpeed Insights | Quick diagnostics and Core Web Vitals | Lab and Field | Yes |
| Search Console | Site-wide monitoring over time | Field | Yes |
| GTmetrix | Detailed waterfall breakdown | Lab | Freemium |
| Lighthouse (DevTools) | Developer-level audits | Lab | Yes |
Start with PageSpeed Insights, check the field data if there’s enough traffic for it to show up, then move to GTmetrix once you know which specific pages actually need real attention. Don’t skip straight to guessing what’s slow based on a hunch. Test first, then fix, in that order, every time.
What Actually Slows Down a Website
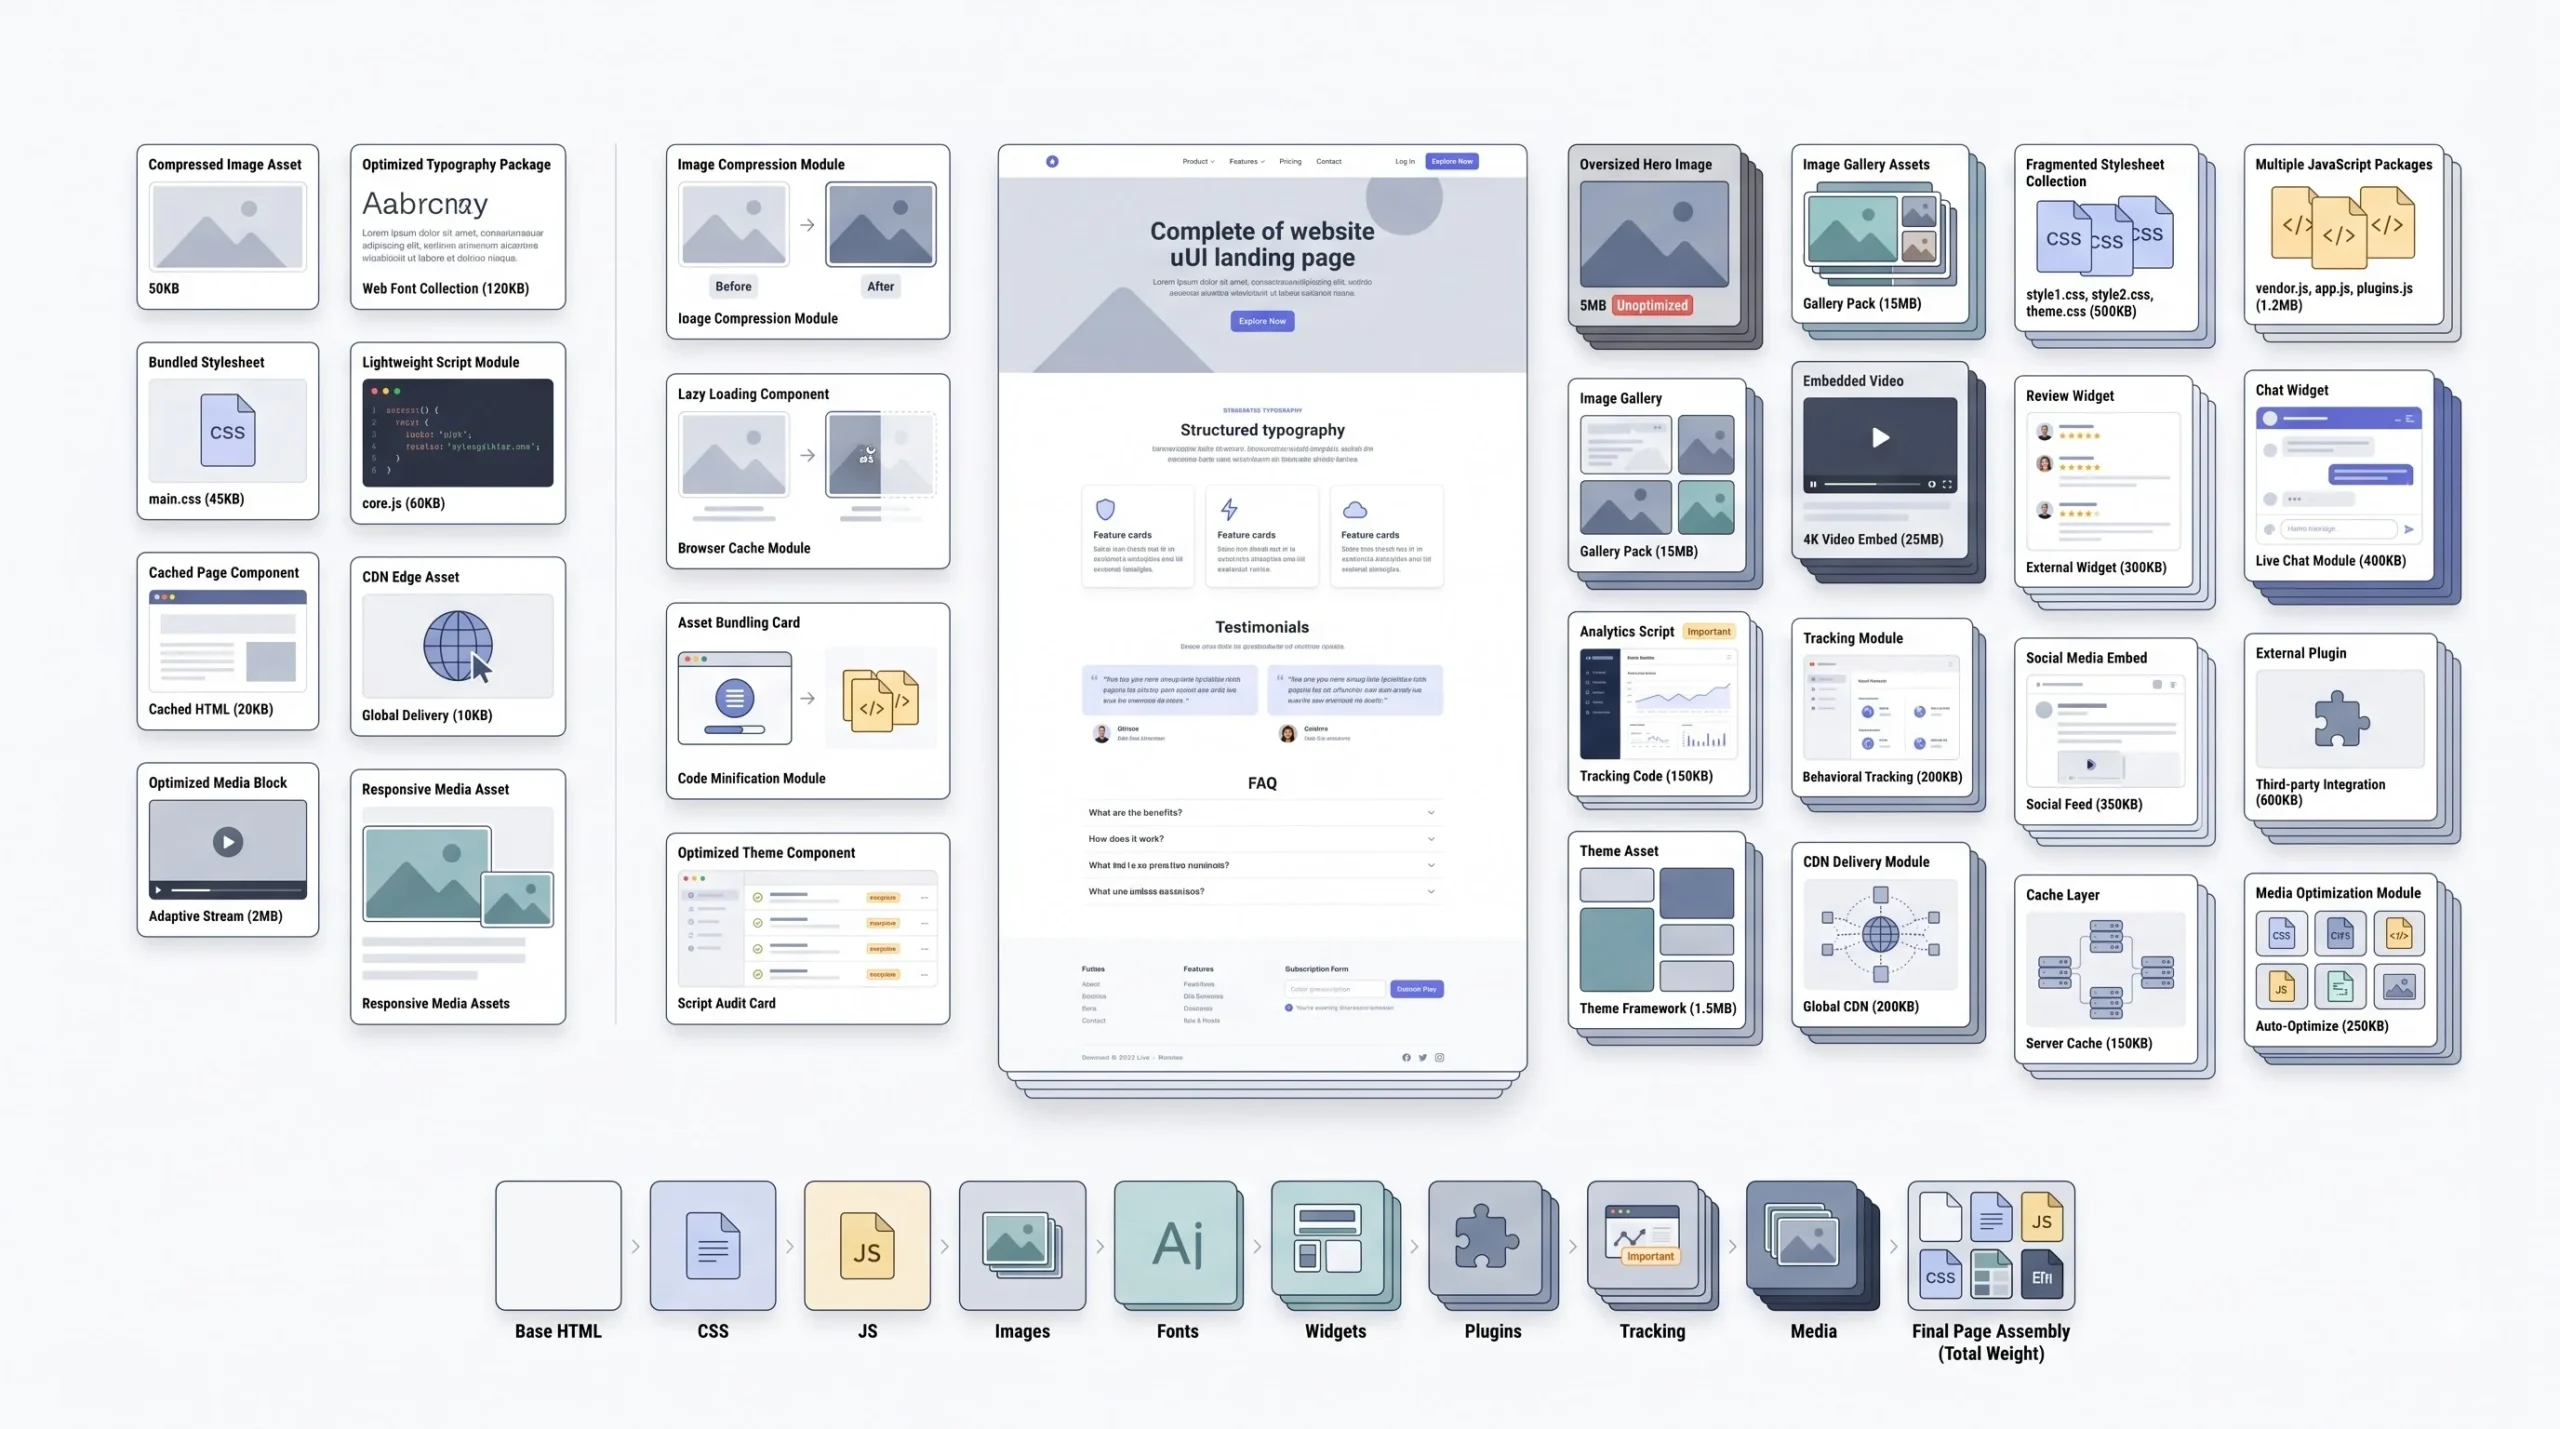
Now for the part everybody actually wants answered. What’s causing the slowdown in the first place? Here’s the real list, no filler padding it out.
Unoptimized images are the single most common culprit, and it’s not even close. Somebody uploads a five-megabyte photo straight off a phone or a camera without compressing it first, and now every single visitor has to download that entire massive file just to see a header image. This one issue by itself is often responsible for the majority of a page’s slowness, more than people expect.
Too many, or unminified, CSS and JavaScript files add up fast, quietly. Every separate file is a request the browser has to make. Every uncompressed file is extra bytes the browser has to download and then process before it can even start rendering anything visible.
No caching, or a poorly configured cache, means your server rebuilds the entire page from scratch on every single visit instead of serving up a stored, ready-to-go version it already built once. That’s wasted work happening on every single request, every time, forever, until someone fixes it.
Bad or slow hosting shows up first as a bad TTFB. If your server takes its sweet time responding at all, everything downstream of that response gets pushed back too. This is often the least visible problem of the bunch, because it doesn’t show up as an obvious broken element on the page, it just quietly slows everything from the very first moment.
Too many third-party scripts is a sneaky one that builds up over years. Ad tags, tracking pixels, chat widgets, review plugins, they each add their own loading time, and a lot of them actively block the page from becoming interactive while they’re loading. Most sites accumulate a pile of these over time without anyone ever going back to audit what’s actually still needed versus what’s just sitting there.
Render-blocking resources are scripts or stylesheets the browser has to fully load and process before it can paint anything visible on screen at all. If those files are large, or placed poorly in the code, the entire page sits there waiting on them before it can do anything.
No CDN means every single visitor, no matter where in the world they’re browsing from, is pulling your content from one single server location. Someone far away from that server experiences noticeably more delay than someone sitting close to it. A CDN fixes this by storing copies of your site at multiple locations closer to wherever your visitors actually are.
Bloated themes and page builders are a quiet killer, especially common on WordPress sites running heavy drag-and-drop builders. A lot of these load a huge amount of code by default, styles and scripts for features you’re not even using, just in case you might need them someday. That default bloat adds real, measurable weight to every single page load, whether you asked for it or not.
| Problem | Why It Slows the Site | Typical Fix |
|---|---|---|
| Large, unoptimized images | Heavy file sizes delay rendering | Compression, WebP or AVIF formats, lazy loading |
| Unminified CSS and JS | More bytes to download and parse | Minification, bundling |
| No caching | Server rebuilds the page every visit | Browser and server-side caching |
| Slow hosting | High TTFB | Better hosting tier, closer server location |
| Excess third-party scripts | Blocking the main thread | Audit and remove unused scripts |
| No CDN | Distance between server and user | CDN implementation |
| Bloated theme or builder | Extra unused code loads by default | Lightweight theme, custom code where needed |
Most sites aren’t slow because of one dramatic, obvious problem. They’re slow because three or four of these have been quietly piling up for a while, unnoticed, until somebody finally runs a speed test and wonders what happened to their site.
How to Improve Website Speed

Fixing speed doesn’t mean tackling everything on this list at once, and honestly, trying to do that is how most people give up halfway through. It means knowing what gives you the biggest win for the least effort, and starting there before touching anything else.
Quick Wins
Compress your images and switch to modern formats like WebP wherever you can manage it. This alone often produces the single biggest visible jump in load time, because images are usually the heaviest thing sitting on a page. Turn on browser caching so returning visitors aren’t redownloading the entire site from scratch every time they come back. And go through your plugins and third-party scripts, ruthlessly, and cut anything that isn’t actually earning its place anymore.
Medium Effort Fixes
Minify and combine your CSS and JavaScript files so the browser has fewer, smaller files to deal with on each request. Add lazy loading for images and videos, so anything below the fold doesn’t load at all until someone actually scrolls down to it. And implement a CDN if you haven’t already, especially if your visitors are spread across different regions or countries.
Bigger Structural Fixes
Sometimes the real problem is the hosting itself, and no amount of image compression is going to fix a server that’s fundamentally too weak or overloaded for the traffic hitting it. That means upgrading to a better hosting tier, or moving to a server located closer to your main audience geographically. Sometimes the problem is the theme or page builder, and the actual fix is rebuilding on something leaner that doesn’t carry years of accumulated bloat behind it. For content-heavy sites specifically, moving toward server-side rendering or a more static setup can be worth the investment too, though that’s a bigger project than a weekend fix, and it’s worth planning properly rather than rushing.
| Fix | Effort | Impact | Priority |
|---|---|---|---|
| Image compression | Low | High | Do first |
| Enable caching | Low | High | Do first |
| Remove unused scripts | Low | Medium | Do first |
| Minify CSS and JS | Medium | Medium | Do next |
| Add a CDN | Medium | High | Do next |
| Upgrade hosting | High | High | Plan for |
| Theme rebuild | High | High | Plan for |
Fix the two or three things actually causing most of your slowdown before chasing every last fraction of a second. Speed optimization has diminishing returns past a certain point, and most sites never even get close to that point because they’re still stuck fighting the big, obvious problems sitting right in front of them.
Mobile Speed: A Section of Its Own
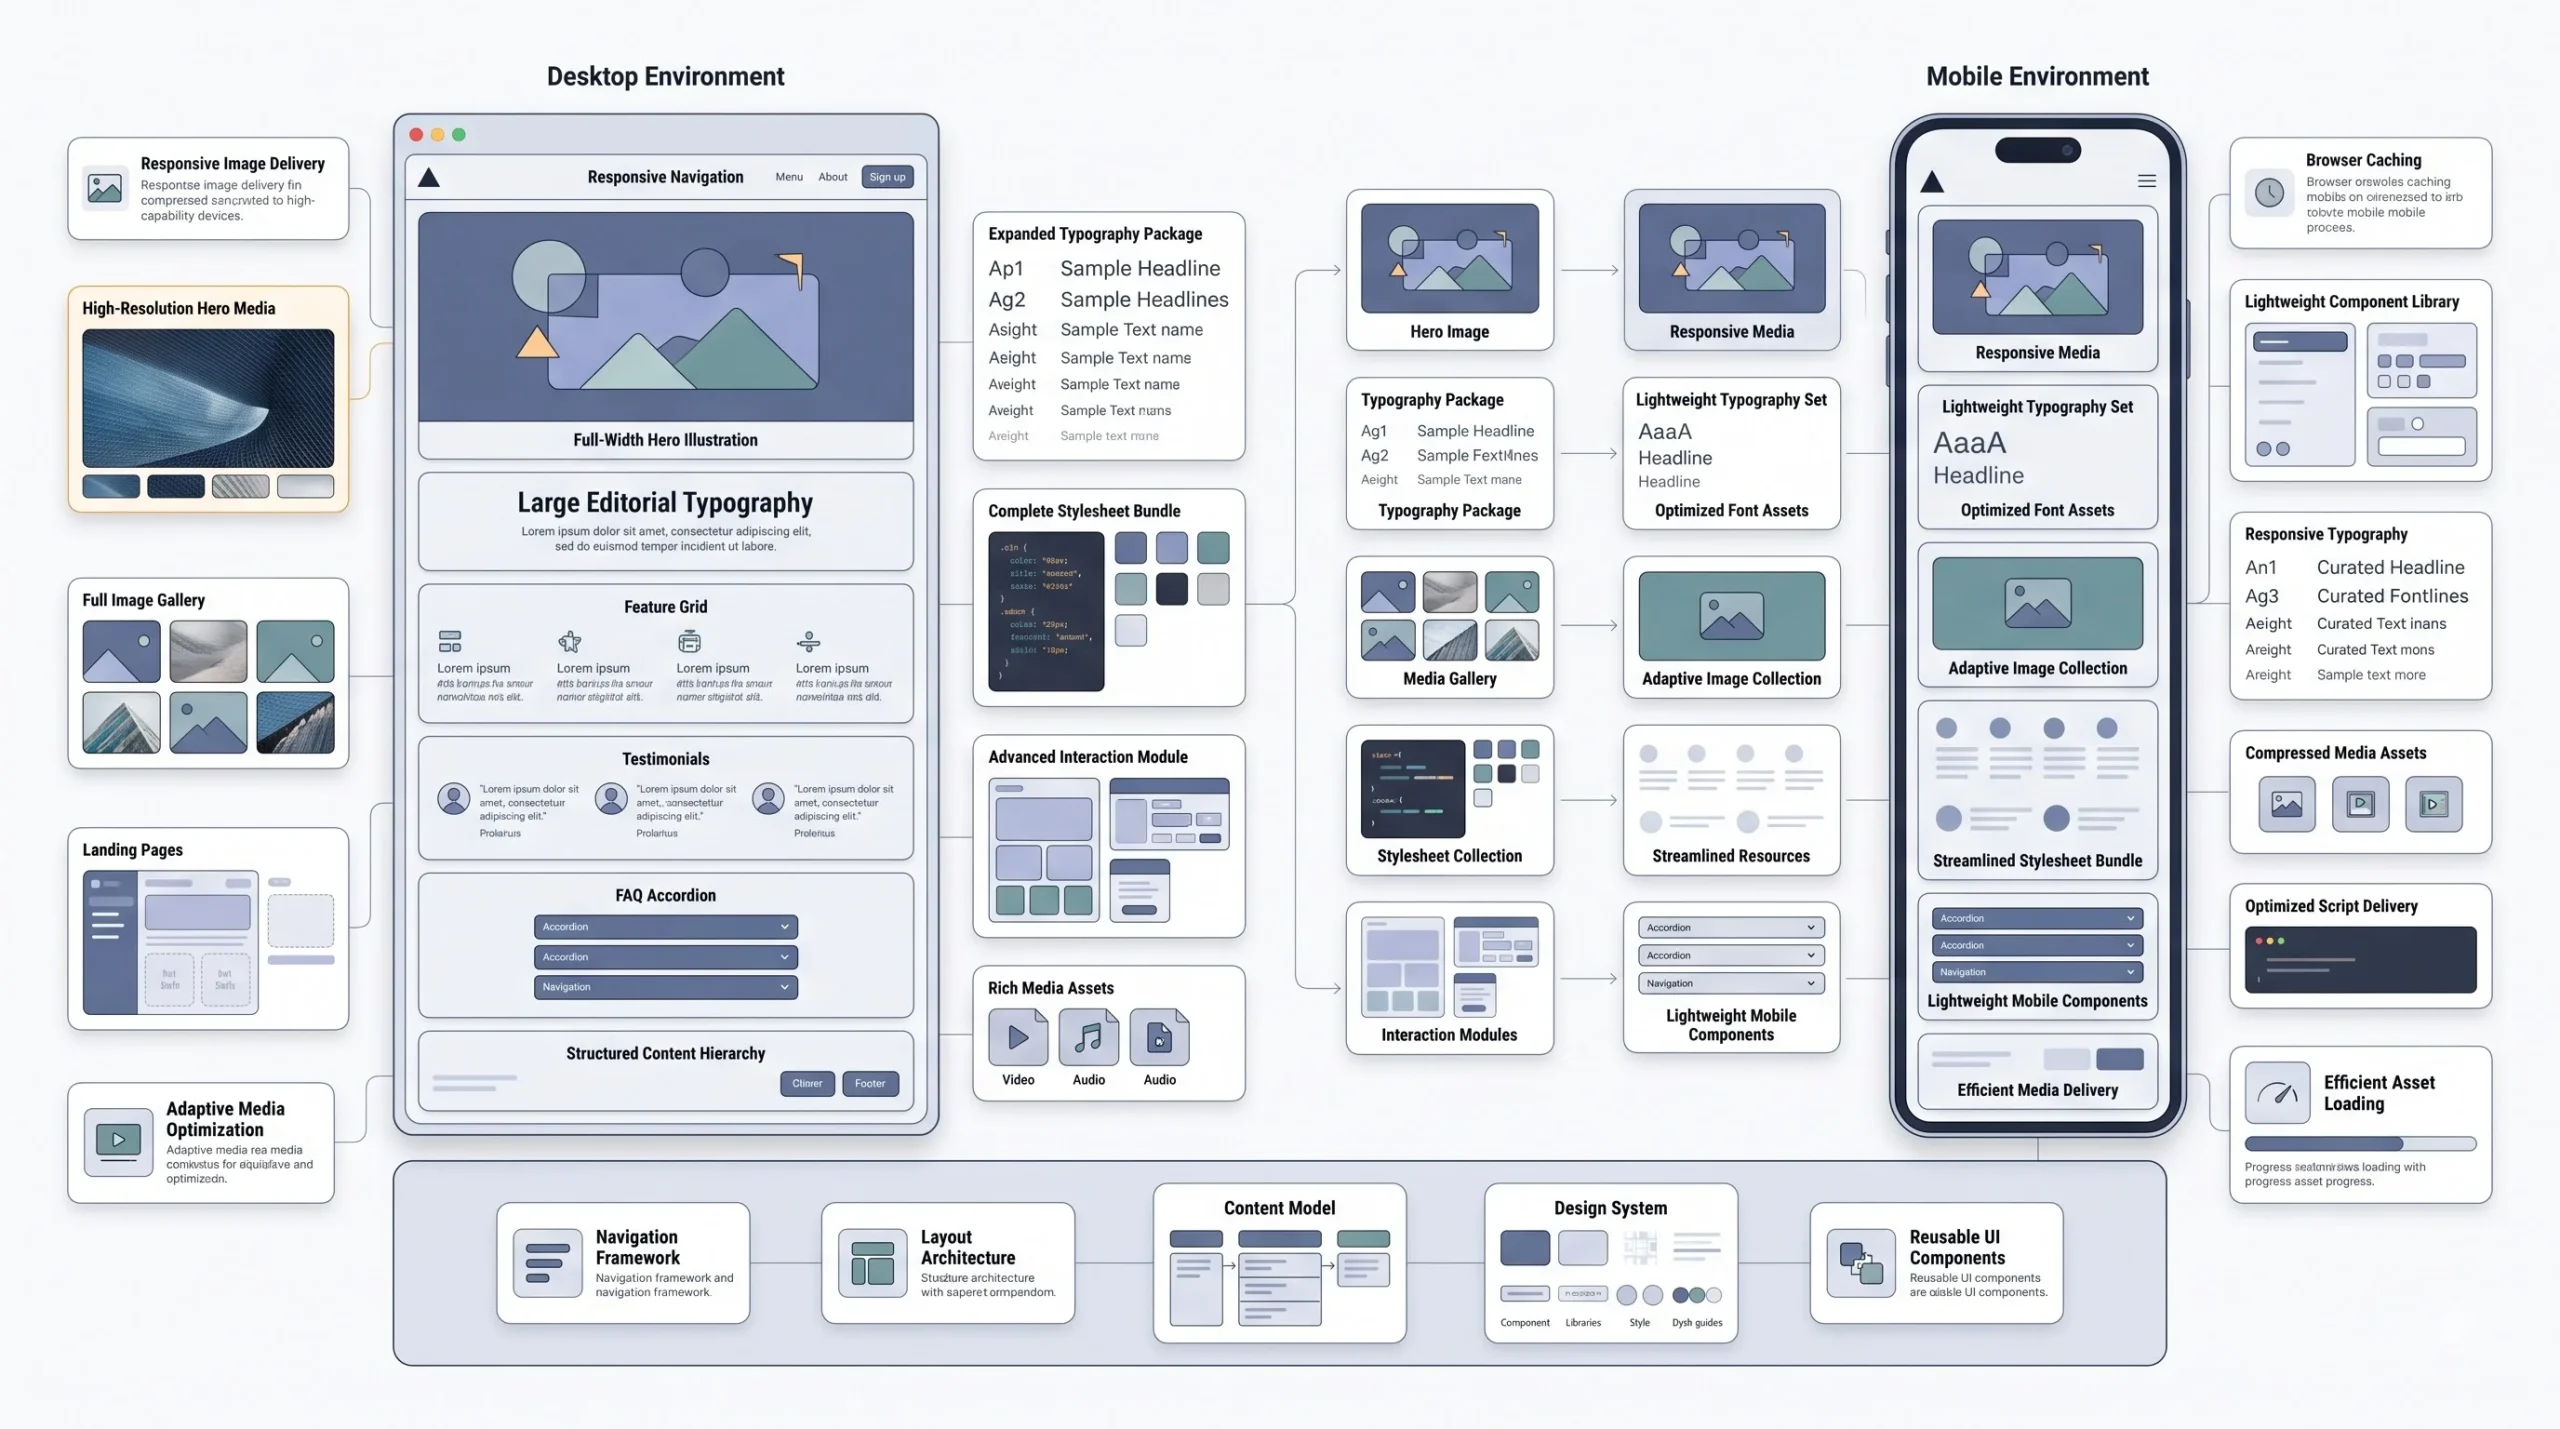
Mobile speed earns its own space here instead of getting buried inside the SEO section, because honestly, it’s a genuinely different problem to solve, not just a smaller version of the desktop one.
Desktop users are usually sitting on stable wifi with decent processing power backing them up. Mobile users are dealing with variable network conditions, strong signal one minute, weak the next, sometimes switching between wifi and mobile data mid-session without even noticing, and often on devices carrying less processing power than a laptop sitting on a desk. Put that combination together and a page that feels perfectly fine on desktop can feel genuinely sluggish on a phone, even though it’s technically the exact same page loading the exact same content.
Responsive image serving matters a lot here specifically, meaning the site should be sending smaller, appropriately sized images to mobile devices instead of forcing a phone to download the same massive desktop-sized image and just shrink it down visually after the fact. That’s wasted bandwidth for zero real benefit to anyone. Beyond that, the same fixes that help desktop speed, compression, caching, cutting third-party scripts, apply just as much, arguably more, to mobile, since mobile devices simply have less headroom to absorb inefficiency without it becoming noticeable.
Website Speed and User Experience
Step back for a second from SEO and from conversions, because underneath both of those sits one simple truth that’s easy to lose track of. Speed is a user experience metric first. Everything else, rankings, sales, form completions, is downstream of whether the actual experience of using the site felt good or felt frustrating in the moment.
That’s really all Core Web Vitals ever were, when you strip away the acronyms. Google’s attempt to put an actual number on something that used to be purely a gut feeling. “This site feels fast” or “this site feels janky” used to be something only a human could judge in the moment, nothing more scientific than that. Now there’s a measurable way to check it without relying on someone’s opinion. But the number itself was never really the point. The number is just Google’s best guess at whether a real person walked away happy or walked away annoyed.
Conclusion
Speed isn’t a line item you hand off to a developer once and then forget about for the next two years. It’s a business lever, and it’s touching both sides of growth at the same time, the traffic side and the revenue side, whether anyone on the team is paying attention to it or not. Every slow page is quietly costing rankings that could’ve been earned and sales that could’ve closed, and the frustrating part is none of it shows up as an obvious red flag inside the analytics. It just looks like normal traffic that didn’t convert, or search visibility that never quite climbed to where it should have.
Fixing it doesn’t require a full redesign or a massive budget to get started. Run a speed test today, right now, before closing this tab. Look at the actual numbers instead of guessing at what feels slow. Fix the two or three things doing the most damage first, then build from there. The sites winning on speed aren’t the ones chasing a perfect hundred score for bragging rights. They’re the ones who stopped ignoring the problem long enough to actually do something about it.
FAQs
1. How fast should my website load to be considered good?
Under 2.5 seconds for Largest Contentful Paint is the benchmark Google treats as good. Anything past that and you’re already in the range where visitors start noticing the wait, not just Google.
2. Does website speed directly affect Google rankings?
Partly directly, mostly indirectly. Core Web Vitals feed into page experience scoring, which plays a role especially when competing pages are otherwise similar. But the bigger effect comes through behavior, slow pages create higher bounce rates and shorter dwell time, and Google reads that behavior as dissatisfaction.
3. What’s the difference between page speed and Core Web Vitals?
Page speed is the broad, general idea of how fast a site loads. Core Web Vitals are three specific, measurable metrics Google uses as its official scorecard for that experience, LCP, CLS, and INP.
4. Why does my desktop site feel fast but my mobile site feels slow?
Mobile devices deal with inconsistent network conditions and generally less processing power than desktops or laptops. A page that loads instantly on stable wifi can lag noticeably on mobile data with weaker signal, even though it’s the identical page.
5. What’s the single biggest thing that slows down most websites?
Unoptimized images, by a wide margin. Large, uncompressed photos are usually the heaviest thing loading on any given page, and they’re also the easiest fix once identified.
6. Should I fix speed myself or hire a developer?
Quick wins like image compression, caching, and removing unused plugins are doable without deep technical skill. Bigger structural fixes, hosting migrations, theme rebuilds, server-side rendering, are worth bringing in a developer for.
7. How often should I check my website speed?
At minimum, check after any major update, new plugin, theme change, or redesign. Beyond that, a monthly check through Search Console’s Core Web Vitals report catches slow drift before it becomes a real problem.
8. Does a CDN actually make a noticeable difference?
Yes, especially if your visitors are spread across different regions or countries. Without one, everyone pulls content from a single server location, and distance from that server directly adds delay.
9. Can a slow website really hurt my conversion rate that much?
Yes. Checkout pages and forms are where this shows up hardest, because you’re losing people who had already decided to take action. The drop-off there is one of the most direct, unambiguous costs of slow speed.
10. Is PageSpeed Insights accurate, or should I use another tool too?
It’s a solid starting point, especially for field data from real visitors. But pairing it with GTmetrix for a waterfall breakdown gives a clearer picture of exactly which resource is causing the slowdown.
11. Do speed improvements show results in rankings right away?
No. Crawling, re-indexing, and behavioral signals accumulating all take time. Expect gradual movement over weeks and months, not an overnight jump.
12. Is AMP still worth using for website speed in 2026?
AMP’s relevance has faded significantly as Google shifted its ranking emphasis toward Core Web Vitals across all pages rather than favoring a separate AMP format. For most sites now, investing in genuine Core Web Vitals performance is the better use of time than building a separate AMP version.